
This consolidation has now lasted for about 12 weeks. The breakout should come soon now.
Volume and On Balance Volume are giving strong signals as to which direction the breakout is most likely to be. Members are offered some advice on how to approach this market this week.
Summary: A new high above 55.24 would indicate an upwards breakout, and the target would be 58.81. A new low below 51.22 would indicate a downwards breakout, and the target would be 28.61, minimum, with a next target possibly at 25.59.
New updates to this analysis are in bold.
MONTHLY ELLIOTT WAVE COUNT
Click chart to enlarge.
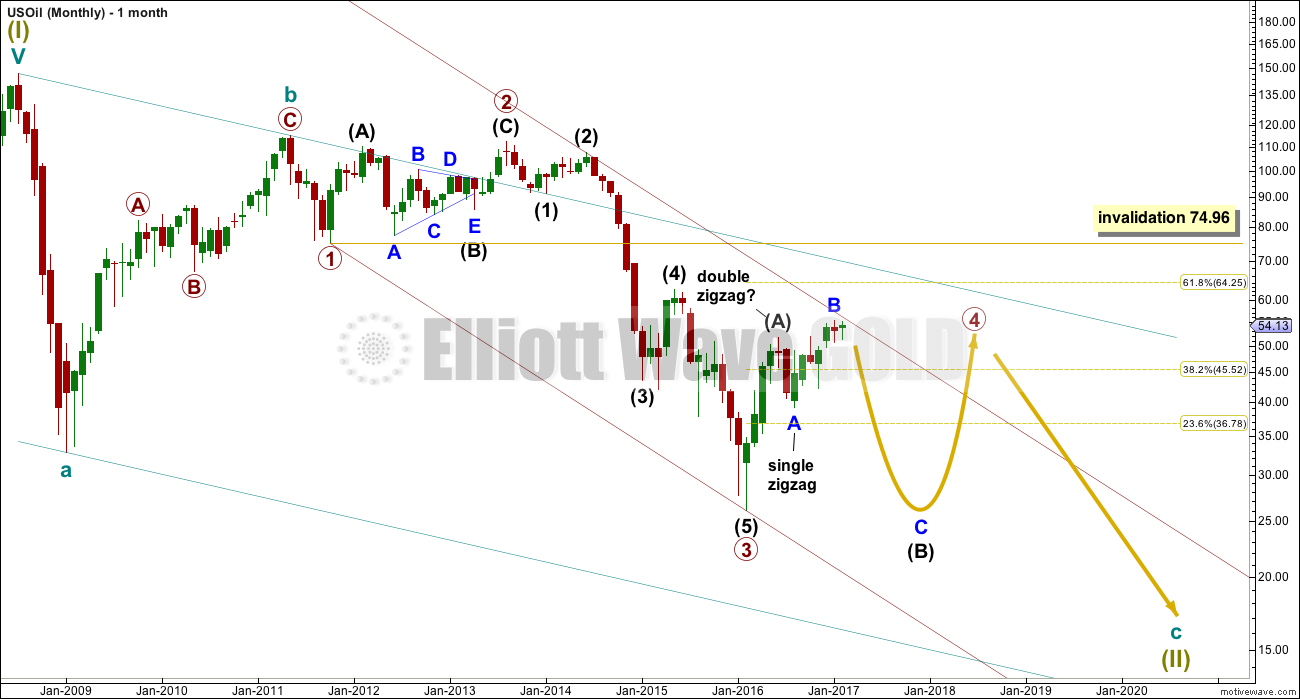
Within the bear market, cycle wave b is seen as ending in May 2011. Thereafter, a five wave structure downwards for cycle wave c begins.
Within cycle wave c, at this stage it does not look like primary wave 5 could be complete. That would only be possible if primary wave 4 was over too quickly.
Primary wave 1 is a short impulse lasting five months. Primary wave 2 is a very deep 0.94 zigzag lasting 22 months. Primary wave 3 is a complete impulse with no Fibonacci ratio to primary wave 1. It lasted 30 months.
Primary wave 4 is likely to exhibit alternation with primary wave 2. Primary wave 4 is most likely to be a flat, combination or triangle. Within all of these types of structures, the first movement subdivides as a three. The least likely structure for primary wave 4 is a zigzag.
Primary wave 4 is likely to end within the price territory of the fourth wave of one lesser degree; intermediate wave (4) has its range from 42.03 to 62.58.
It no longer looks like primary wave 4 can be contained within the channel, so it may overshoot the upper edge.
Primary wave 4 is most likely to be shallow to exhibit alternation in depth with primary wave 2. So far it has passed the 0.382 Fibonacci ratio at 45.52. It may now continue to move mostly sideways in a large range.
Primary wave 4 may not move into primary wave 1 price territory above 74.96.
At this stage, primary wave 4 has completed intermediate wave (A) only. Intermediate wave (B) is incomplete.
WEEKLY ELLIOTT WAVE COUNT
Click chart to enlarge.
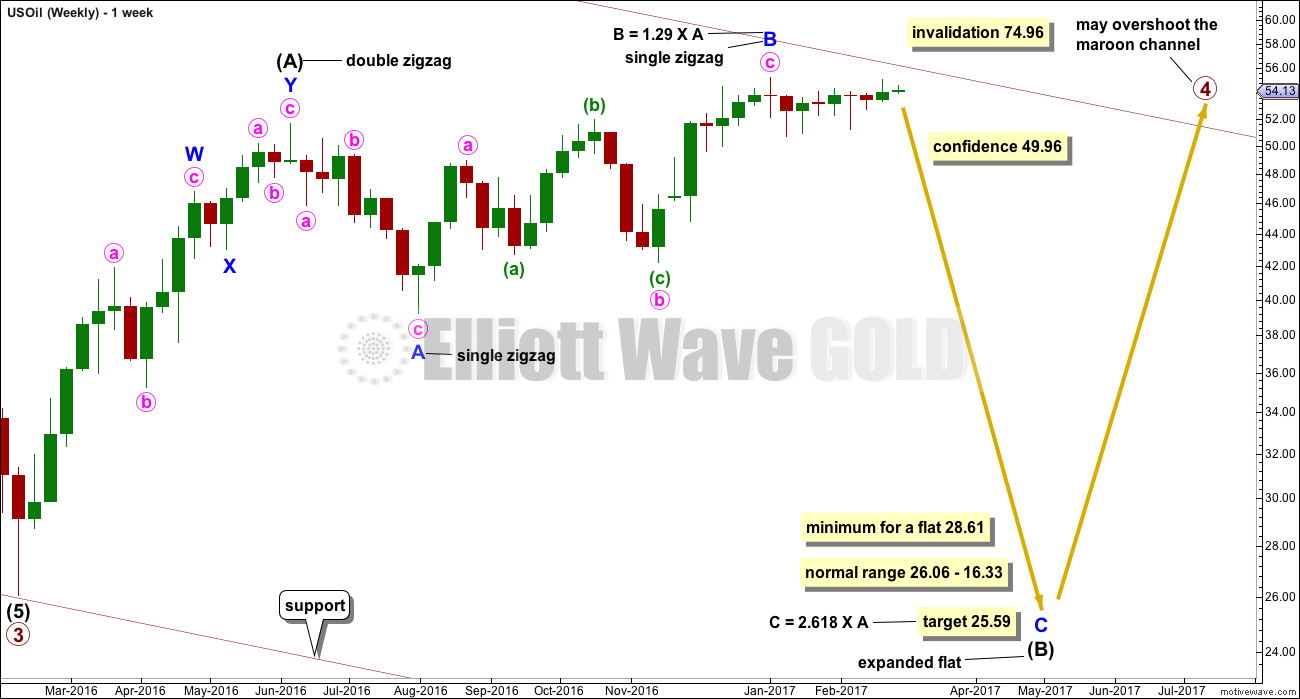
The whole structure of primary wave 4 is seen here in more detail.
The first wave labelled intermediate wave (A) is seen as a double zigzag, which is classified as a three.
Intermediate wave (B) is also a three. This means primary wave 4 is most likely unfolding as a flat correction if my analysis of intermediate wave (A) is correct. Flats are very common structures.
Intermediate wave (B) began with a zigzag downwards. This indicates it too is unfolding most likely as a flat correction.
Within intermediate wave (B), the zigzag upwards for minor wave B is a 1.29 correction of minor wave A. This indicates intermediate wave (B) may be unfolding as an expanded flat, the most common type.
The normal range for intermediate wave (B) within a flat correction for primary wave 4 is from 1 to 1.38 the length of intermediate wave (A) giving a range from 26.06 to 16.33.
Primary wave 4 may not move into primary wave 1 price territory above 74.96.
Within the larger expanded flat correction of primary wave 4, intermediate wave (B) must retrace a minimum 0.9 length of intermediate wave (A) at 28.61 or below.
DAILY ELLIOTT WAVE COUNT
Click chart to enlarge.
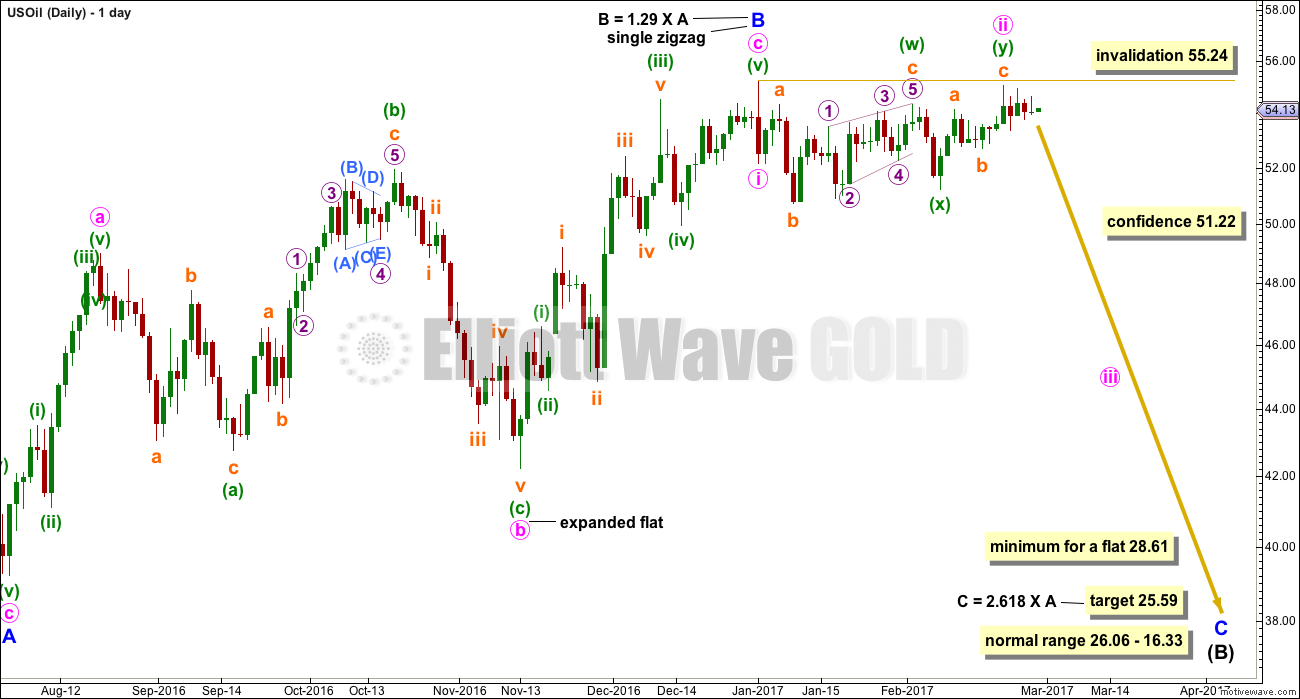
Minor wave B is seen in this main wave count as a complete single zigzag. The upwards wave labelled minute wave a is seen as a five wave impulse.
Minor wave C downwards should have begun. Within minor wave C, minute wave ii may not move beyond the start of minute wave i above 55.24.
Minor wave C downwards must subdivide as a five wave structure.
Minute wave ii may now be a complete expanded flat correction. Minuette wave (c) is labelled as an ending contracting diagonal, the classic pattern equivalent is a rising wedge. These are terminal structures. The fifth wave ends at the i-iii trend line and there is no overshoot. An overshoot would have a better look, but it is not necessary as it is not a rule.
A new low below 51.22 would invalidate the alternate wave count below and provide some confidence in this main wave count.
ALTERNATE DAILY ELLIOTT WAVE COUNT
Click chart to enlarge.
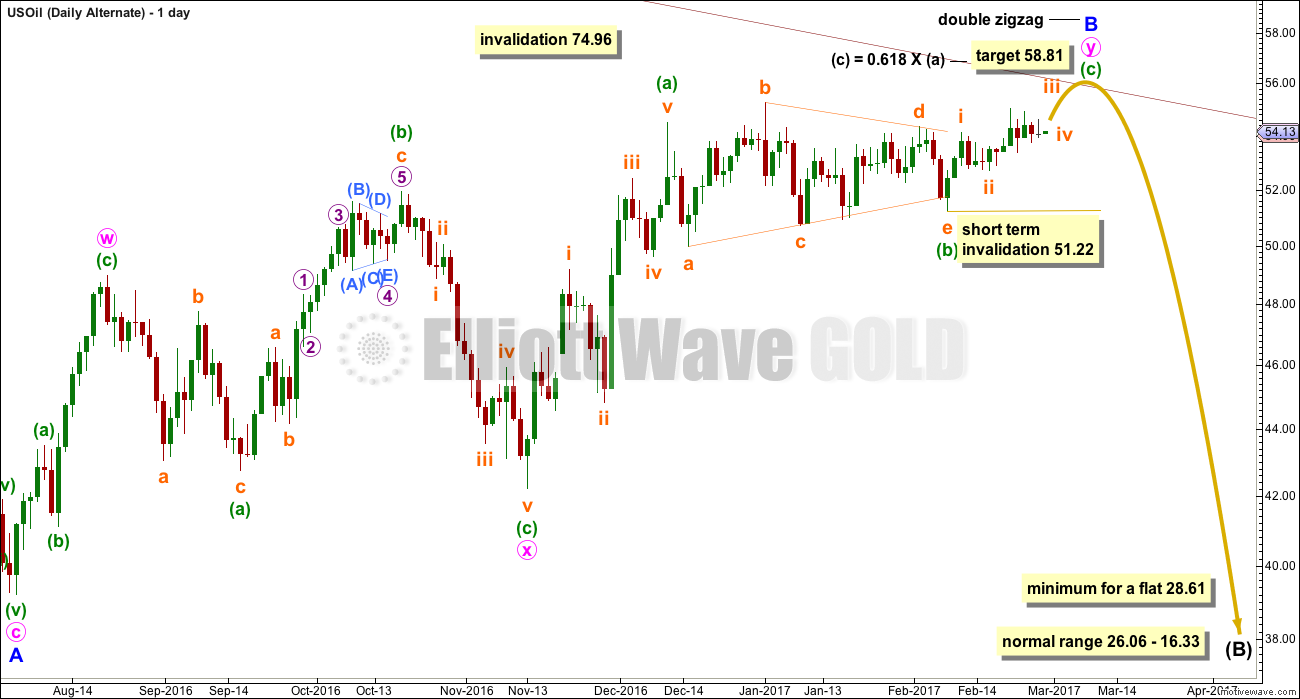
Minor wave B is seen as an incomplete double zigzag. The first wave up labelled minute wave w is seen as a zigzag. This is the main difference between the two wave counts.
Minute wave y must subdivide as a zigzag. Sideways movement over the last few weeks may be a triangle within it for minuette wave (b).
Minuette wave (c) would be very likely to make at least a slight new high above the end of minuette wave (a) at 54.50 to avoid a truncation.
The normal range for minor wave B within the larger flat correction of intermediate wave (B) is from 1 to 1.38 the length of minor wave A, giving a range from 51.67 to 56.41. With the classic technical analysis chart looking fairly bullish, a higher target is calculated. If minuette wave (c) has a more common Fibonacci ratio with minuette wave (a), then minor wave B may be a little longer than the common length.
In the short term, within minuette wave (c), the correction for subminuette wave ii may not move beyond the start of subminuette wave i below 51.22.
ALTERNATE WEEKLY ELLIOTT WAVE COUNT
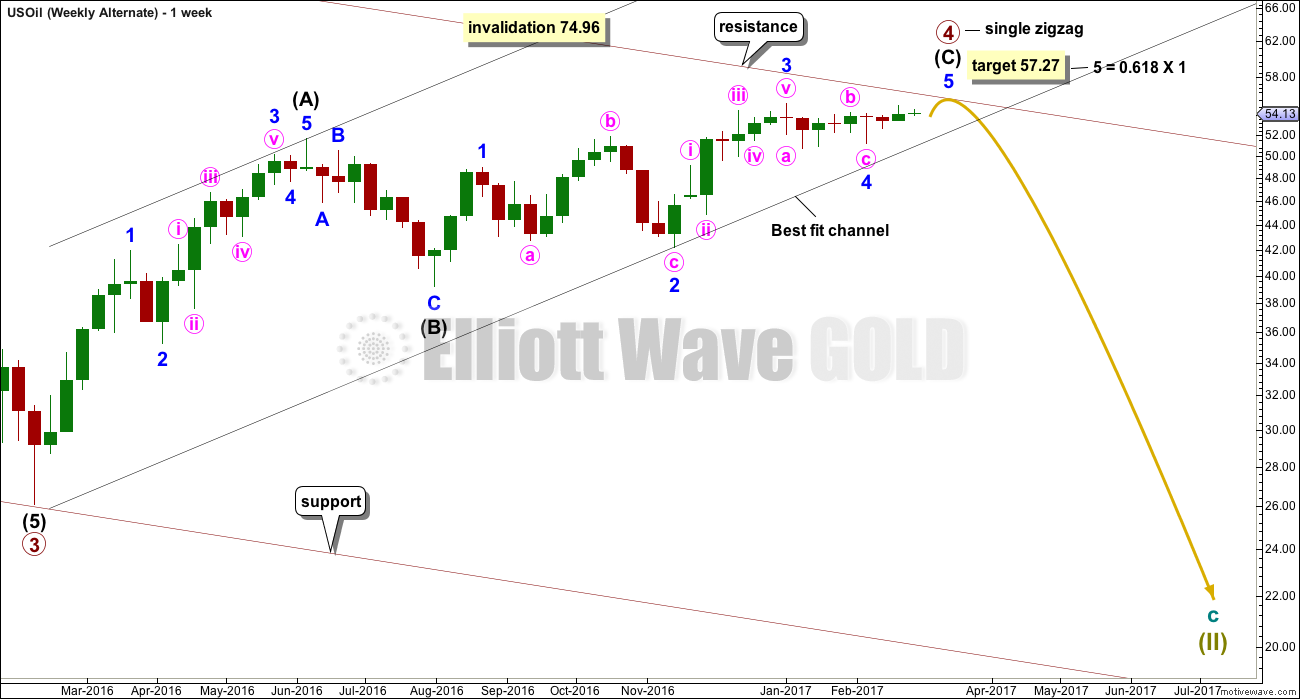
Click chart to enlarge.
This alternate weekly chart is new.
The upper edge of the maroon channel, copied over from the monthly chart, may provide strong resistance. An upwards breakout may be short lived.
Primary wave 4 may be very close to completion. This wave count is an alternate because it sees no alternation between the structures of primary waves 2 and 4; they are both zigzags.
However, there is alternation within the zigzags: intermediate wave (B) was a very time consuming triangle within primary wave 2 zigzag and intermediate wave (B) may have been a brief zigzag within primary wave 4 zigzag. This gives primary waves 2 and 4 overall different looks.
Also, there is alternation in depth: primary wave 2 at 0.93 was very deep and so far primary wave 4 is just 0.34, so it is shallow.
A final fifth wave may be all that is required to complete the structure at primary degree.
TECHNICAL ANALYSIS
DAILY CHART
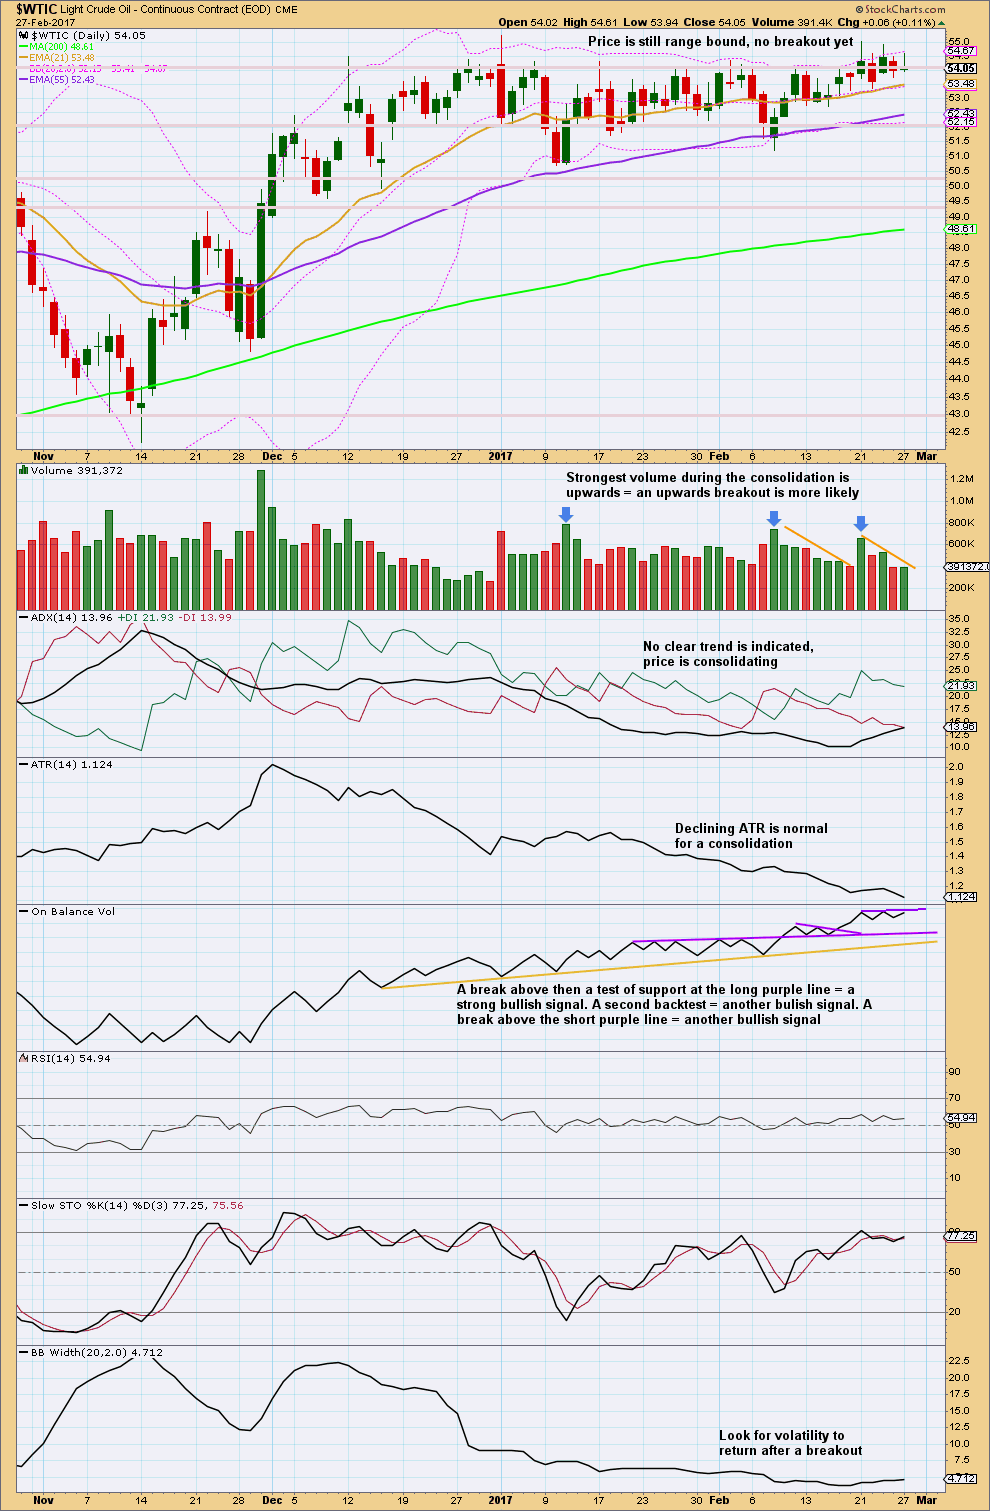
Click chart to enlarge. Chart courtesy of StockCharts.com.
Oil is still range bound. Resistance is about 55.00 to 55.20. Support is about 51.2 to 50.7.
The longer this consolidation continues, the closer and more violent the breakout may be.
A classic breakout is a day that closes comfortably above resistance or below support, preferably with strong volume. Strong volume is more important for a reliable upwards breakout than downwards.
One possible approach to this market at this time may be to open a hedge where stops for each direction may be set just below support and just above resistance. Upon a breakout the losing direction should be automatically closed and the winning position held until the target is met. For the long side (the Elliott wave targets may be too close), a measured rule would add the width of the consolidation to the breakout point, so allow for a movement of about 4 to 4.05 above the breakout point.
Another option which should be taken by less experienced members would be to sit aside and join the trend after price breaks out. Trading consolidating markets is best left to experienced professionals only.
Always remember my two Golden Rules:
1. Always use a stop.
2. Never invest more than 1-5% of equity on any one trade.
VOLATILITY INDEX
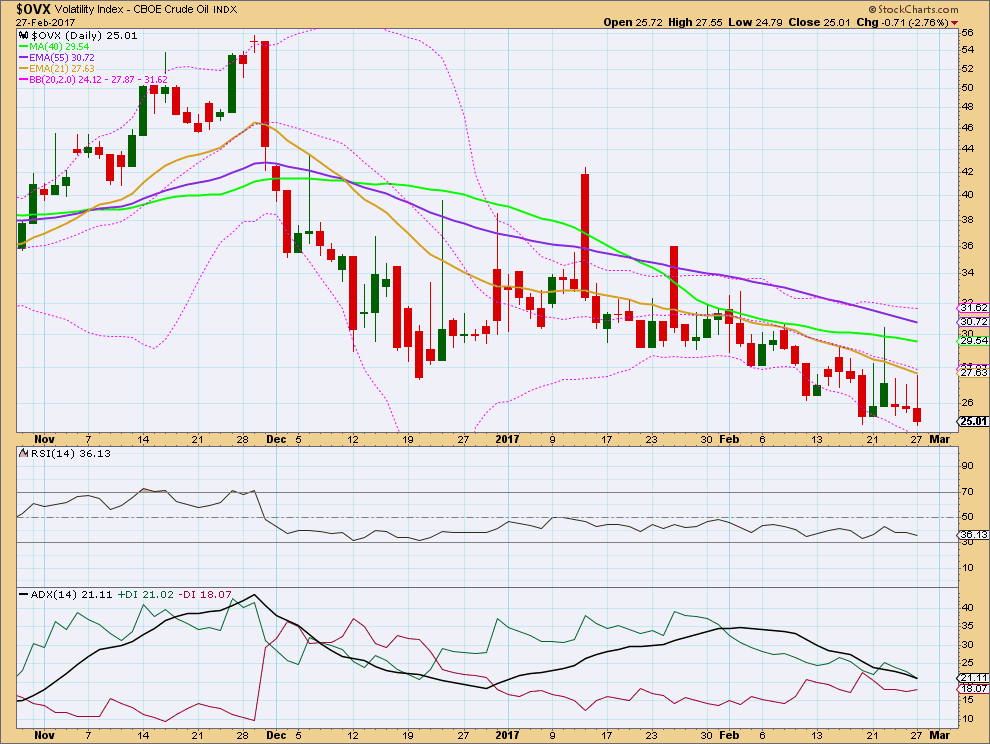
Click chart to enlarge. Chart courtesy of StockCharts.com.
Normally, volatility should decline as price rises and volatility should increase as price falls. Divergence from this normal can provide a bullish or bearish signal for Oil.
Price is moving sideways and volatility is declining. This is also reasonably normal for a consolidation.
This analysis is published @ 09:27 p.m. EST.
Another look at resistance
https://www.kimblechartingsolutions.com/2017/02/crude-oil-dangerous-kiss-resistance-play/
I’m getting some other indications that this could (at long last) be the start of a new downtrend. Just need another day to confirm or otherwise.