
Sideways movement was expected for Friday. An inside day perfectly fits expectations.
Summary: A small fourth wave correction may now continue sideways over another one to few days and should remain above 1,211.06. When the correction is complete, then a target for the fifth wave up may be calculated; it may be about 35.48 in length.
If price moves below 1,211.06, then at that stage all long positions should be exited and expect more downwards movement to about 1,175.
New updates to this analysis are in bold.
Last weekly charts are here and the last video on weekly wave counts is here.
Grand SuperCycle analysis is here.
MAIN ELLIOTT WAVE COUNT
DAILY CHART
Click chart to enlarge.
This daily chart will suffice for both weekly charts.
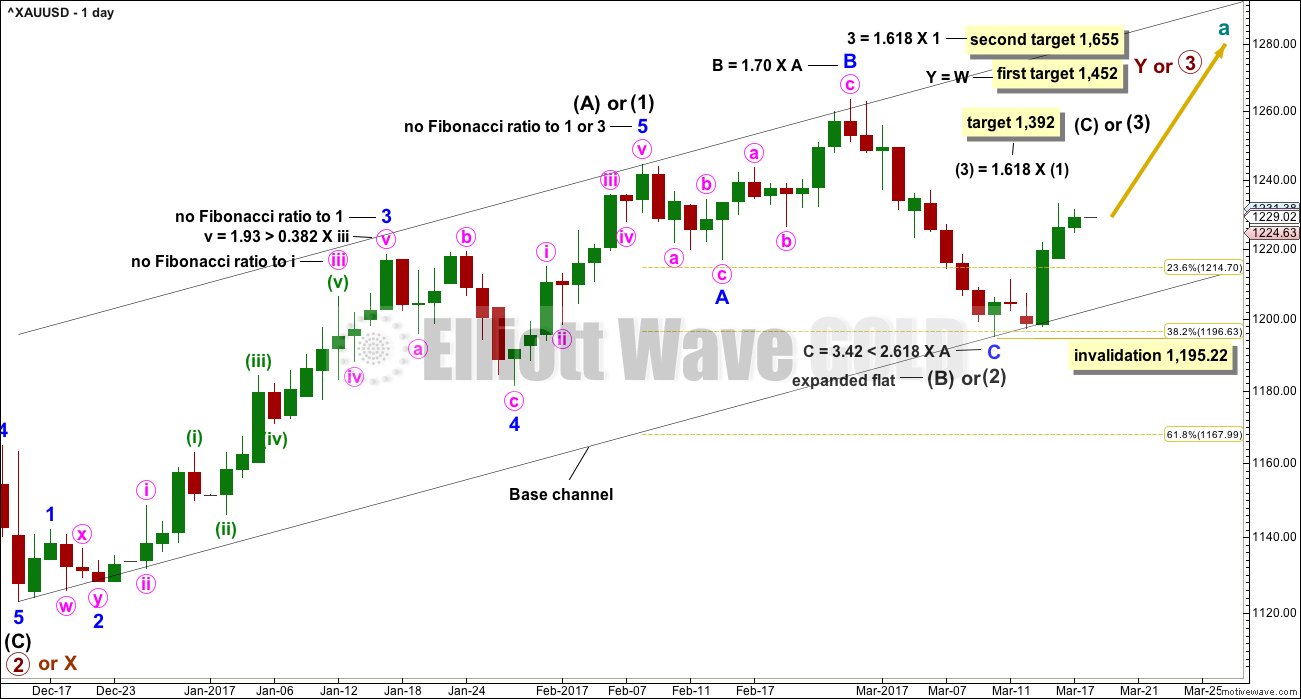
Upwards movement is either a third wave (first weekly chart) to unfold as an impulse, or a Y wave (second weekly chart) to unfold as a zigzag. If upwards movement is a zigzag for primary wave Y, then it would be labelled intermediate waves (A) – (B) and now (C) to unfold.
Intermediate wave (1) or (A) is a complete five wave impulse lasting 39 days. Intermediate wave (2) or (B) so far looks like an expanded flat, which is a very common structure.
Minor wave C may now be a complete five wave structure with a Fibonacci ratio to minor wave A. Intermediate wave (2) or (B) may have ended very close to the 0.382 Fibonacci ratio of intermediate wave (1) or (A).
If intermediate wave (2) is over, then it would have lasted 22 sessions; this may be considered close enough to a Fibonacci 21 to exhibit a Fibonacci duration.
Intermediate wave (2) may not move beyond the start of intermediate wave (1) below 1,123.08.
If this wave count is correct, then at its end minor wave C will provide a very good opportunity to join the longer term upwards trend.
So far, within intermediate wave (3) or (C), the first wave up for minor wave 1 may be close to completion. When it is complete, then minor wave 2 may unfold lower. Minor wave 2 may not be a very deep correction because the strong upwards pull of a big third wave may force it to be more shallow than otherwise. However, if it is relatively deep, it may find support at the lower edge of the base channel and may offer another opportunity to join the upwards trend.
HOURLY CHART
Click chart to enlarge.
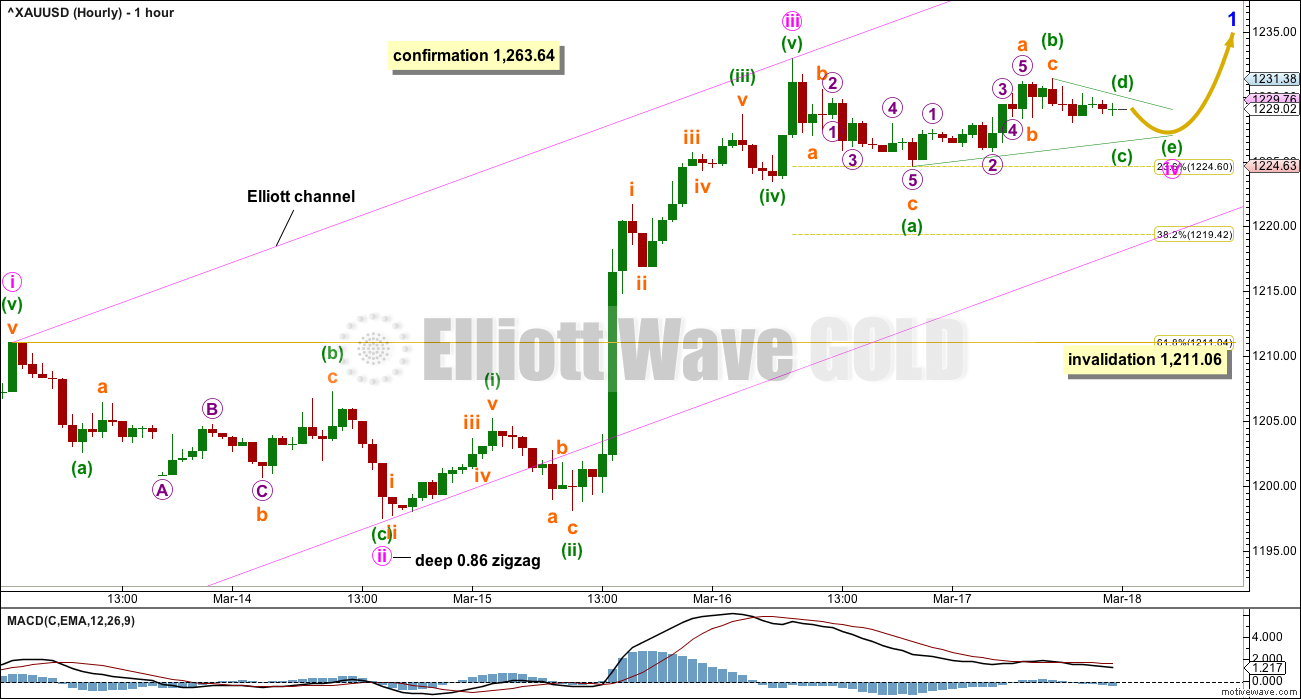
Minor wave 1 would be unfolding as an impulse. Within minor wave 1, the middle for minute wave iii now looks complete but does not exhibit a Fibonacci ratio to minute wave i, so it is more likely that minute wave v will exhibit a Fibonacci ratio to either of minute waves i or iii.
In this case, because minute wave i is relatively short, minute wave v may be a longer extension; this is common for Gold. Minute wave v may be about equal in length with minute wave iii if it is 35.48. It may also be equal in length with minute wave i at 15.84. When minute wave iv is complete, then a target can be calculated for minute wave v.
Minute wave iv would exhibit alternation in depth and structure to minute wave ii if it is shallow and either a flat, combination or triangle. Within these possibilities, an expanded flat or running triangle or combination may include a new high above the start of minute wave iv at 1,232.97. At this stage, a new high may be part of minute wave iv and not necessarily minute wave v.
Minute wave iv is labelled as a possible triangle today but may morph into a different type of correction over the next one to few days, so as it unfolds the labelling within it will probably change. The focus is on whether or not it may be complete and not trying to predict exactly how it will unfold because there is too much variation possible within corrections.
With MACD flattening off and price moving sideways within a small range, it does look like a triangle may be unfolding at this stage. If the triangle remains valid, and if it completes, then the expectation for the following fifth wave up of minute wave v will be substantially changed. Gold often exhibits surprisingly short and brief fifth waves out of its fourth wave triangles. The expectation would be then for minute wave v to move only slightly above the end of minute wave iii at 1,232.97 to avoid a truncation, and to be over possibly within one session.
My focus on Monday and Tuesday for you will be to identify whether a triangle may be completing for minute wave iv.
Minute wave ii lasted two sessions and shows on the daily chart as two red daily candlesticks. If minute wave iv also shows on the daily chart as at least one daily candlestick, then it would give the wave count the right look at the daily chart level.
At this stage, the most likely point for minute wave iv to end may be the 0.236 Fibonacci ratio of minute wave iii at 1,224.60 as this price point is within the fourth wave of one lesser degree. This target expects sideways movement and not any substantial lower movement for another one to few days.
ALTERNATE ELLIOTT WAVE COUNT
DAILY CHART
Click chart to enlarge.
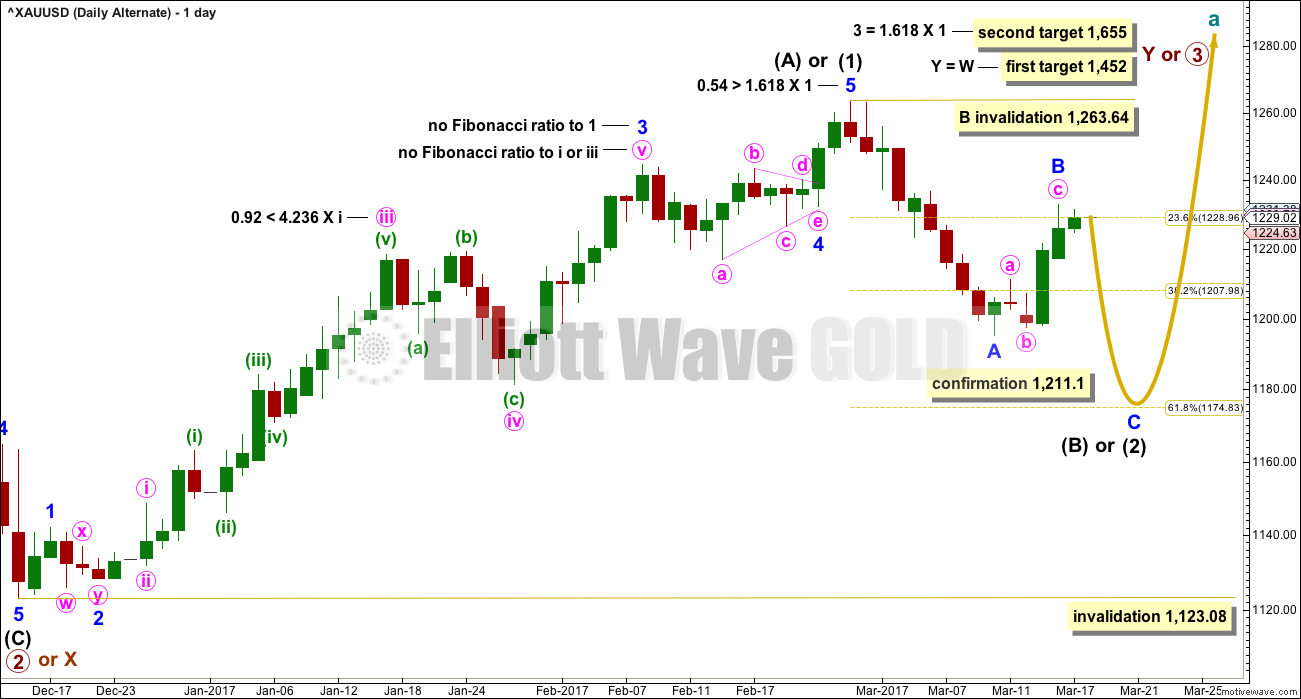
This alternate wave count is new in response to queries from members.
Fibonacci ratios and channels are noted on both daily charts, so that members may compare the main and alternate wave counts. This alternate wave count has slightly better Fibonacci ratios. This gives this wave count a reasonable probability. Due mostly to volume, this wave count is judged today to have a lower probability than the main wave count.
At this stage, this wave count would be considered confirmed if price makes a new low below 1,211.10. At that stage, the target for intermediate wave (2) or (B) to end would be the 0.618 Fibonacci ratio of intermediate wave (1) or (A) at 1,175.
At the hourly chart level, the structure of minor wave B would be exactly the same as the main wave count because a-b-c for a zigzag subdivides 5-3-5 exactly the same as 1-2-3 for an impulse.
How low the current small correction goes should tell us which wave count is correct.
TECHNICAL ANALYSIS
WEEKLY CHART
Click chart to enlarge. Chart courtesy of StockCharts.com.
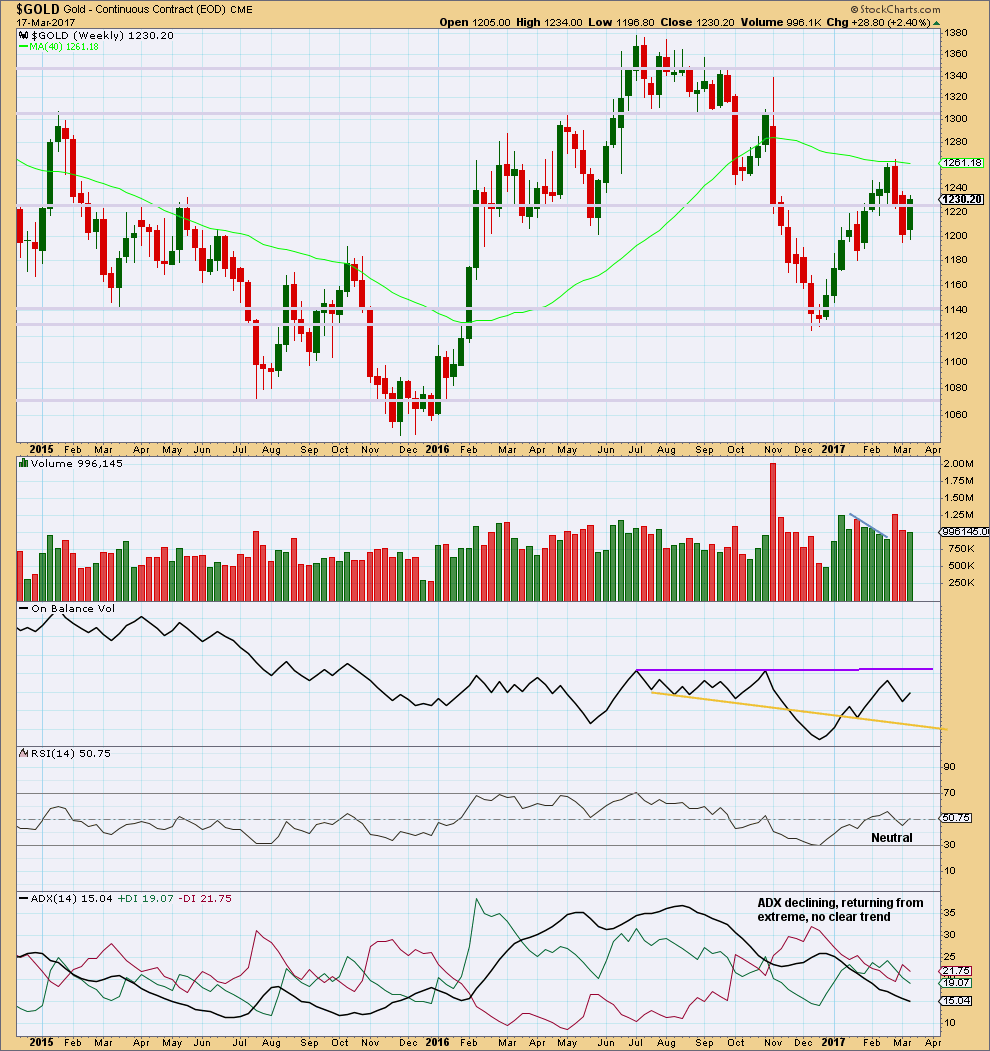
This week completes an inside week with slightly lighter volume than last week. While last week saw falling price on declining volume, which pointed to an end to downwards movement, this week looks more like a correction within a downwards trend than a new upwards trend.
On Balance Volume has some distance to go before it would reach either resistance or support, so it is not giving any signal at this stage.
DAILY CHART
Click chart to enlarge. Chart courtesy of StockCharts.com.
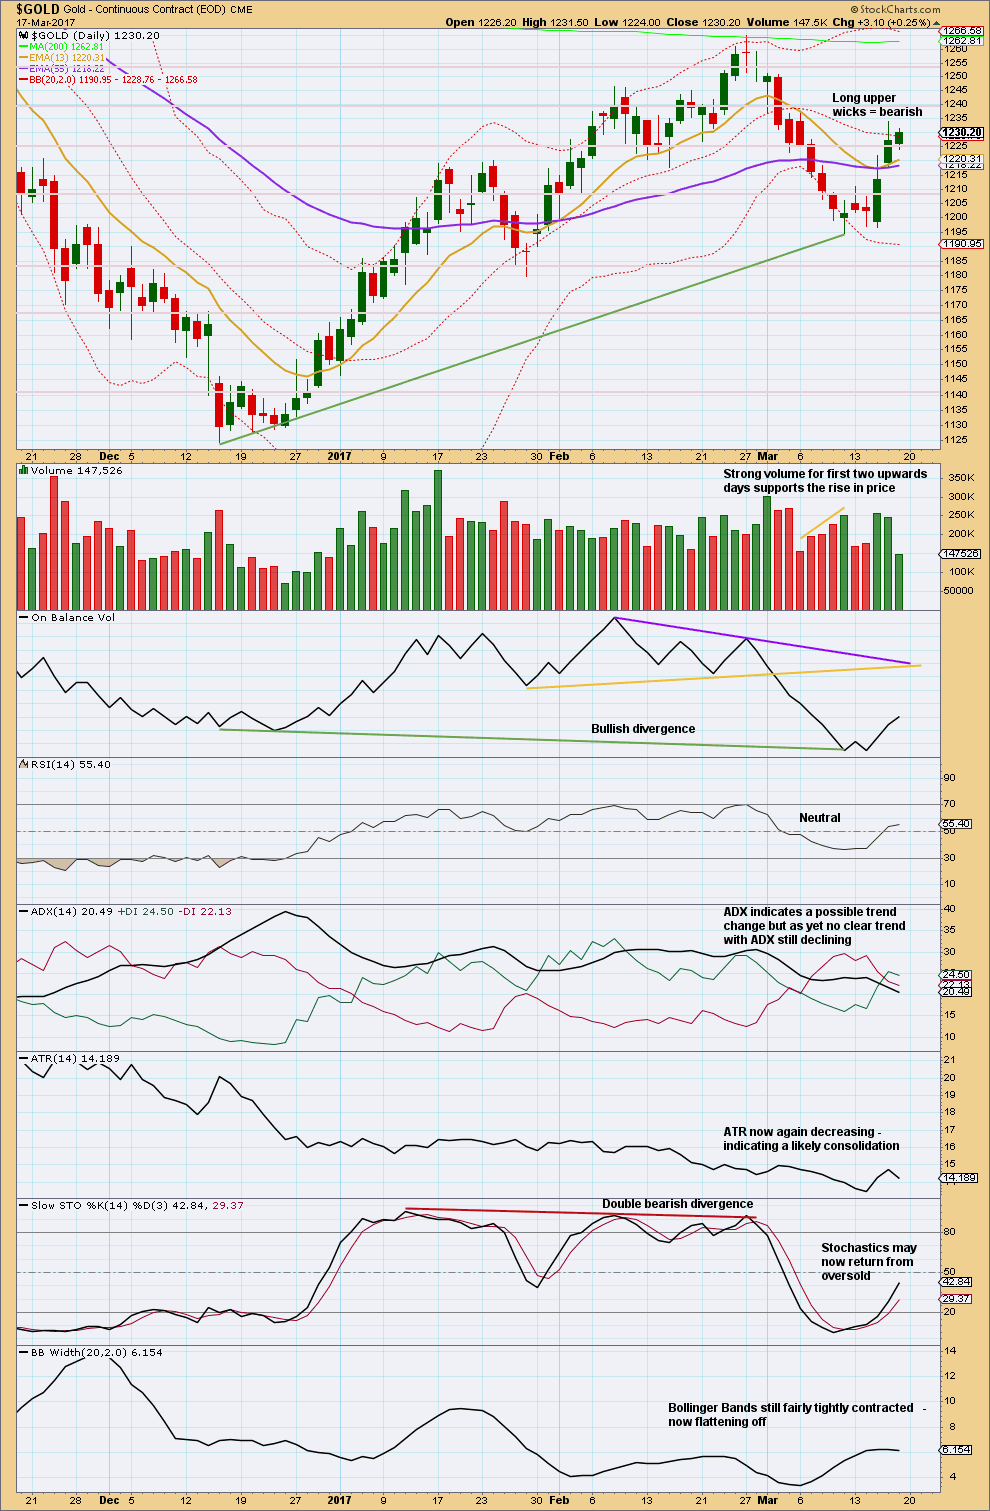
This data from StockCharts is still substantially different from BarChart data. The close for the 15th of March on StockCharts data is at 1,213.60. The close for the 15th of March for BarChart data is at 1,219.44.
The close for the 16th of March is almost the same between StockCharts and BarChart, so this looks reliable.
If data for the 15th of March is correct from StockCharts (and I do not think it is), then the long upper wicks on the two green daily candlesticks are bearish.
Strong volume for the first two days of upwards movement offered some support to the rise in price. This supports the main wave count over the alternate. The alternate expects this was a B wave; B waves should exhibit weakness and not strength.
A large decline in volume for the small inside day of Friday also supports the main Elliott wave count over the alternate. This looks like a small consolidation and not the start of a C wave downwards.
GDX
DAILY CHART
Click chart to enlarge. Chart courtesy of StockCharts.com.
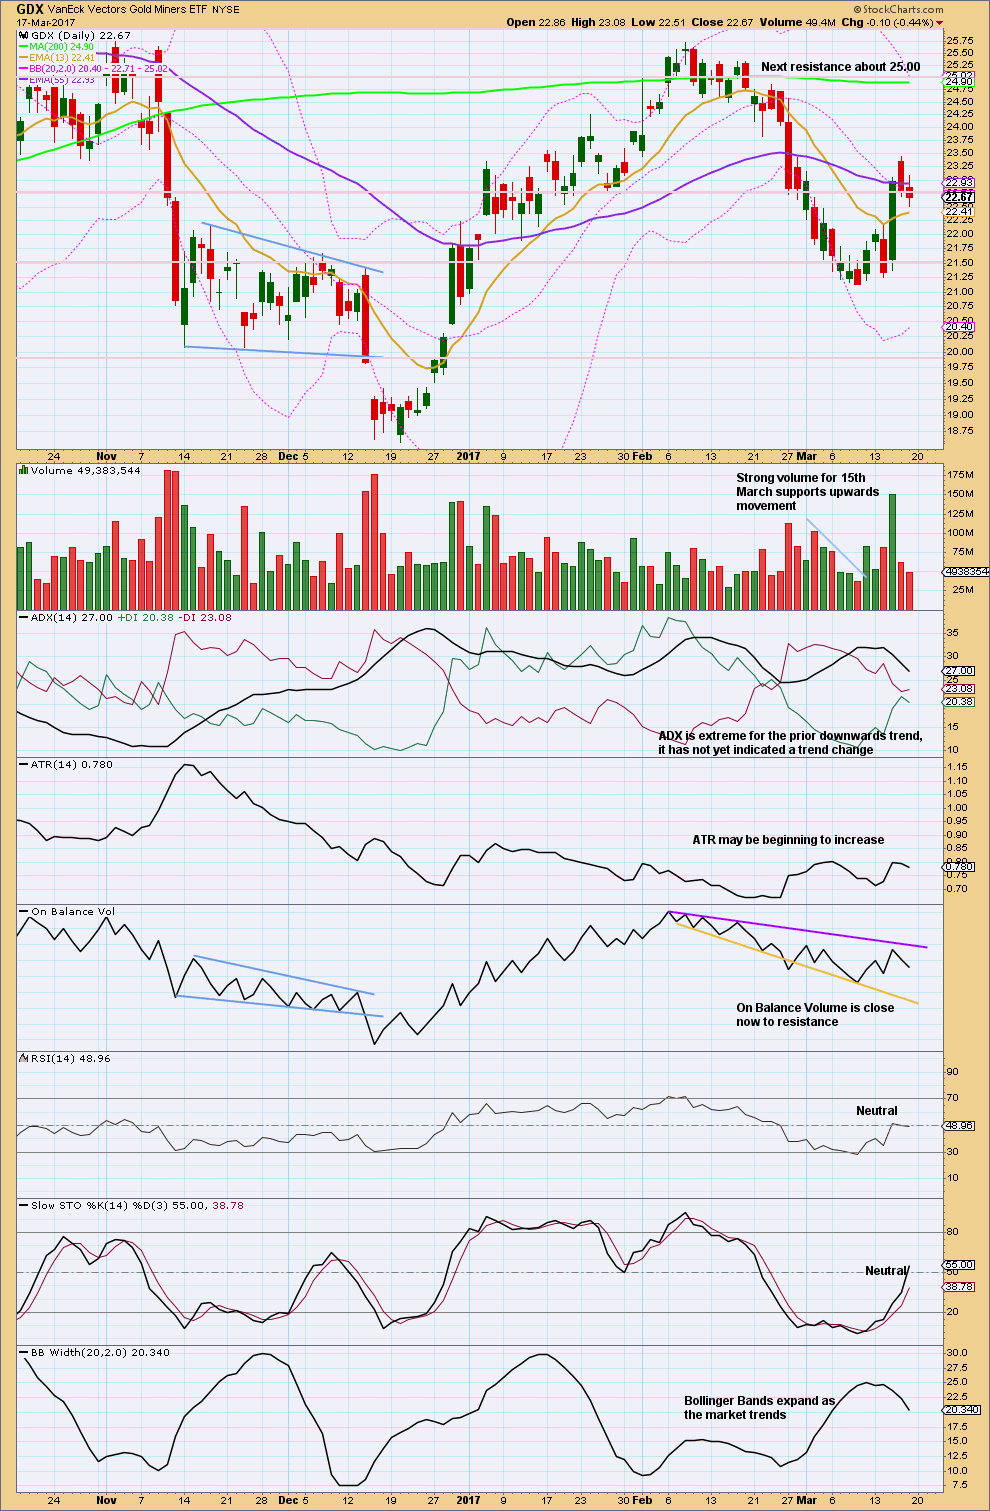
Lighter volume for downwards movement Thursday and Friday, with a decline for Friday, supports the idea that this is a pullback within a new upwards trend.
The only concern with this idea still is contracting Bollinger Bands as price moved higher.
Overall, it still looks more likely that GDX is within a new upwards trend.
This analysis is published @ 08:03 p.m. EST on 18th March, 2017.
Hi Lara,
Thank you for today’s updates. When you update the Trading Room w/charts, I would appreciate seeing a Count on Copper and the Dollar which I have positions in. I am:
Short Copper…thinking a bit too early unless it turns down very soon ( there is a small Bear engulfing candle today…but could just mean sideways)?
Perhaps it wants to go Up for awhile before making a larger move Down?
One count I’ve noted is a large triangle forming, then a move up, before coming down again. This could take a while to develop.)
Long US Dollar – concerned that Dly trendline is broken/Wkly- pretty much broken unless a reversal. ( We do have 2 wicked green candles as of EOD today… looking rather indecisive. Support @ 99.23ish….minute iv and medium term trendline supporting a H&S pattern forming since early October.) ?
Thanks very much….
This could still be an expanded flat. Or it could still morph into a larger triangle or combination.
It’s still not possible to tell what structure minute iv may be, labelling within it as it unfolds will still probably change again.
If it’s going to stay within the pink channel then it may be a triangle yet. If that happens then the strong warning about a potentially quick and very short fifth wave to follow will be again made.
For now, the focus is still on whether or not minute iv could be complete.
There is a slim outside possibility that it could be complete as a quick shallow zigzag over at the low labelled minuette wave (a), but it would have little alternation with minute wave ii, and the proportion wouldn’t be good giving the wave count the wrong look.
So it looks more likely that it’s still not over.
Within flats the common length for B waves is from 1 to 1.38 X wave a. Here minuette wave (b) is within this common range.
Dreamer,
Just a quick note to thank you for responding to my comment on Mar 15 about 3X etfs, JNUG/JDST. Sounds like you have some of the same challenges I do in process of trying to get it right. The biggest problem is, like futures, the profits disappear in front of your eyes if one does not execute quickly. Also if one holds overnight, price can be very volatile. Must be those algorithm machines Verne refers to!
I’d like to have more time to comment on this site, but due to family responsibilities, I have all I can do to reach the computer.
I saw that expanded flat forming @ 1:30ish this morn EST. Taking its sweet time!
Have a good one…
No worries. Post when you have time.
Never pay market price for the leveraged animals. Open a bid 5-10% below the current once you are confident of the trend and wait for an intra-day fill on any pullback. They are so volatile you generally will have no problem getting filled. Works like a charm if you are patient! 🙂
You may have to be a bit more generous if you are buying the actual shares instead of options.
The triangle doesn’t look right. I could label it as over, but the trend lines converge too quickly and it would have ended right where the trend lines cross over. That doesn’t breach any EW rules, it just doesn’t look right.
So the warnings about a very short fifth wave no longer apply.
It looks like an expanded flat is unfolding. If B is over then it would now be 1.24 X A. It could move higher still.
Two charts are always better than one. 👍😀
Thank you lara and dreamer😊
Roopa may have it correct that Minute 4 has morphed into an expanded flat and Syed may have the final target for Minor wave 1 correct.
Time will tell…
https://www.tradingview.com/x/r6wddYER/
Yaa thats what its looking like..expanded flat than the target may be around 1260 for minor 1. It will be intresting to watch were this wave 4 will end
Nice Dreamer. I had just prepared a chart with exactly that. I’ll publish mine above, it doesn’t differ from yours, there’s only a little more detail.
What is this movement in gold can be said as?
Is it making an expanded flat correction..?
Or
At the low of friday wave 4 has been completed and we are in wave 5..?
Hi. Cant say about the wave count but imo with 1225-23 holding, expecting on weekly outlook basis an upside move for topping targeting 1241-1251+ range. Have a fine day & good luck!
FWIW, Tim ‘Cyclesman’ Wood is forecasting an intermediate term low within the timing band 7th April – 26th May i.e. the alternate daily wave count. The alternate also seems to correlate with the main wave counts for USD index and USD/JPY as per the trading room. I know that we cannot always assume inverse correlation between Gold and USD but it is there more often than not imvho.
Please keep this chart within this community.
USD has several bearish indications. Divergences with RSI,MACD and Stox. Such obvious divergence has materialized in past.
Wolf wave is a reliable pattern and signals turn most of the time. I am sure Lara can find a matching EW wave count for such wave pattern.
Plus 16 year cycle bottom; 1992,2008 and expecting next one in 2026 where the 5th wave of a bullish Wolfwave will terminate.
http://www.investopedia.com/terms/w/wolfewave.asp
USD Chart!!!
please … is JDST work with GDX or GDXJ ? Thanks
JDST and JNUG are based on GDXJ.
http://www.direxioninvestments.com/products/direxion-daily-junior-gold-miners-bull-3x-etf
Make sure you fully understand the leveraged ETF’s before trading them as they can be dangerous and fantastic. You need to make sure you are on the right side of the trade… Good luck!
The US dollar index has reached a critical support area. If it continues to fall below support then that would support Lara’s medium term prognosis on gold and silver and should mean the rest if dollar pairs continue to rise. However if it turns up from here that would question gold and silver’s rise from here.
GDXJ has behaved like a bucking bronco the last week. Strong up then down, repeat. I usually don’t keep an EW count for GDXJ, but wanted to make some sense out of the recent move off the low.
With all of the overlap, it appears that an expanding leading diagonal is in play. Alternately, it could be three 1-2’s or a bearish corrective wave, but I think those are less likely.
So if GDX is expected to make a new high early next week, will GDXJ make a new high? I don’t think so. It appears that a deep wave 2 correction may already be in play. GDXJ may get a strong bounce when GDX makes a new high, but won’t likely make a new high.
The wave 2 correction for GDXJ will likely be deeper than the wave 2 correction for GDX. These ideas seem to align with Gold, so let’s see how this plays out next week.
https://www.tradingview.com/x/2sCRrdOE/
GDX continued to consolidate on low volume. The channel appears to be breached, but sometimes 4th waves do that. Expecting a new high in the next couple of days.
https://www.tradingview.com/x/ufpwcs8w/