
All three hourly Elliott wave charts yesterday expected some downwards movement to at least 1,240. Thereafter, the main wave count expected a resumption of upwards movement.
The low for the session was 1,237.18 and then from there price bounced to close green.
Summary: The main and alternate wave counts are still judged to be about even in probability today. The classic technical analysis picture is bearish with the exception of a long lower wick on today’s candlestick, which is very bullish.
A new high above 1,262.95 would add confidence to the main / bullish wave count. If that happens, expect upwards momentum to increase. The target is at 1,296.
A new low below 1,226.53 would add confidence to the alternate / bearish wave count. If that happens, expect downwards momentum to show some increase. The target is at 1,197 – 1,192.
New updates to this analysis are in bold.
Last monthly and weekly charts are here. Last historic analysis video is here.
Grand SuperCycle analysis is here.
MAIN ELLIOTT WAVE COUNT
DAILY CHART
Click chart to enlarge.
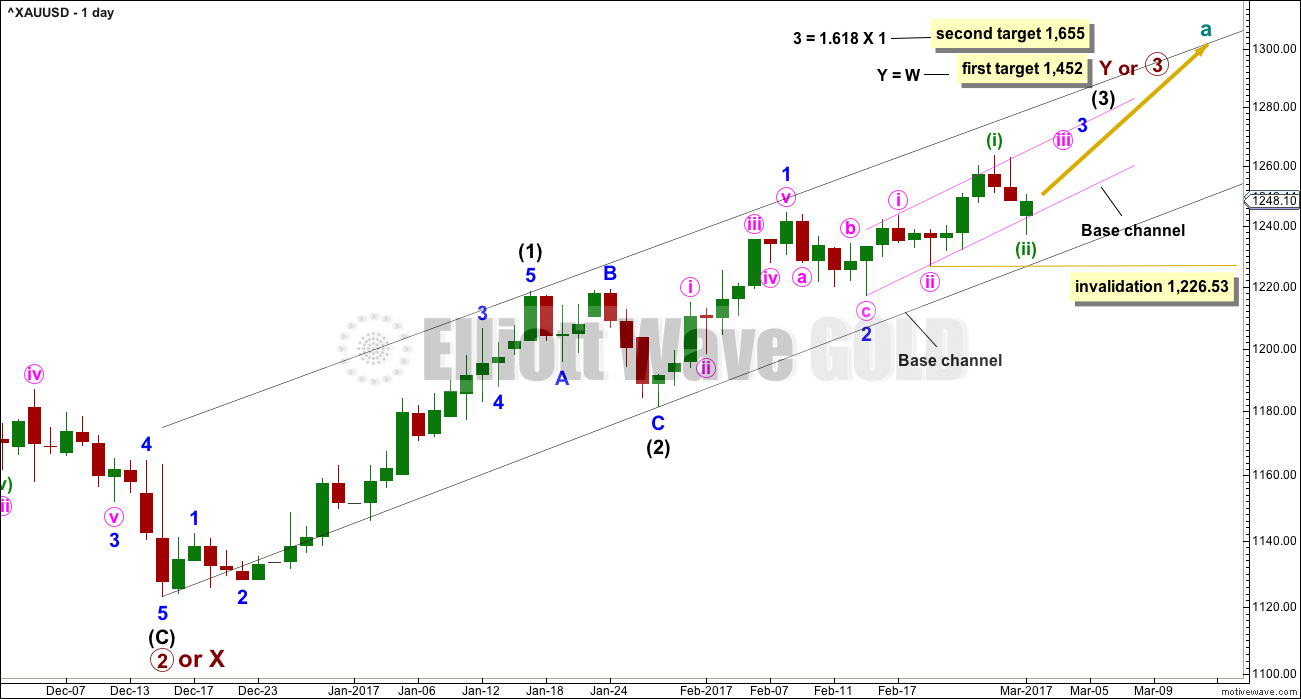
A third wave up now at least at three degrees at the daily chart level may now begin.
Within minor wave 3, no second wave correction may move beyond the start of its first wave below 1,226.53.
Corrections should now begin to be more brief and shallow along the way up for this wave count. Upwards movement should have support from volume and show an increase in momentum.
It is my judgement today that this wave count is close to 50% likely.
HOURLY CHART
Click chart to enlarge.
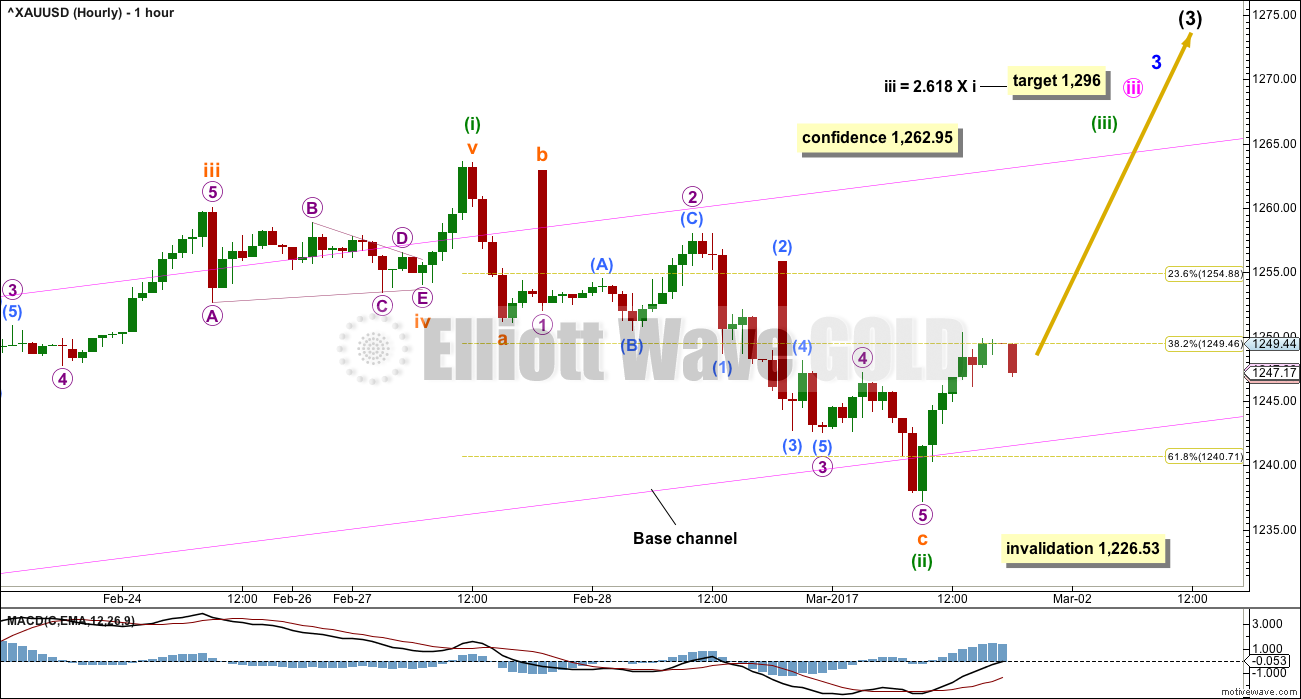
Downwards movement labelled minuette wave (ii) fits as a zigzag, subdividing 5-3-5.
The base channel has been overshot but not breached. Minuette wave (ii) is a very deep correction.
If the base channel is breached by downwards movement, then the probability of this main wave count would reduce substantially, to below 50%, and the alternate would be favoured. A new low below 1,226.53 would see this main wave count invalidated and discarded.
This wave count now expects to see an increase in upwards momentum.
ALTERNATE ELLIOTT WAVE COUNT
DAILY CHART
Click chart to enlarge.
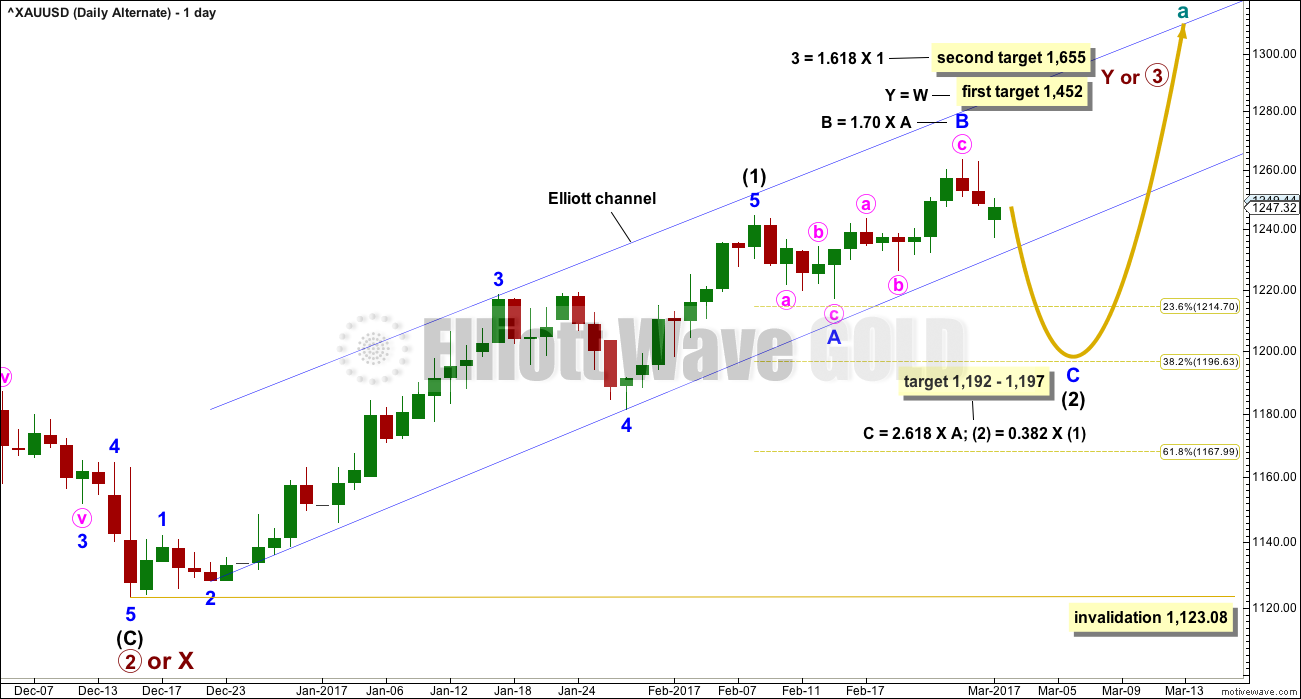
This alternate wave count expects that the breakout may be false. Sometimes this happens, so this wave count would provide a road map for what may happen next.
Intermediate wave (1) may have been over later. The structure within it still looks adequate.
Intermediate wave (2) may be an incomplete expanded flat correction, and so far within it minor wave B would be a 1.70 length of minor wave A, now outside the normal range of 1 to 1.38.
If minor wave B is over here, then the appropriate Fibonacci ratio for minor wave C would be 2.618 the length of minor wave A. If minor wave B continues higher, then this target must also move correspondingly higher.
Intermediate wave (2) may not move beyond the start of intermediate wave (1) below 1,123.08.
It is my judgement today that this alternate wave count has about 50% probability.
HOURLY CHART
Click chart to enlarge.
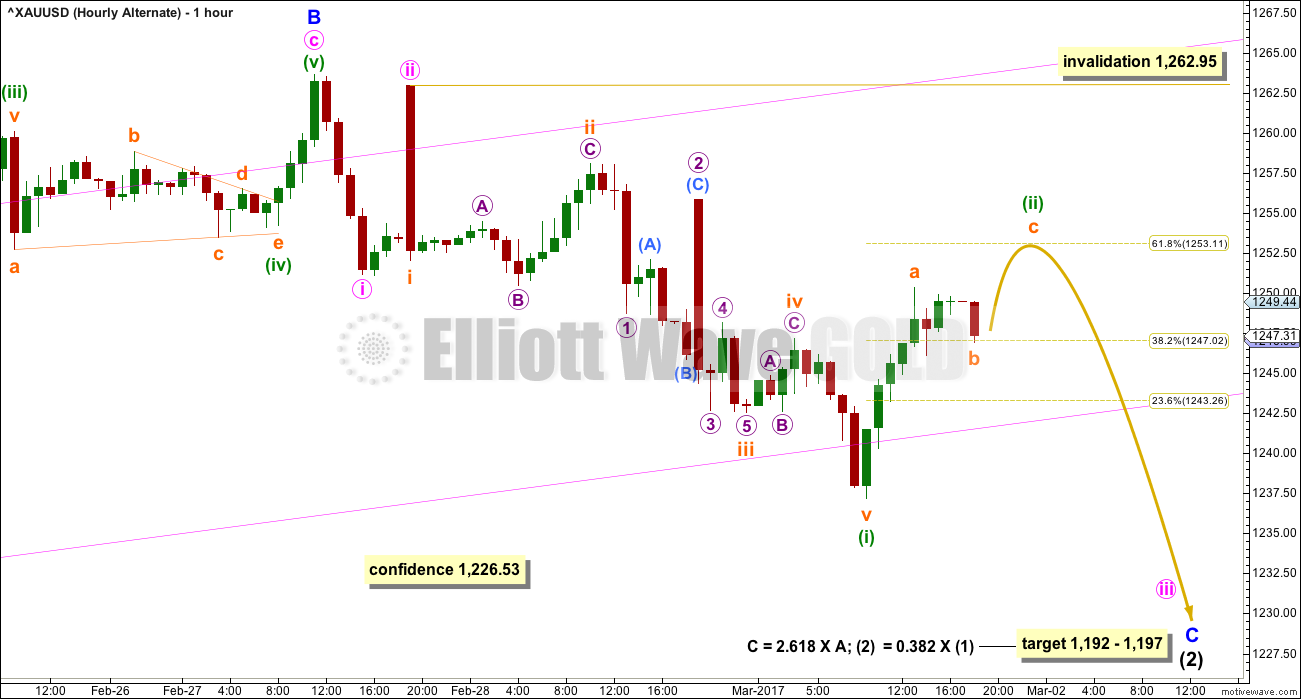
Downwards movement fits as the start of an impulse with two first waves and a second wave. The subdivisions are 5-3-5, exactly the same as a zigzag.
Minuette wave (ii) may end about the 0.618 Fibonacci ratio of minuette wave (i). Thereafter, this alternate wave count would expect a third wave down at two low degrees.
Minuette wave (ii) may not move beyond the start of minuette wave (i) above 1,262.95.
TECHNICAL ANALYSIS
WEEKLY CHART
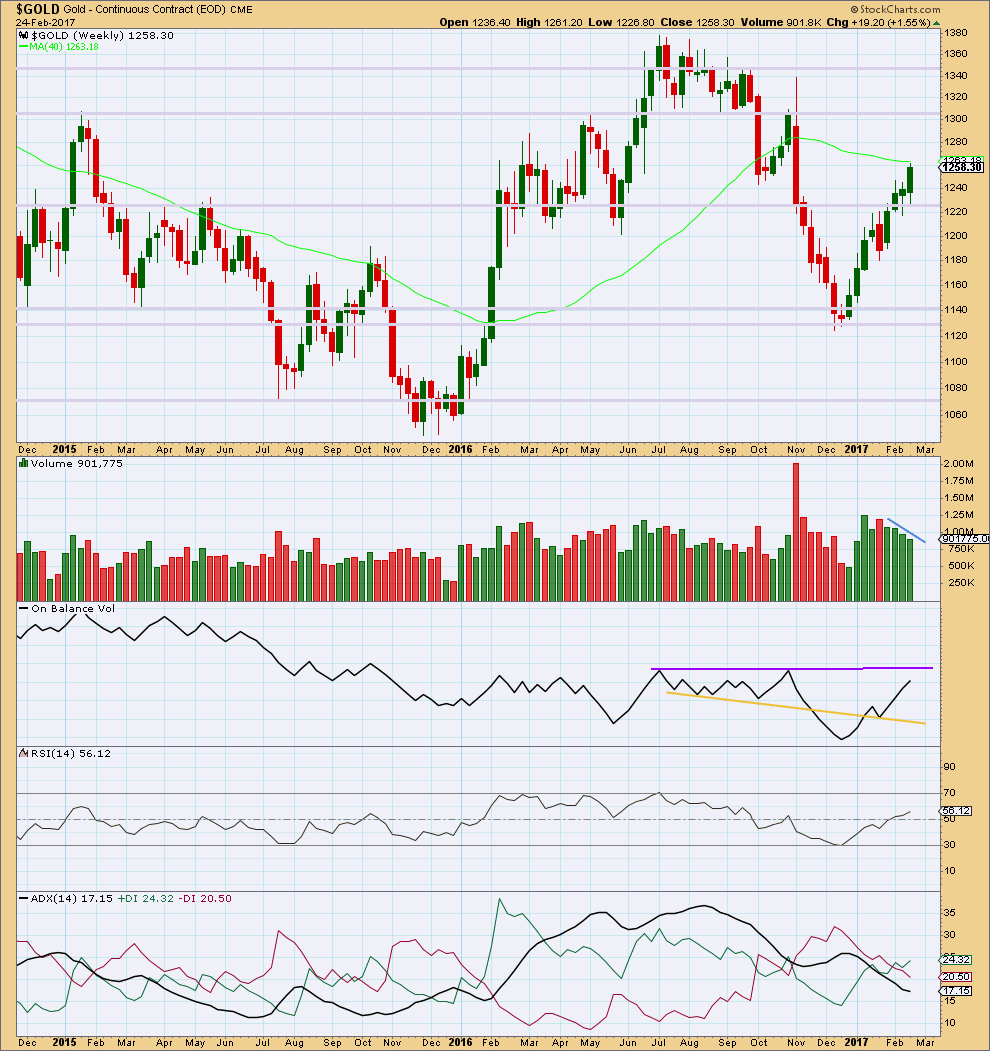
Click chart to enlarge. Chart courtesy of StockCharts.com.
The last four weekly candlesticks are all green and all show a constant decline in volume. At the weekly chart level, this supports the alternate wave count but is very concerning for the main wave count. A third wave up at multiple degrees should have good support from volume.
On Balance Volume is nearing resistance, but it is not there yet.
RSI is not overbought. There is room for price to rise further.
ADX indicates a possible trend change from down to up, but does not yet indicate there is an upwards trend.
DAILY CHART
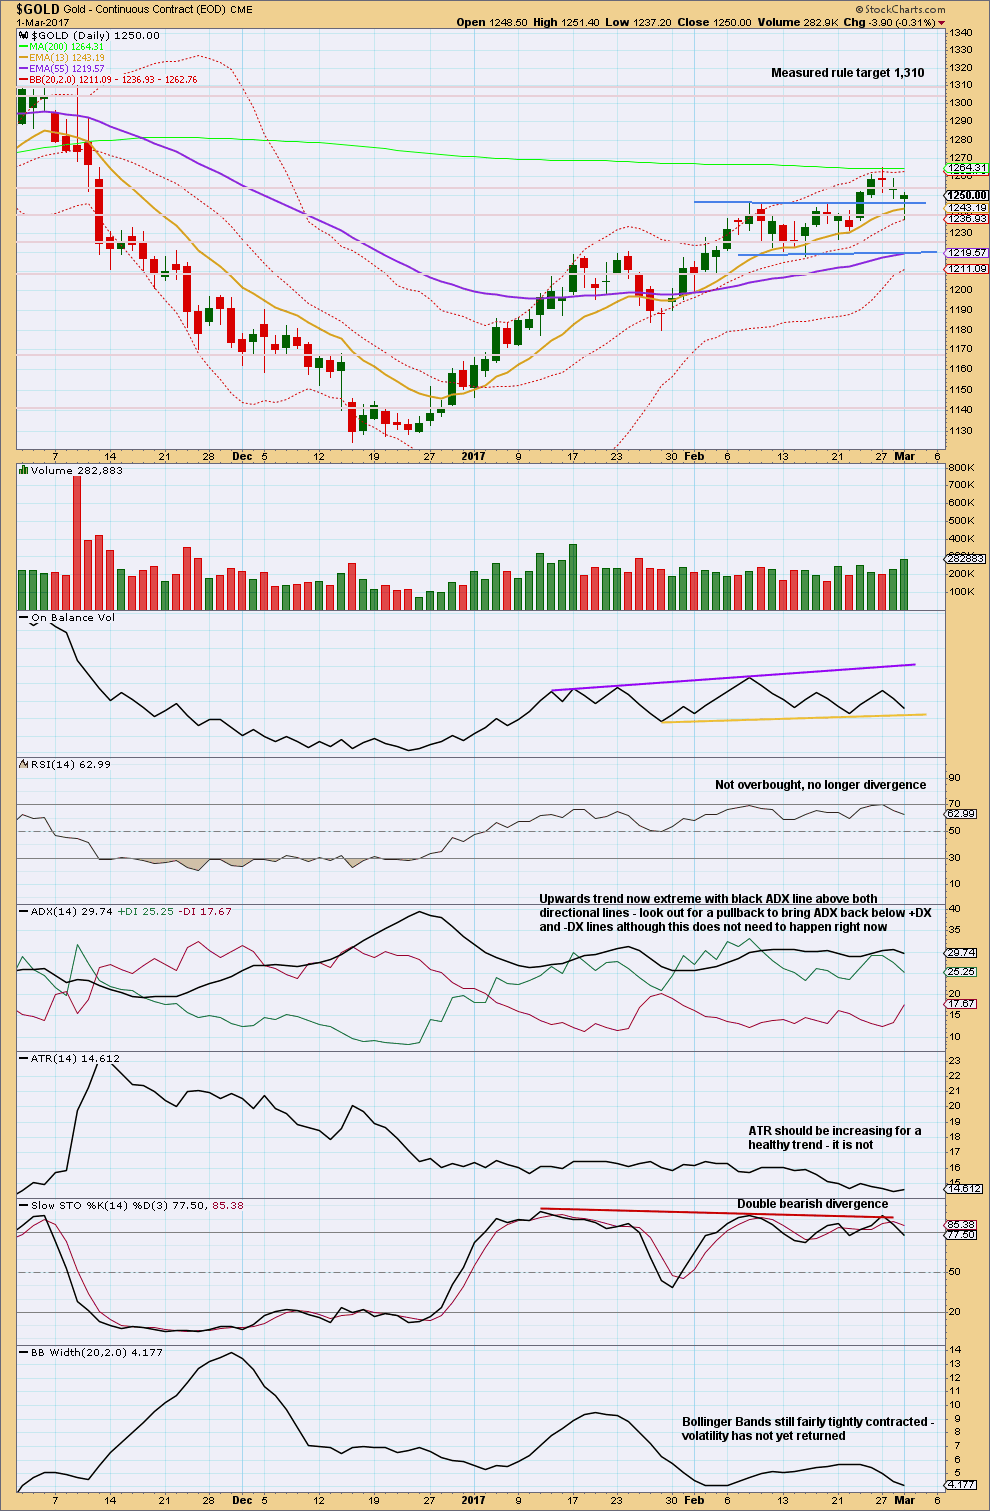
Click chart to enlarge. Chart courtesy of StockCharts.com.
The long lower wick on today’s candlestick is very bullish. The day completes a lower low and lower high, so despite closing green this is a downwards day. The balance of volume was down and it shows an increase; the fall in price had support from volume and this is bearish.
On Balance Volume is close to support.
The prior upwards trend was extreme and this does not support the main wave count, which requires substantial more upwards movement.
ATR is bearish.
Divergence with Stochastics is bearish.
Bollinger Bands do not support the main wave count.
Overall, the picture is bearish. The sole exception is the long lower wick on today’s candlestick.
GDX
DAILY CHART
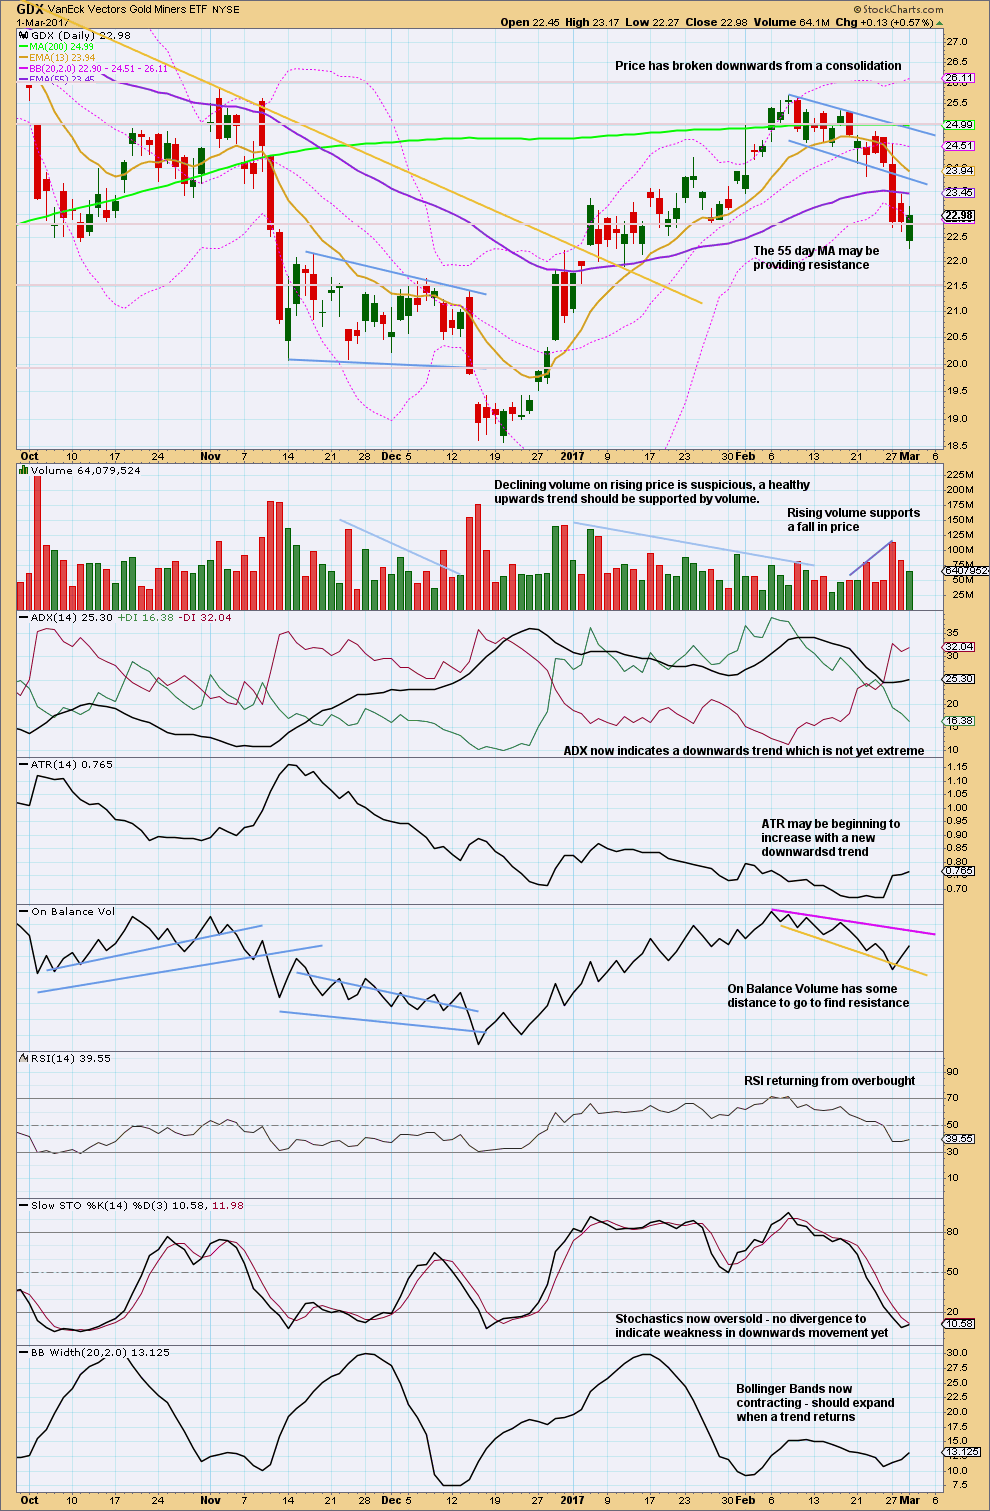
Click chart to enlarge. Chart courtesy of StockCharts.com.
Next support is about 21.50.
Today completes a downwards day but the balance of volume was again upwards and the session closed green. A further decline in volume for upwards movement within the session is bearish.
The lower trend line on On Balance Volume did not work, so it is adjusted.
This analysis is published @ 07:05 p.m. EST.
Spread on 10.00 strike calls for JNUG June expiration has become totally ridiculous. Buying much more reasonably priced 11.00 strike calls for one buck even. UUP spiking above upper BB. I think that’s all she wrote!
With the breach of the base channel on the main hourly and daily charts (pink channel) that count is now relegated to an unlikely alternate.
The new count which is now preferred strongly is the alternate. So I’ll relabel that main count. I may not even publish the other, the probability is so low now.
A deeper pullback has arrived. Finally! Look now for some support, maybe a bounce at the blue trend channel. That needs to be breached for intermediate (2). When it is breached then it would be typical to see price bounce up for a test of resistance at that line. If price behaves like that it would offer a perfect entry opportunity to join the short term downwards trend. I will be very patient and wait for that set up, it may take a few days.
So, I want to ask in here if any members have taken any trades as a result of Trading Room? (I know Verne did on EURUSD at least)
So far I’ve provided accurate advice for NZDUSD, EURUSD, not so good finding an entry for USDJPY but it didn’t make a new low and is now moving upwards and away, Copper was accurate, NGAS was really accurate, USD Index has also been very accurate.
So do any members have positive positions on any of the above as a result of Trading Room posts? I’m trying to gauge how useful you’re all finding it.
If not, why not? Is there a better way I can present this advice and these set ups that would give you more confidence? Is it that you’re not used to trading those instruments and only want to trade Gold / miners?
And finally, if any members here think they can see a profitable opportunity on any other market let me know and I’ll analyse it. If I see a good trade set up I’ll put it in next Trading Room post.
Hi Lara, I dont have a copper position but i have some copper miners, which i have sold for a profit, since were looking at a big drop soon if you wave count is correct.
The trading room kept me coming back to the site more often during my membership break. The copper (recent) and Natgas trades have been excellent. I’ve not taken a position, but the USD pairings are great when looking at the macro themes playing out. I find the analysis very valuable. Thanks.
I was in the USD/JPY as the chart did look bullish but got stopped out and did not re-enter as I thought the pattern was broken?
Regarding gold, I was short, but stopped out and went long and on the break of 1245 when you turned bullish and thought we were in a series of wave 3’s, and was stopped out again…so I am really struggling.
I feel your pain David, it certainly happens to us all. It’s a shame about the gold trade which was quite profitable from 1245 -> 1264. I make absolutely no claims to be expert trader but wonder if a more conservative strategy might suit if you are finding your profitable trades evaporate. One such method might be to exit your trade once the hourly trendline is broken – in this example it would have been around 1255, not too shabby considering the alternative
I too had small losses on USDJPY. That one has proven hard to find an entry. If I’d been more disciplined and had my stop below the last swing low I would now have a profitable position. It didn’t make a new low and did find support at the blue line, but I set my stop too close 🙁
Gold too has been a hard one to read, which is why I’m not trading it ATM.
Unfortunately David you’ve picked the two worst of what I’ve been analysing recently.
David, I did also point out on the 27th that long positions should be lightened to take profit, or exited:
“Lighten long positions to take some profit (or exit entirely and wait for clarification)”
So please note when I point out when to take profits.
This is one of my hardest things I’ve had to learn. When to exit. There was enough bearishness on Monday to warn that the main count was in danger.
Got rid of copper miners as well.
Lara…Natgas has been great. I honestly haven’t dove into fx too much, but the trading room will change my MO. I’d personally like to see the article header change from OIL to OIL/NatGas since it’s the same industry…or give it its own section. As long as you don’t get overloaded, I’d like the continuation of the Trading Room, as there’s always a trend…somewhere…and you identifying them is great.
Most excellent trade on the Euro Lara!
Also went long the dollar via UUP once it closed above 26.00 The wily market makers almost took me out with a a vicious “shake- the- trees ” move down to 26.03. inches away from my 26.00 mental stop- Whew!Took profits on both today with UUP cavorting above upper BB and printing a doji; thank you berry berry much!!! 🙂
That’s fantastic everybody. Thanks for the feedback.
Hi Lara, I took out a calendar on EEM. Believe it was your original post where you had EEM. I would like to learn more about the funds, example FXE Vs EUR/USD, and their correlations. I have been watching USD/JPY and FXY based on the trading room charts and commentary.
I really enjoy the trading room and the talk about positions, stops, and so on. Timeframes are always helpful. Alot of great dialogue happening over the past few months.
JPM on the move. Massively short selling Silver futures in preparation to scoop up a few more hundred thousand Kg bars. Where the hell is the CFTC? This kind of crap should be illegal!
The upcoming bounce at the end of the current decline should be sharp.
I continue to accumulate June JNUG calls on the move down.
I think you will be heavily rewarded. I’m guessing silver may correct .618 of move up. I would guess we have one more move down to 16.5 (.38) before we bounce up (slv) to about 16.9. Then another move down to about 16. This would be a great entry point and would complete a zig zag correction. The commercials were getting heavy on the short side. I’m guessing gold might go down to about 1170, a .618 correction. These moves may be swift, again just guessing with some help of fibannocci. The march 15 rate hike may be the turning point or a new high in the market that shakes out some of the last gold holders. We also need to be aware it is possible silver and gold are going to surpass there recent lows although I don’t think that would be the case. We will have to watch the commercials closely. The clue that silver was going to drop was the miners carnage, which I didn’t see coming that quickly. I think we need to be aware of the stock market making a quick move down within the next few days/weeks.
Heavy put and call open interest at 17 on slv for tomorrow’s expiration. I’m guessing that is where we will close tomorrow
Just wondering if 50% retrace of Trump H 1335 / L 1123 at 1229 will hold lol….
Silver finally breaking down today…
Spreads on JNUG calls starting to tighten considerably Adding to June 10.00 strike calls to lower cost basis. Holding 1.00 strike calls for option exercise once price goes past 10.00
With the price drop below yesterday’s low of 1237.18, both wave counts at the hourly level are invalidated. Lara’s closing comment is really prescient: “Overall, the picture is bearish. The sole exception is the long lower wick on today’s candlestick” (sic).
For the Main Count, Minuette 2 is incomplete. It morphed into a combination. At the moment, there is still one more low to negotiate.
For the Alternate Count, Minuette 1 is still continuing. I reckon the point labelled as Minuette 1 is actually only subminuette 3. Like the Main Count, there is still one more low to complete the wave.
Main hourly wave count invalidation is at 1226.53. Gold is till above 1232. That does not mean it will not get invalidated.
Silver really took hit?
I think Alan is referring to the breach of the base channel, considerably reducing the probability of the main count (though technically not completely invalidated)
I think we are now looking for subminuette 5 of minuette 1 to complete (alternate count)
I do not know any analyst forecasts like Lara in short term. Thanks. I am impressed.
Lara:”All three hourly Elliott wave charts yesterday expected some downwards movement to at least 1,240.”
That is exactly what happen.
Thank you Papudi for your vote of confidence 🙂
GDX gapped down, then moved higher for a gap fill and continued higher. While it is possible that the bottom is in, I think that is less likely. That said, the price to watch is 24.13. A move above that price point will likely mean the bottom is in.
My main count shows GDX in Minute wave 4 up. A little more up is likely before a reversal back down to new lows.
https://www.tradingview.com/x/w6JihVkf/
GDX Hourly over the past 2.5 months. Again no EW labels but, based on what I see, it shows moderate potential for an upward movement for at least the start of the day tomorrow. I’m also of the thinking that this market is so choppy it’s hard to stay in long right now. NOT always perfect, yet I look for 4 things on the chart for a short term trade which would allow for an in/out trade in hours rather than days:
1- Current price at or above 10 day MA (pink line) preferably just passing thru it,
2- Black MACD crossing above Blue trigger line moving UP,
3- Slow STO %K(144) is above 20 and moving up(when above 80 more inclined to sell than buy)
4- Current price moving toward 250 day MA when its below 250 MA… and moving away from 250 day MA when price is above 250 MA.(be careful not to go in excess away from 250 MA)
All these criteria are most reliable, especially when the 10 day MA(pink) has passed through the 50 day MA(orange) moving UP(as seen on the 26DEC16 and 31JAN17) and this formula can be used for any fund out there.
I really like the EW analysis of Lara and the rest, because it gives great support to this method as to trend and what may be expected short and long term. Thank you all for your awesome contributions.
That STO 144 does look bullish. If GDX does make a new low, then the STO 144 may make a higher low showing divergence to support a buy. Same could happen with MACD.
I agree Dreamer.. it appeared the miners were back in alignment with gold in yesterday’s trading, but gold has turned down again overnight. Perhaps a repeat of yesterday or your “one more low” in GDX, or both?!