
A fourth wave correction ended right at the lower edge of the Elliott channel and from there price bounced up to make new highs for a fifth wave.
Summary: Assume the trend remains the same until proven otherwise. Assume price will keep going up while price remains within the pink channel and above 1,227.04. The target is at 1,253 or 1,263. A breach of the channel would indicate a second wave correction has begun. If there is a breach and a correction is underway, then it should find support at the lower edge of the black base channel on the daily chart if it gets that low.
New updates to this analysis are in bold.
Last weekly charts are here and the last video on weekly wave counts is here.
Grand SuperCycle analysis is here.
MAIN ELLIOTT WAVE COUNT
DAILY CHART
Click chart to enlarge.
This daily chart will suffice for both weekly charts.
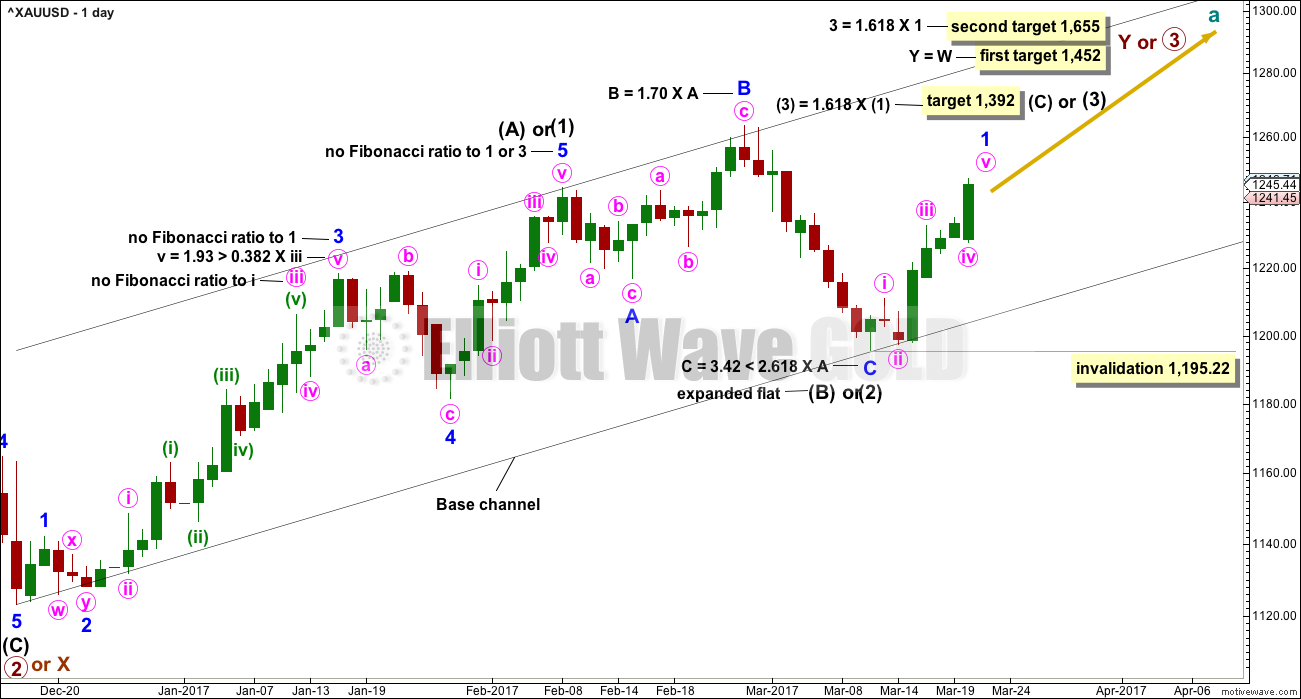
Upwards movement is either a third wave (first weekly chart) to unfold as an impulse, or a Y wave (second weekly chart) to unfold as a zigzag. If upwards movement is a zigzag for primary wave Y, then it would be labelled intermediate waves (A) – (B) and now (C) to unfold.
Intermediate wave (1) or (A) is a complete five wave impulse lasting 39 days. Intermediate wave (2) or (B) so far looks like an expanded flat, which is a very common structure.
So far, within intermediate wave (3) or (C), the first wave up for minor wave 1 may be close to completion. When it is complete, then minor wave 2 may unfold lower. Minor wave 2 may not be a very deep correction because the strong upwards pull of a big third wave may force it to be more shallow than otherwise. However, if it is relatively deep, it may find support at the lower edge of the base channel and may offer another opportunity to join the upwards trend.
Minor wave 2 may not move beyond the start of minor wave 1 below 1,195.22.
HOURLY CHART
Click chart to enlarge.
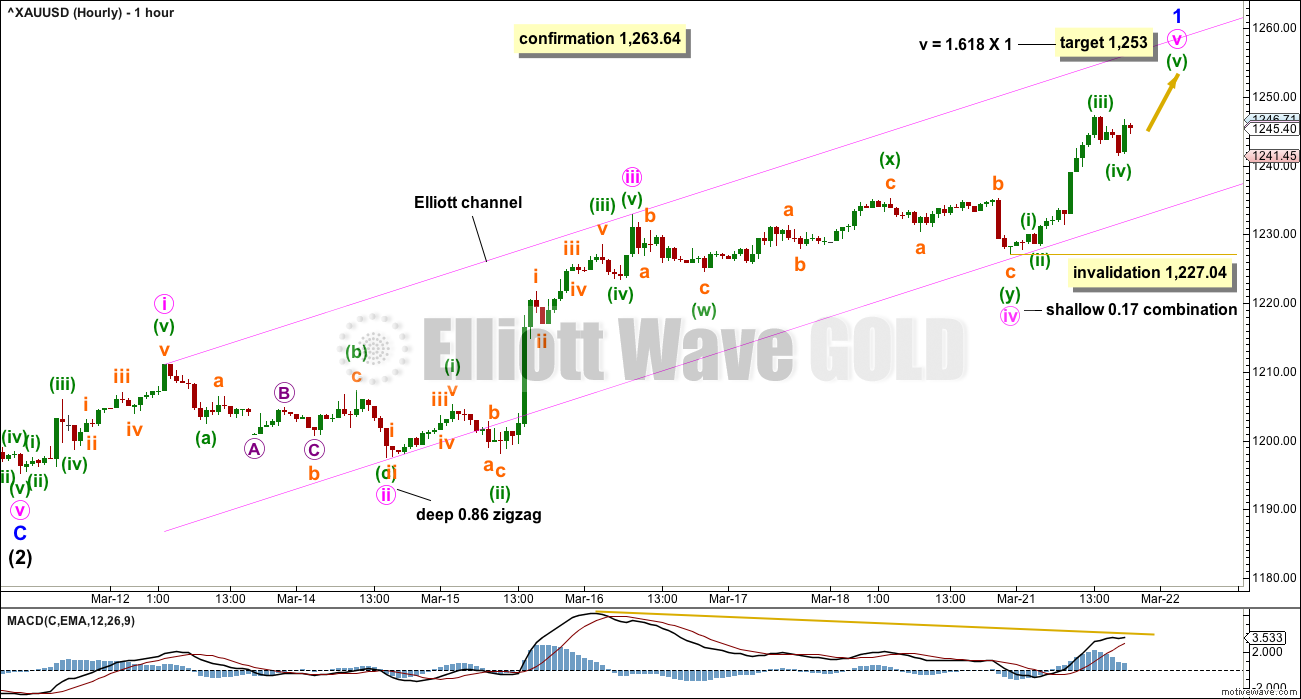
The whole of minor wave 1 is shown today on this chart.
Minor wave 1 has a good five wave look to it. Using MACD as a guide to the Elliott wave count, minute wave iii exhibits strongest momentum and minute wave v exhibits some divergence.
Minute wave iii has no Fibonacci ratio to minute wave i. This means it is more likely that minute wave v will exhibit a Fibonacci ratio to either of minute waves i or iii.
It is possible that minute wave v is over at today’s high. If yes, it would be 1.84 short of 0.618 the length of minute wave iii.
If price keeps rising, then the first target is at 1,253. If price keeps rising beyond first target, then the next target would be about 1,263 where minute wave v would reach equality in length with minute wave iii.
Use the pink channel as a guide to when minor wave 1 has ended. If price breaks below the lower edge with a full hourly candlestick below and not touching the lower edge, that shall provide some trend channel indication that minor wave 1 would be very likely over and minor wave 2 would be very likely underway.
When that happens, draw a Fibonacci retracement along the length of minor wave 1. The 0.382 Fibonacci ratio would be a first target for minor wave 2 (may not be a very deep correction). If price falls through that first point, then the 0.618 Fibonacci ratio would be the next target. If minor wave 2 is relatively deep, it should find very strong support at the lower edge of the black base channel. A breach of that trend line is not expected for this main wave count.
ALTERNATE ELLIOTT WAVE COUNT
DAILY CHART
Click chart to enlarge.
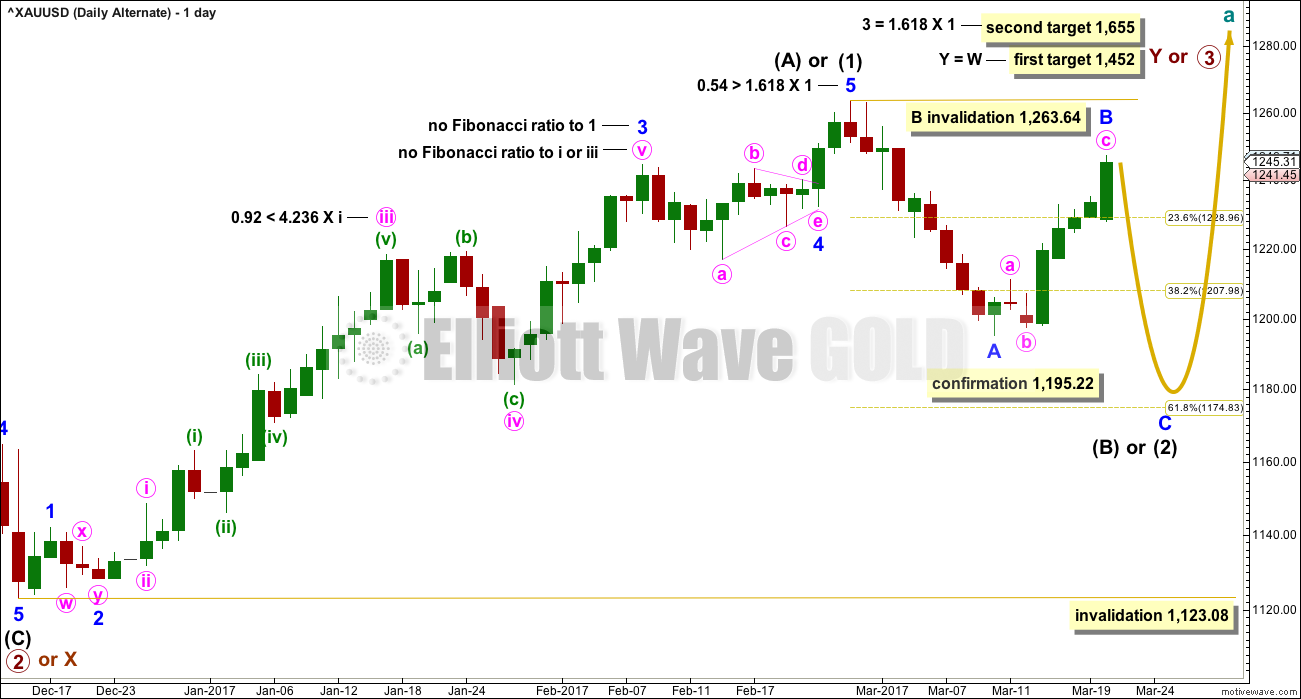
This alternate wave count is in response to queries from members.
Fibonacci ratios are noted on both daily charts, so that members may compare the main and alternate wave counts. This alternate wave count has slightly better Fibonacci ratios. This gives this wave count a reasonable probability. Due mostly to volume, this wave count is judged to have a lower probability than the main wave count.
At this stage, this wave count would be considered confirmed if price makes a new low below 1,195.22. At that stage, the target for intermediate wave (2) or (B) to end would be the 0.618 Fibonacci ratio of intermediate wave (1) or (A) at 1,175.
At the hourly chart level, this alternate wave count would now have to see the structure differently from the main wave count. Minor wave B must be a zigzag; it cannot be seen as an impulse. This is problematic because the upwards movement looks very strongly like a five on the hourly chart. This wave count would be forced now. The probability of it has further reduced today.
TECHNICAL ANALYSIS
WEEKLY CHART
Click chart to enlarge. Chart courtesy of StockCharts.com.
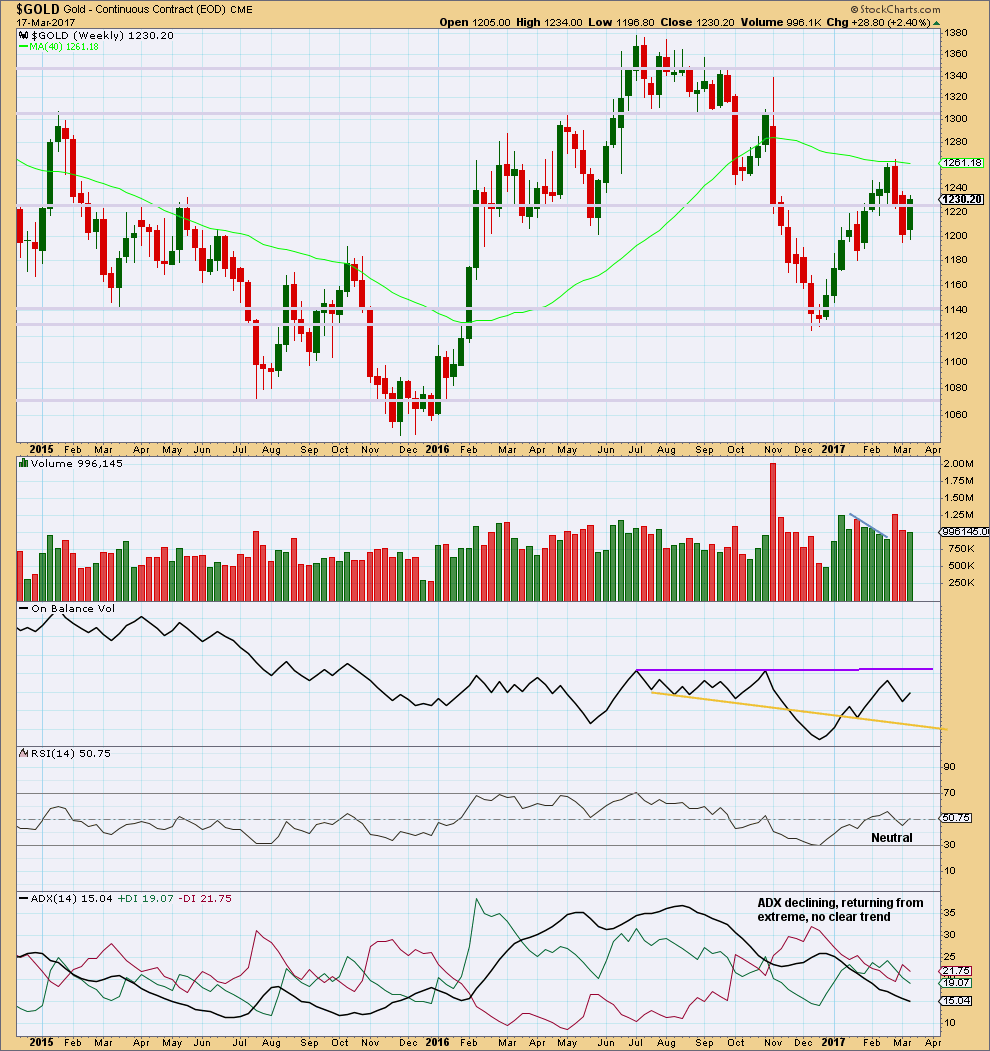
Last week completes an inside week with slightly lighter volume than the previous week. While the previous week saw falling price on declining volume, which pointed to an end to downwards movement, last week looks more like a correction within a downwards trend than a new upwards trend.
On Balance Volume has some distance to go before it would reach either resistance or support, so it is not giving any signal at this stage.
DAILY CHART
Click chart to enlarge. Chart courtesy of StockCharts.com.
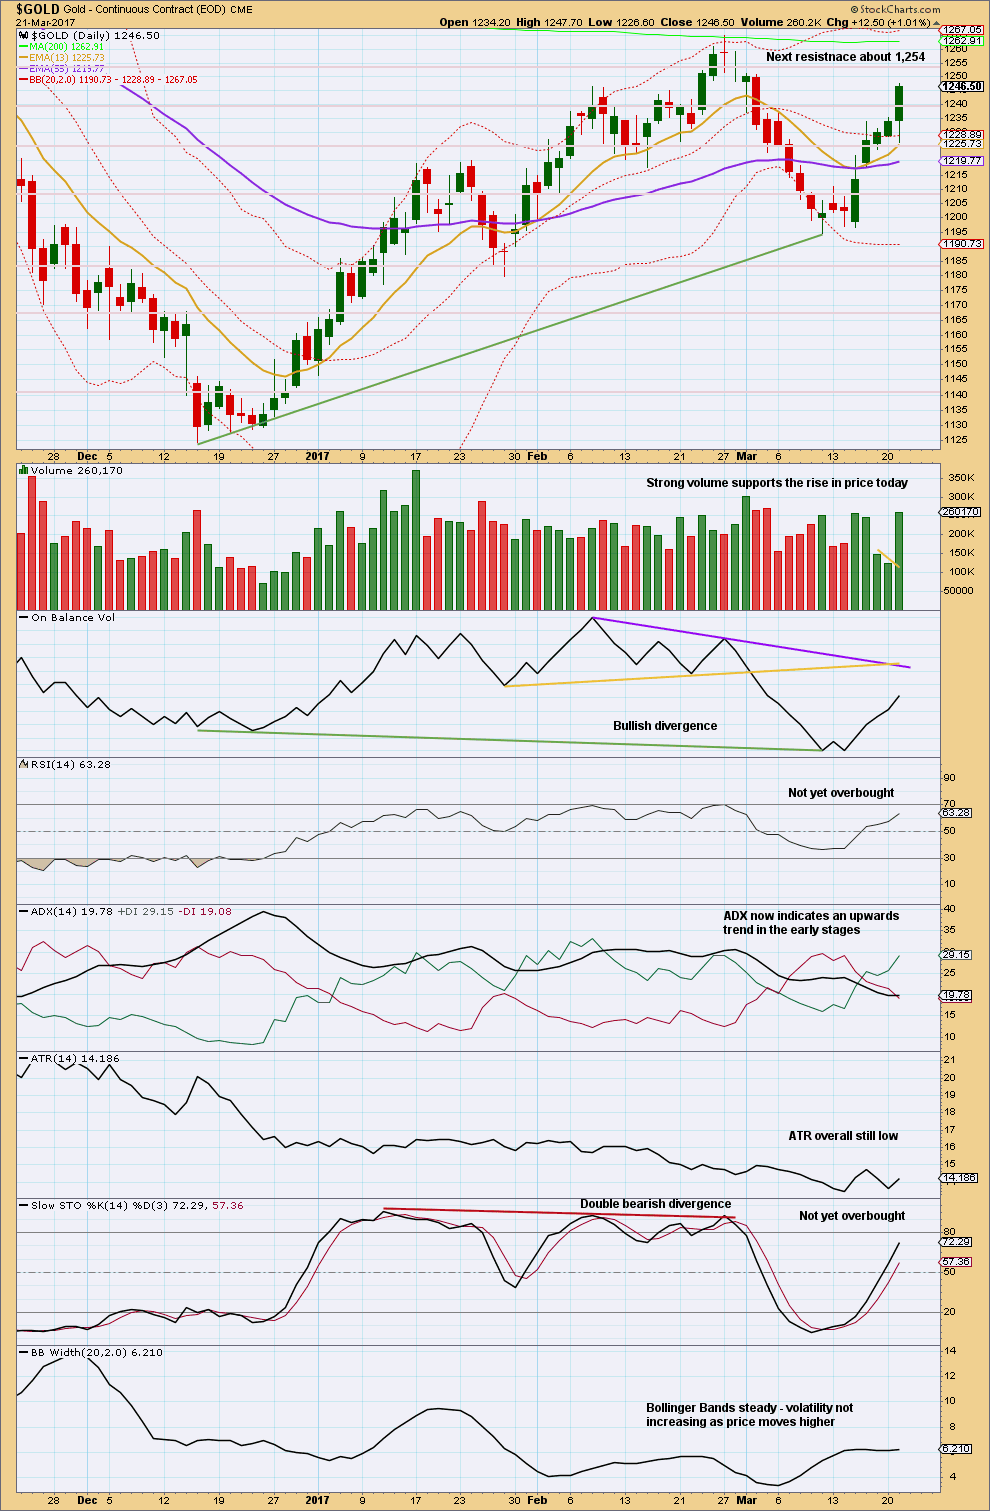
Strong volume today supports the rise in price. The long lower wick of this daily candlestick is bullish. Assume the trend is up, until proven otherwise by a breach of the channel on the hourly Elliott wave count.
There is room for price to continue higher. RSI and Stochastics are not yet extreme.
ADX has finally caught up with price. An upwards trend is indicated and there is plenty of room for it to run.
GDX
DAILY CHART
Click chart to enlarge. Chart courtesy of StockCharts.com.
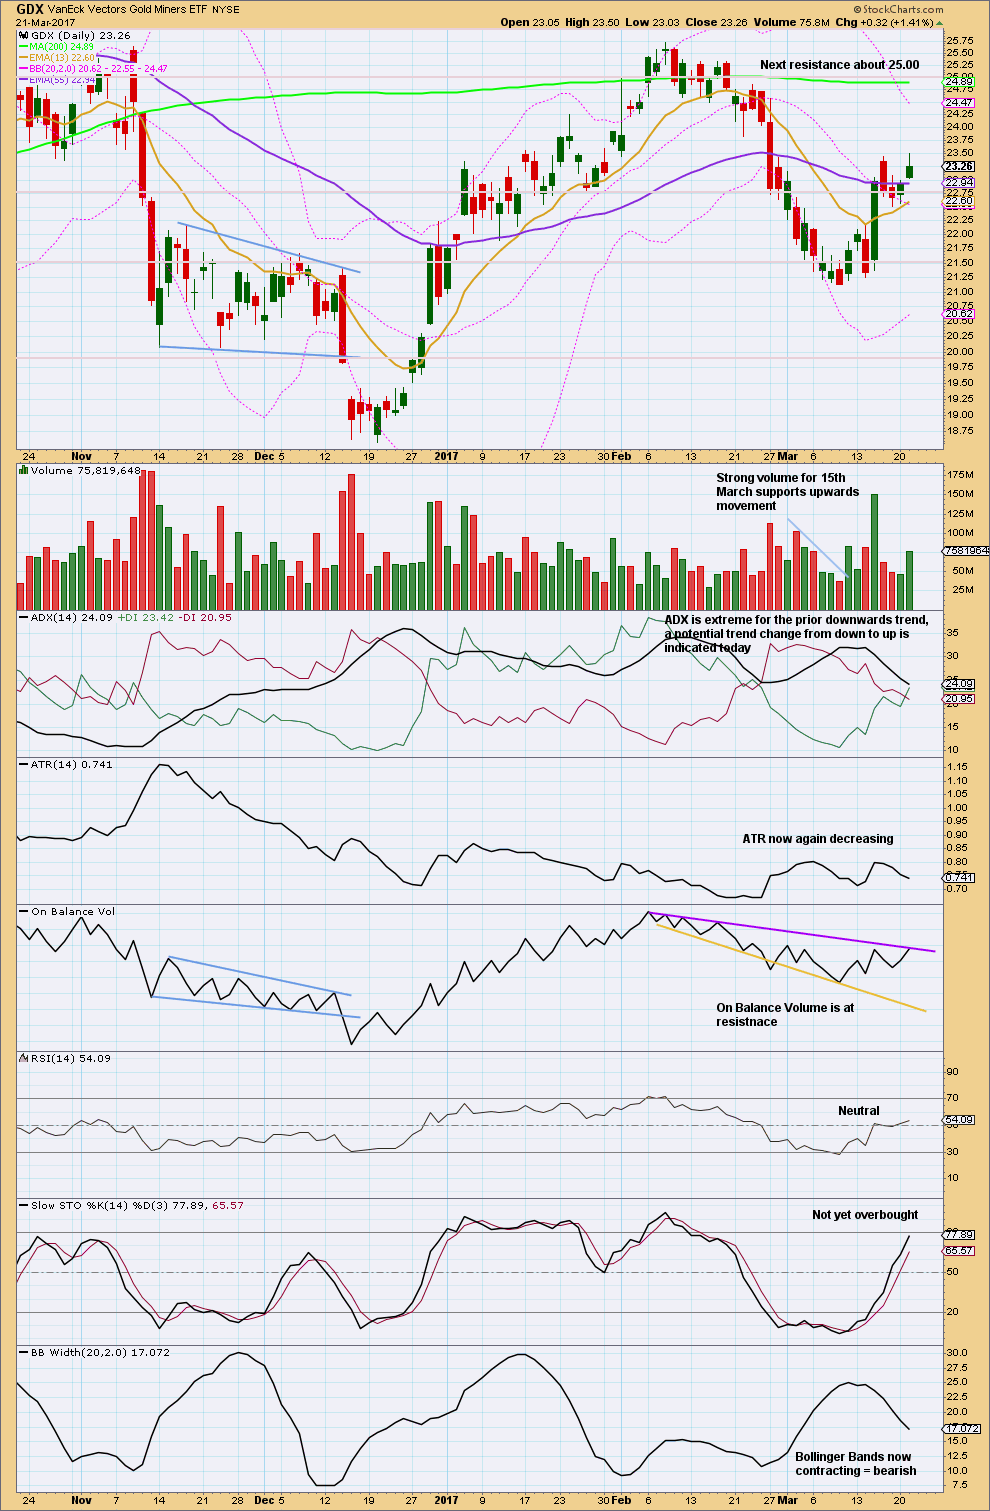
On Balance Volume may halt the rise in price here.
GDX now has a very clear five up on the daily chart. The next structure should be a three down, for a pullback.
But RSI and Stochastics are not yet overbought, so there is room for upwards movement to continue before a pullback arrives for GDX.
This analysis is published @ 08:01 p.m. EST.
I can see a small ending contracting diagonal. It needs the final fifth wave up.
Ending diagonals must have all subwaves subdividing as zigzags. That’s why you see subminuette waves i and iii labelled A-B-C. They have to be.
The classic pattern equivalent is a rising wedge. They’re terminal structures.
If subminuette wave iv is over here then the limit for subminuette wave v is at 1,253.93. It can’t be longer than subminuette wave iii, because the diagonal is contracting and also because the third wave may not be the shortest.
Within a diagonal the fourth wave should overlap first wave price territory. The rule for the end of a fourth wave of a diagonal is it may not move beyond the end of the second wave. Subminuette wave iv may not move below the end of submineutte wave ii at 1,244.97.
Contracting diagonals almost always end with a small overshoot of the 1-3 trend line.
Watch the upper orange trend line carefully. If price moves up to it and the upwards movement looks like a three wave movement, and if price slightly moves above the line, then look out for a very quick reversal.
If that happens then the high may be in for Gold.
Looks like the top is in for the miners
Yep! Hedging my long positions with some NUGT 10.50 puts expiring next week for 1.12 apiece. Profits from the short trade will of course be added to the long side thank you berry, berry much! Very reasonable spread I must say… 🙂
Bulls are definately tired today, every attempt upside is being corrected..
Alan,
At 2:10 PM EST we have a peak of Minute V of Minor 1. Likely started Minor 2? Normal for it have a ZZ to 50% down of 57 points (may be ?) or a shallow retrace?
ssandysc, I think the drop from the high of 1251.21 constitutes the third 1-2s. The high momentum of a wave 3 is not come yet. We may well terminate at Lara’s higher target of 1263.
Lara had mentioned that her first take of Minor 2 is at 0.382, with the possibility of a deeper 0.618. I wouldn’t want to venture a guess as to what Minor 2 is going to look like. Second waves, like B waves, have so many possible outcomes.
I see Minuette (v) of Minute v as an EDT? We see how it pans out?
With Barchart data gold may be a completed contracting ending diagonal.
Yes, that’s what I’m seeing too. Except it needs the final fifth wave still
Yes, an ending diagonal is a distinct possibility. Very good idea!
Only thing, I can see the 4th wave ending. A fifth is required.
I’m trying to figure out the current correlation between gold and the S&P 500. Yesterday, the S&P 500 fell through several support levels; down over 1%. Today, it’s treading water with no bounce. It looks like 2340 is the key support level to watch. On the daily it’s already made a lower low today and the same applies on the weekly.
With the Healthcare bill attempting to be passed by midnight tomorrow, it appears the S&P is expecting this to be a difficult task and if not passed, it’s expected to delay other pro-growth plans that are designed to generate better corporate earnings.
Regarding Oil, reports issued today indicate a crude build which is bearish. This also puts pressure on the S&P 500.
With that said, should the S&P 500 go through another pull back tomorrow and or Friday, I would think that gold would climb further. We’re seeing safe haven assets climbing; 10 year treasuries dropped from their 2.62% high; now at 2.39%.
Then again, should the Healthcare bill pass, it could be a spring board for the S&P to go higher and start the movement for gold to go lower, etc…
Looking forward to anyone’s comments.
Forgive me for time and time trying to figure out the optimal wave count to describe the current price movements. Hopefully, this time I can get it spot on.
I have a different count for Minute 5: 1227.04 – 1233.80 – 1231.47 – 1248.88 – 1244.71 – ?
Taking minuette 5 = 0.618 * minuette 3, I arrive at a target of 1255.47.
Meanwhile, minuette 5 is underway: 1244.71 – 1249.17 – 1246.46 – ? – ? – ? Using common Fib ratios, the target at minuette level is 1255.38.
Scrap the count. I’m deferring to Lara’s.
Minuette 5 is now: 1241.45 – 1248.88 – 1244.71 – waiting for subminuette 3, 4, 5.
Subminuette 3 is now: 1244.71 – 1250.31 – 1246.94 – – – .
Will now take a nap until near the close. I’m still holding on to my longs. It has so far been a lucrative ride.
Moving on, Minor 2 would provide some shorting opportunity. It could be 0.236, 0.382 or even 0.618 Fib. On the other hand, Minor C of the Alternate will then drop to 1175 thereabouts.
Looking good with 1244 holding; hope to see 1251-1259 range open up… Lets see 🙂
Using Trading view data, it appears that Minuette 4 may have completed as triangle, then Minuette 5 was a quick wave up. The top may be in, but we need to see a channel breach.
https://www.tradingview.com/x/4e1S9URf/
Barchart data looks a little different, so we’ll have to wait and see if the top is in.
Lots of large inverted H&S patterns appear to be forming. Unless all of these fail, a big move up is coming after the small Minor 2 correction concludes
https://rambus1.com/2017/03/21/pm-complex-combo-chart-9/
Yep! The next move up is gonna be YUGE!
GDX made a new high today. Minor 1 may now be complete or there may be another slight new high tomorrow.
https://www.tradingview.com/x/Cv5bIlqO/