
The target was at 1,253. So far price has reached 1,251.21, just 1.79 short of the target.
Summary: A Gravestone Doji on BarChart data, a decline in volume, overbought Stochastics, and a complete five wave structure for the Elliott wave count all point today to this upwards wave being very likely over here. But the bottom line is that while price remains within the Elliott channel on the hourly chart this call may be premature. It is possible price may edge a little higher before turning.
If a pullback does begin here, then at its end it would offer a good entry point to join a larger upwards trend. The pullback is expected to last either 5, 8 or 13 days, and end about 1,217.
Members should strongly consider exiting any long positions and taking profits, or at least use a trailing stop set just below the Elliott channel.
New updates to this analysis are in bold.
Last weekly charts are here and the last video on weekly wave counts is here.
Grand SuperCycle analysis is here.
MAIN ELLIOTT WAVE COUNT
DAILY CHART
Click chart to enlarge.
This daily chart will suffice for both weekly charts.
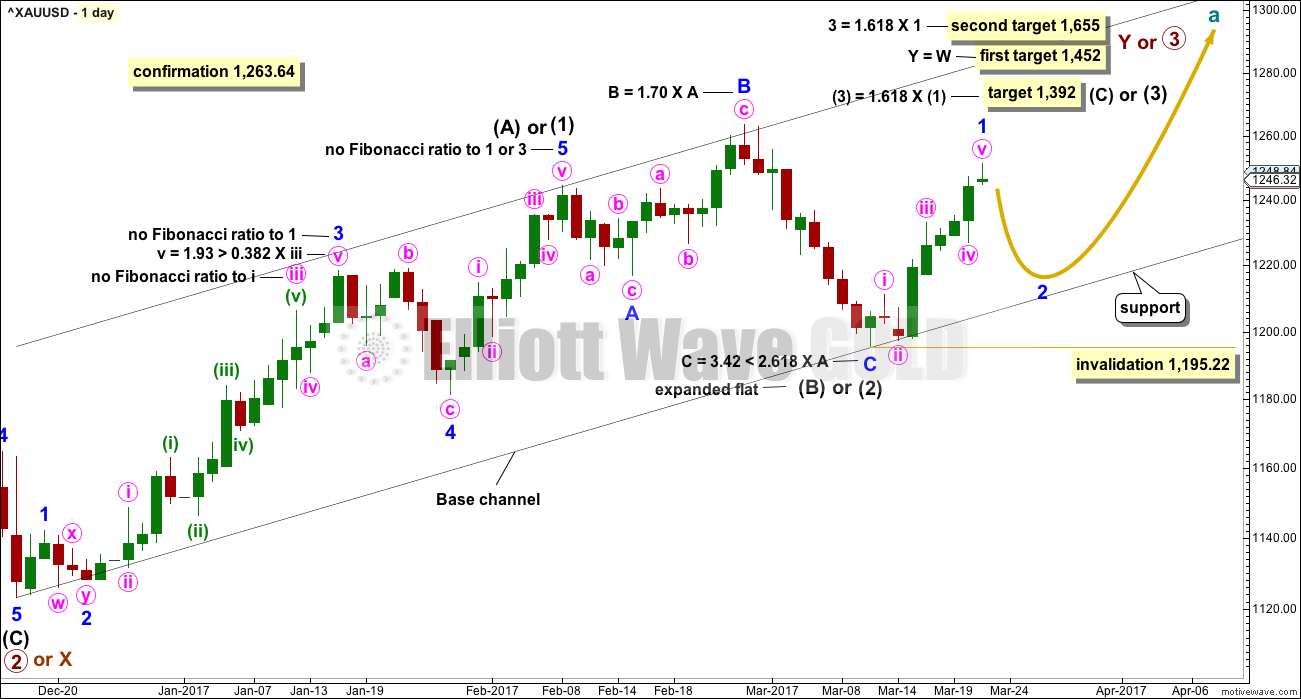
Upwards movement is either a third wave (first weekly chart) to unfold as an impulse, or a Y wave (second weekly chart) to unfold as a zigzag. If upwards movement is a zigzag for primary wave Y, then it would be labelled intermediate waves (A) – (B) and now (C) to unfold.
Intermediate wave (1) or (A) is a complete five wave impulse lasting 39 days. Intermediate wave (2) or (B) so far looks like an expanded flat, which is a very common structure.
So far, within intermediate wave (3) or (C), the first wave up for minor wave 1 may be complete today. Minor wave 2 may unfold lower. Minor wave 2 may not be a very deep correction because the strong upwards pull of a big third wave may force it to be more shallow than otherwise. However, if it is relatively deep, it may find support at the lower edge of the base channel and may offer another opportunity to join the upwards trend.
Minor wave 2 may not move beyond the start of minor wave 1 below 1,195.22.
At the daily chart level, for BarChart data today’s green candlestick is almost a Gravestone Doji (only almost because there is a very tiny lower wick). This is a strong bearish signal and one reason why I am labelling minor wave 1 as possibly complete today.
HOURLY CHART
Click chart to enlarge.
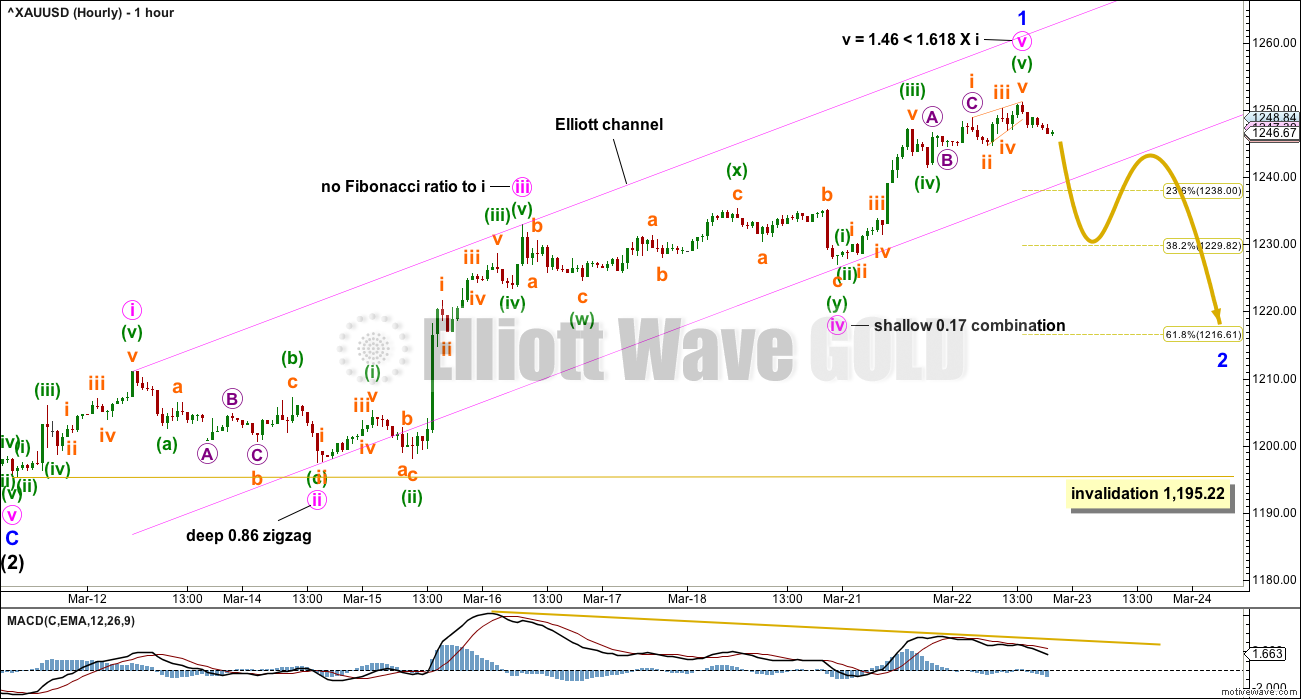
The whole of minor wave 1 is again shown today. It has a good five wave look to it.
MACD is useful tool to label impulses because it assists to identify where the third wave is. Here, minute wave iii is labelled at the strongest momentum reading given by MACD. From the end of minute wave iii, MACD now shows persistent divergence with price and minute wave v exhibits a decline in momentum.
However, it must be accepted that minute wave v could continue higher while price remains within the Elliott channel. My labelling today of minor wave 1 as complete may be premature.
If price breaks below the lower edge of the Elliott channel, then that shall provide strong confidence in this wave count. Minor wave 2 would be confirmed by a channel breach.
If minor wave 1 is over here, then minor wave 2 may correct close to the 0.618 Fibonacci ratio, at about 1,217. That would see minor wave 2 end short of the base channel on the daily chart.
Minor wave 1 may be over in a Fibonacci eight days. Minor wave 2 may last a Fibonacci five, eight or maybe even thirteen days. Any of those durations would give the wave count good proportions and the right look.
Minor wave 2 may be any corrective structure except a triangle. It is most likely to be a zigzag. It may be choppy and overlapping.
If price breaks below the Elliott channel, then look for a throwback to find resistance at the lower trend line. If price behaves like that, it would offer a good entry point for more adventurous traders to take a short term short position. However, minor wave 2 is a counter trend movement. As it is at minor degree and may last over a week, it may present a reasonable trading opportunity. But this should only be taken by more experienced traders because there is more risk in trading counter trend movements.
Less experienced traders would be best advised to be patient and wait for minor wave 2 to be over before entering long positions again. It is not necessary to always be in the market, and it is often the trades that you don’t take which make the difference between profit and loss.
Please remember my two Golden Rules:
1. Always use a stop.
2. Do not invest more than 1-5% of equity on any one trade.
Any members still holding long positions today are advised to consider taking profits. Alternatively, keep moving stops up to just below the Elliott channel.
ALTERNATE ELLIOTT WAVE COUNT
DAILY CHART
Click chart to enlarge.
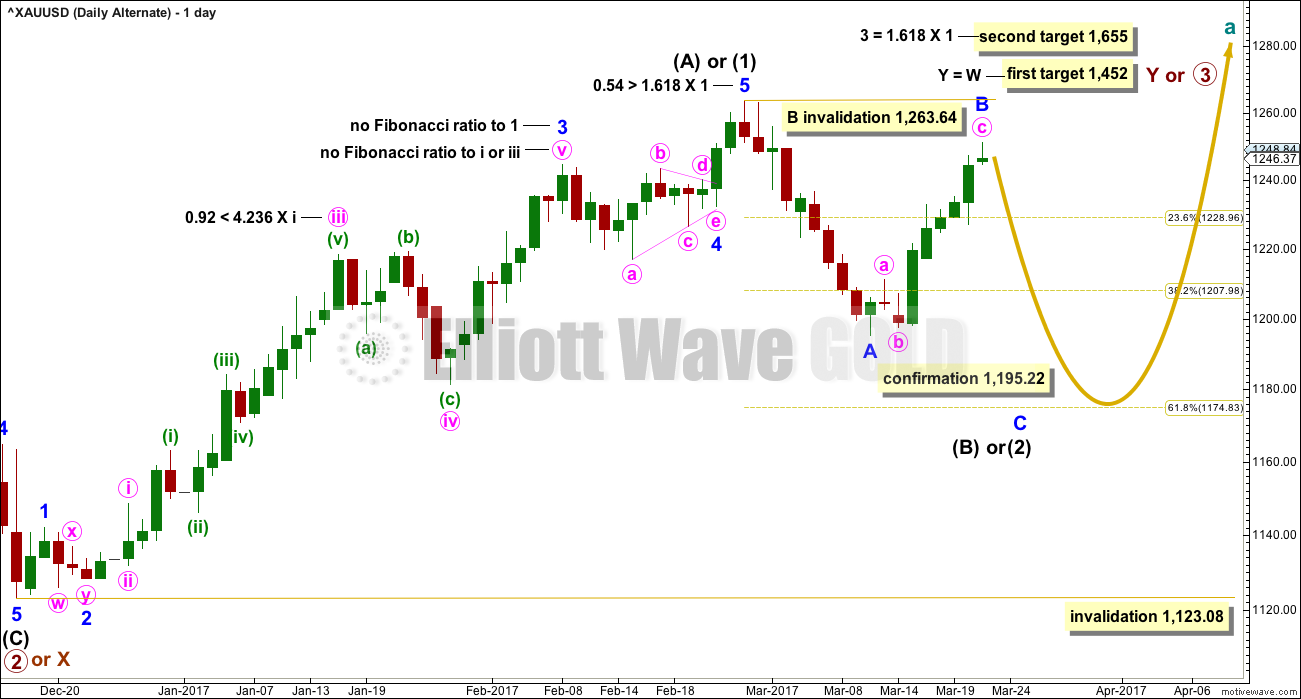
This alternate wave count is in response to queries from members.
Fibonacci ratios are noted on both daily charts, so that members may compare the main and alternate wave counts. This alternate wave count has slightly better Fibonacci ratios. This gives this wave count a reasonable probability. Due mostly to volume, this wave count is judged to have a lower probability than the main wave count.
At this stage, this wave count would be considered confirmed if price makes a new low below 1,195.22. At that stage, the target for intermediate wave (2) or (B) to end would be the 0.618 Fibonacci ratio of intermediate wave (1) or (A) at 1,175.
At the hourly chart level, this alternate wave count would now have to see the structure differently from the main wave count. Minor wave B must be a zigzag; it cannot be seen as an impulse. This is problematic because the upwards movement looks very strongly like a five on the hourly chart. This wave count would be forced now. The probability of it has further reduced.
TECHNICAL ANALYSIS
WEEKLY CHART
Click chart to enlarge. Chart courtesy of StockCharts.com.
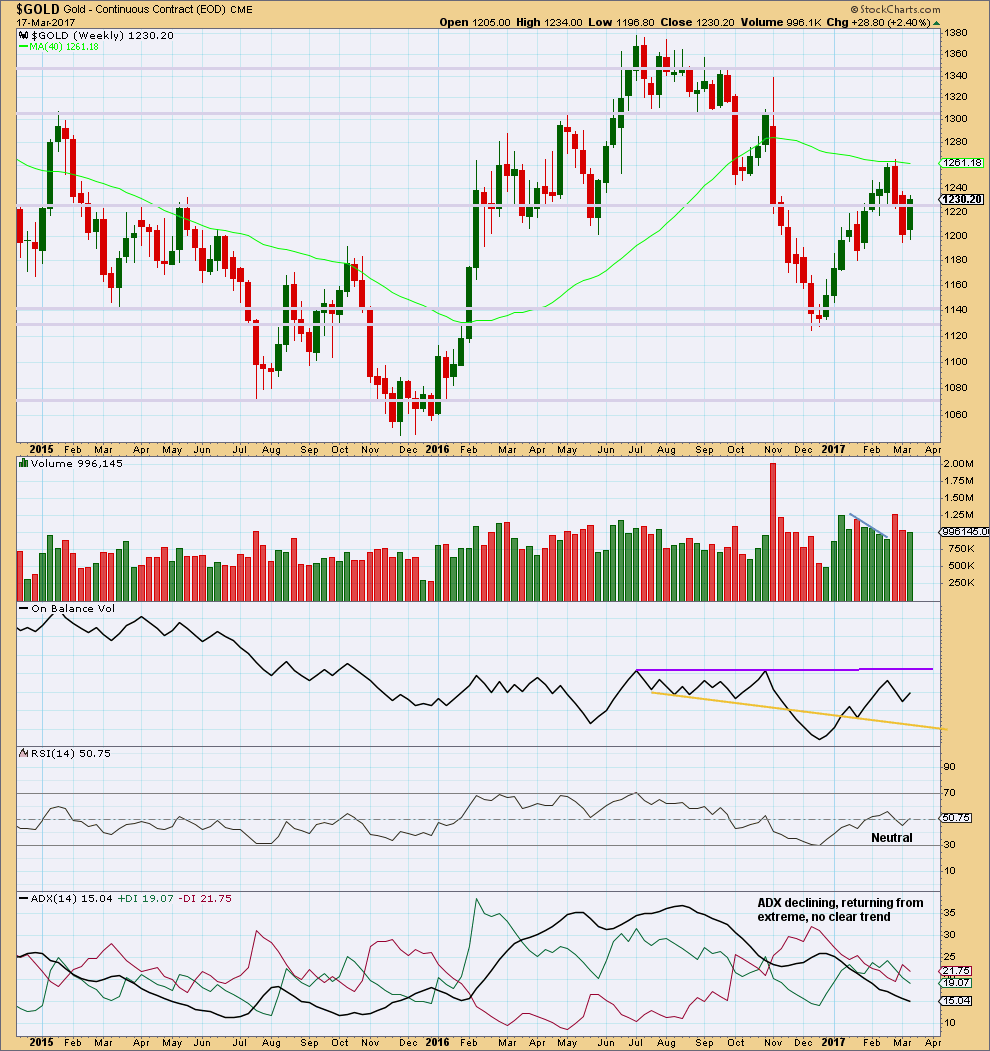
Last week completes an inside week with slightly lighter volume than the previous week. While the previous week saw falling price on declining volume, which pointed to an end to downwards movement, last week looks more like a correction within a downwards trend than a new upwards trend.
On Balance Volume has some distance to go before it would reach either resistance or support, so it is not giving any signal at this stage.
DAILY CHART
Click chart to enlarge. Chart courtesy of StockCharts.com.
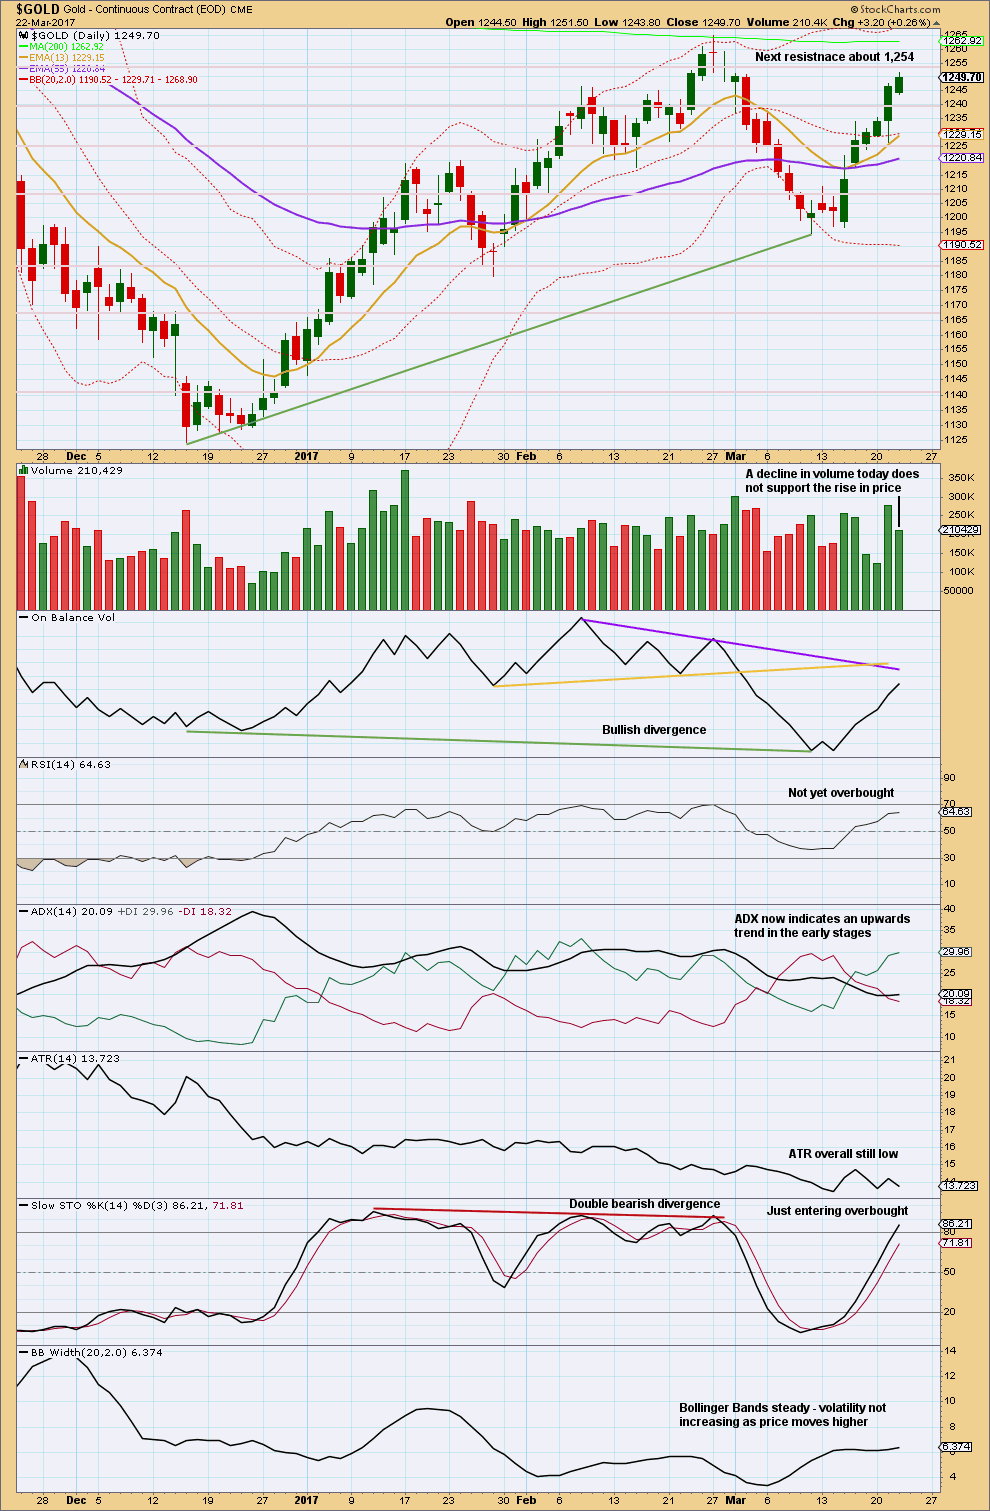
A smaller real body for another upwards day with a decline in volume does not have good support for upwards movement. The upper wick on today’s candlestick from StockCharts data is longer than the lower wick, but this is not a Doji.
Price may be finding good resistance here about 1,254.
Stochastics is just entering overbought, but this can remain extreme for long periods of time during a strong trend for Gold. However, there is some weakness in this trend. ATR remains persistently low and Bollinger Bands remain flat. All three of these indicators together signal more caution here about any expectation of continuing upwards movement.
On Balance Volume is too far away from resistance to be of assistance today.
GDX
DAILY CHART
Click chart to enlarge. Chart courtesy of StockCharts.com.
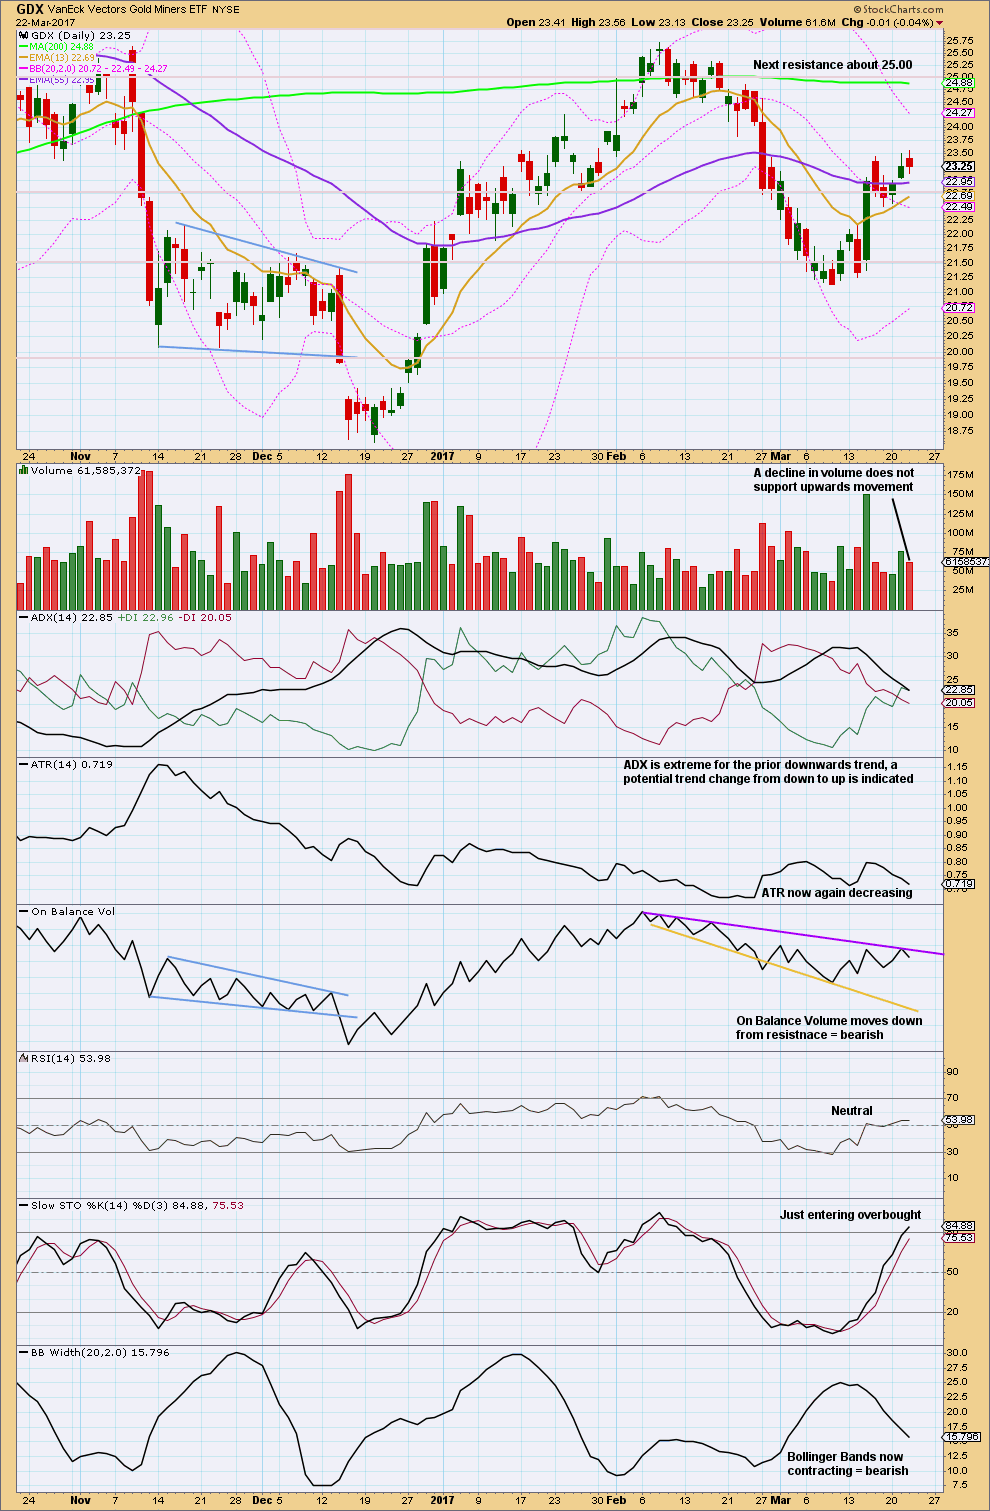
GDX completes an upwards day with a higher high and a higher low, but the session closed red and the balance of volume was down. This is bearish at least short term. Volume for the session declined; the fall in price was not supported by volume. This slightly mitigates the bearishness of the red candlestick.
On Balance Volume gives a bearish signal today.
Look out for some pullback here from GDX. Support is about 22.75 and next about 21.55.
This analysis is published @ 09:29 p.m. EST.
To the people who have signed up for a one week $1 trial and have chosen to cancel and sign up for a second trial:
I have just given you a week’s worth of darn good analysis, you should have been able to profit from it. I gave good trading advice too.
Trying to take multiple trials, particularly when I’m getting it right is very rude.
Don’t do it. You may find yourself blacklisted on this site and any / all other sites I have now and in the future.
It’s disrespectful and reeks of a scam to take multiple trials. I do not appreciate it.
I am a relatively new member but have already improved my trading knowledge and results considerably thanks to Lara’s excellent analysis and the contributions of other members here. In particular, Lara’s accuracy with target prices has been superb. The trading room has just been an added bonus too. Worth every penny imvho.
Thanks for the chart Lara….I imagine that several of us have been watching exactly what you picture so clearly on your chart/s.
Also thank you for the Copper update. I am watching to see if your gold resistance line holds price back.
Good day…
You’re welcome.
Copper’s proving a difficult one to enter. I’ve entered too soon, I should have been more patient and waited for the bounce off the trend line, which I expected was likely and turns out it did happen. So underwater there. But no new high yet, so I’m holding on.
Oil is doing nicely though, so we should all have profitable positions there. Moving stops to breakeven now eliminates risk on that trade.
My first instinct was to label minor 1 over at the slight new high today. Because price remains within the channel. That now gives a really great Fibonacci ratio for minute wave v.
We really do need to see that channel breached to have confidence minor 1 is over. While price remains within it I could be wrong, price could continue to edge up slowly to new highs. That’s happened before in recent memory.
Price keeps bouncing up off the lower edge of the channel.
Bearish engulfing candle on GLD today…let’s get that correction over with shall we…?! 🙂
Nice pop on those NUGT 10.50 puts so far….
The upcoming second wave corrrection is going to be the last best chance of the bankster cohort shorting the metals to unwind before getting buried. I am expecting a rocket ship move offf this second wave down. Holding longs, hedged with NUGT 10.50 puts…
Agreed Verne. It should offer us all a fantastic opportunity for an entry to go long and hold it for weeks.
My job is going to be figuring out when and where it’s over. Trying to pin point when to enter.
Probably one of the more eagerly anticipated entry points ( or should I say “addition” points ) for me in recent memory! I am looking forward to rolling those NUGT puts profit onto the long side of the trade…. 🙂
Let’s consider possibilities for Minor 2.
If Minor 2 is an expanded flat, it would terminate probably around 1238, 0.236 Fib. It could be 1251.25 – 1244.64 – 1252.75 – (1235.55 @ 2.618 Fib).
This implies that Minor 2 must be a combination, possibly expanded flat – an X wave – a 5-wave impulse, in order to arrive at a lower price value, be it 1230 (0.382 Fib) or 1217 (0.618 Fib). In this setup, the impulse could offer a good shorting opportunity.
Gold target hit, just wonder if this is micro iii or v of subminuette v. Maybe over here or could be one more leg up first?
imo if gold price can hold above 1251 / 1248 (50% retrace H 1375 / L 1123) then 1260 could be to look out for lol… Have a fine day. GL.
My consideration of a series of 1-2s yesterday (instead of the ED) had the first target around 1255-1256. The next target would be 1262 in which Minute 5 = Minute 3.
Then again, in the ED scenario, this means that Minor 2 has to be an expanded flat.
I’ll let further developments sort the matter out. I’m not complaining though. I had held on to my longs despite the ED scenario, and fortune smiled on me. Yellen had probably weaved some kind of spell.
deep second wave pull back in play
… and loving it.
GDX
https://www.tradingview.com/x/KSPbXqrx/
Isn’t that just a perfect five up from GDX though?
Minute ii is a deep flat, minute iv exhibits alternation as a shallow zigzag, minute v has a perfect impulsive count of 9. That’s really satisfying analytically.
If you drew the EW channel using the 2nd technique: from 2 to 4, a copy on 3, would it now be breached?
Lara, yes, the 5 up looks great and Minute 5 has a perfect 9 count.
The reason I used a best fit channel is because with the EW Channel 2nd technique, virtually all of Minute 5 is outside the channel. The best fit channel seemed to look much better and add more value by showing the channel breach and back-test confirming the 5 up was complete.
Would you still use the Elliott channel in this case? If so, why? Thanks,
https://www.tradingview.com/x/ejoS6Tha/
Aha.
No, I’d use a best fit channel. But the fact that with even the 2nd technique minute v is all below the channel is bearish.
Thanks for the illustration Dreamer.