
A slight new high was not expected but was allowed for. Thereafter, price has turned downwards to breach the channel on the hourly chart.
Summary: Another pullback looks most likely to have begun today. The target is about 1,217; but if this is wrong, it may be too low. The target may be met in 3, 5 or 8 sessions. At its end, this pullback may offer an excellent opportunity to join the upwards trend.
New updates to this analysis are in bold.
Last weekly charts are here and the last video on weekly wave counts is here.
Grand SuperCycle analysis is here.
MAIN ELLIOTT WAVE COUNT
DAILY CHART
Click chart to enlarge.
This daily chart will suffice for both weekly charts.
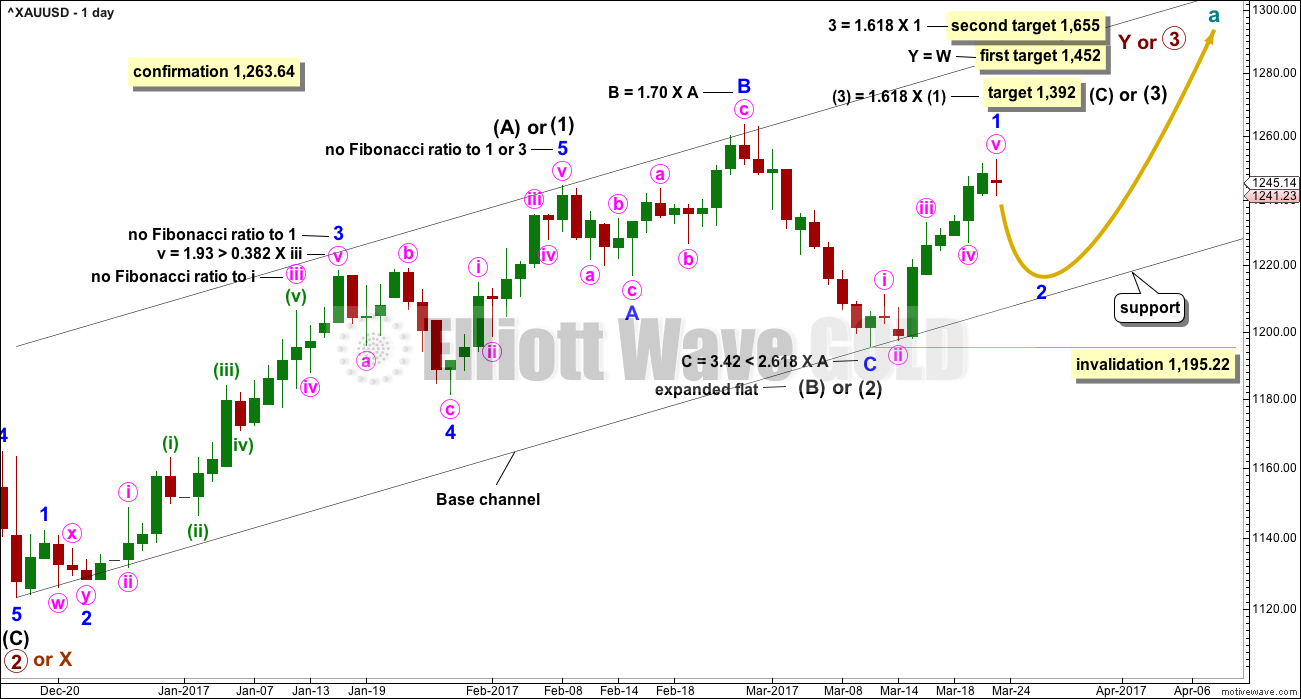
Upwards movement is either a third wave (first weekly chart) to unfold as an impulse, or a Y wave (second weekly chart) to unfold as a zigzag. If upwards movement is a zigzag for primary wave Y, then it would be labelled intermediate waves (A) – (B) and now (C) to unfold.
Intermediate wave (1) or (A) is a complete five wave impulse lasting 39 days. Intermediate wave (2) or (B) looks like an expanded flat, which is a very common structure.
So far, within intermediate wave (3) or (C), the first wave up for minor wave 1 may be complete today. Minor wave 2 may unfold lower. Minor wave 2 may not be a very deep correction because the strong upwards pull of a big third wave may force it to be more shallow than otherwise. However, if it is relatively deep, it may find support at the lower edge of the base channel and may offer another opportunity to join the upwards trend.
Minor wave 2 may not move beyond the start of minor wave 1 below 1,195.22.
HOURLY CHART
Click chart to enlarge.
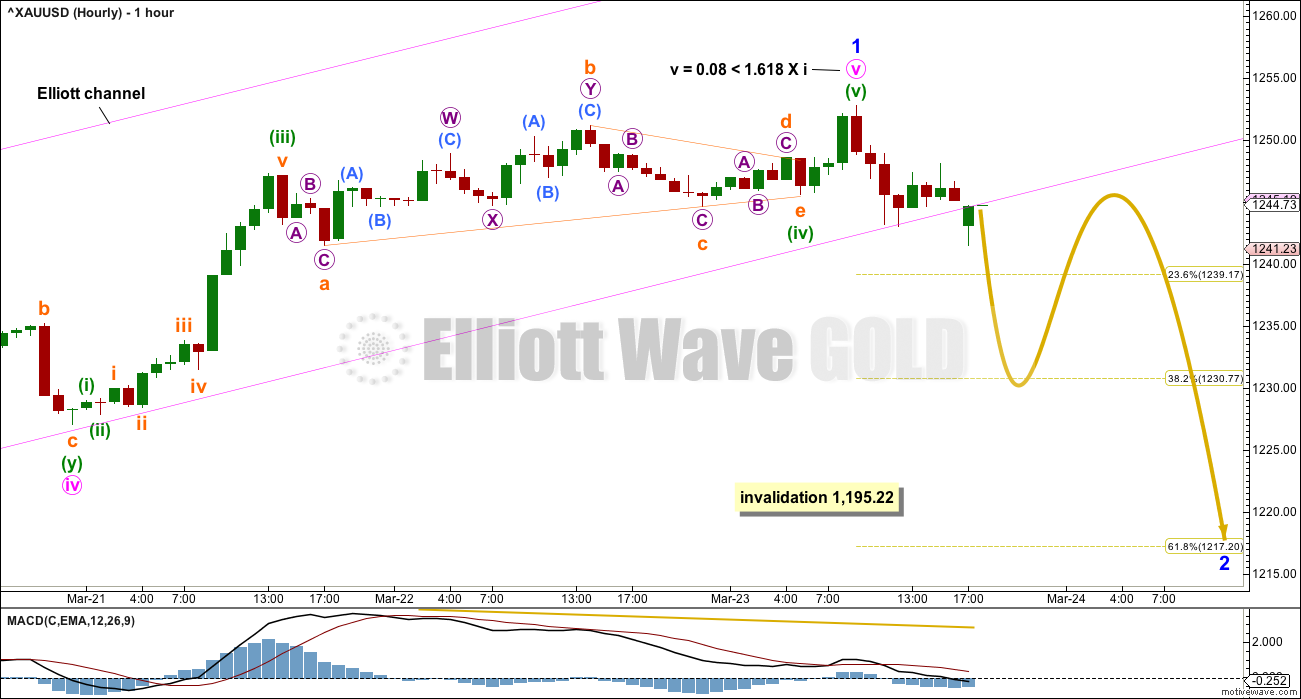
Price may be beginning to break below the lower edge of the Elliott channel. However, so far there is not a full hourly candlestick below and not touching the channel. It looks like price may be moving back into the channel, so this breach needs to be clearer for confidence in a trend change.
Minor wave 1 may have ended with a very slight new high. This improves the Fibonacci ratio within it, between minute waves v and i.
If it is over now, then minor wave 1 would have lasted 9 days. Considering the stage within the wave count with a large third wave up at two big degrees imminent, minor wave 2 may be more brief and shallow than second waves normally are. An expectation of a Fibonacci 3, 5 or 8 days looks reasonable.
Minor wave 2 may reach the 0.618 Fibonacci ratio of minor wave 1 about 1,217, or it may only end close to the 0.382 Fibonacci ratio about 1,231. If it reaches the 0.618 Fibonacci ratio, then price would remain well within the black base channel on the daily chart.
If minor wave 2 is deeper than expected, look for very strong support at the black base channel on the daily chart. This wave count does not expect that trend line to be breached at this stage.
While minor wave 2 may be any corrective structure except a triangle, it is most likely to be a zigzag. If it is an expanded flat or combination, it may include a new high above its start at 1,252.75. A new high short term does not necessarily mean that minor wave 2 is over; at this stage, it would most likely be part of minor wave 2.
ALTERNATE ELLIOTT WAVE COUNT
DAILY CHART
Click chart to enlarge.
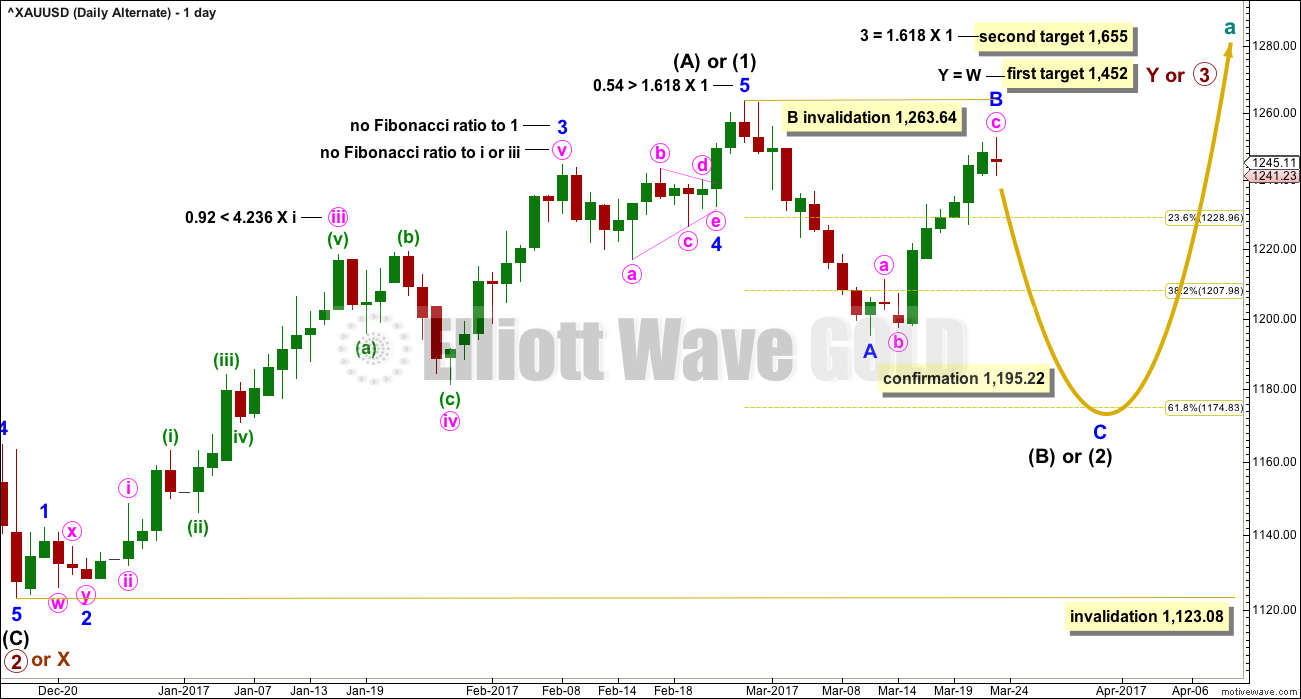
This alternate wave count is in response to queries from members.
Fibonacci ratios are noted on both daily charts, so that members may compare the main and alternate wave counts. This alternate wave count has slightly better Fibonacci ratios. This gives this wave count a reasonable probability. Due mostly to volume, this wave count is judged to have a lower probability than the main wave count.
At this stage, this wave count would be considered confirmed if price makes a new low below 1,195.22. At that stage, the target for intermediate wave (2) or (B) to end would be the 0.618 Fibonacci ratio of intermediate wave (1) or (A) at 1,175.
At the hourly chart level, this alternate wave count would now have to see the structure differently from the main wave count. Minor wave B must be a zigzag; it cannot be seen as an impulse. This is problematic because the upwards movement looks very strongly like a five on the hourly chart. This wave count would be forced now. The probability of it has further reduced.
TECHNICAL ANALYSIS
WEEKLY CHART
Click chart to enlarge. Chart courtesy of StockCharts.com.
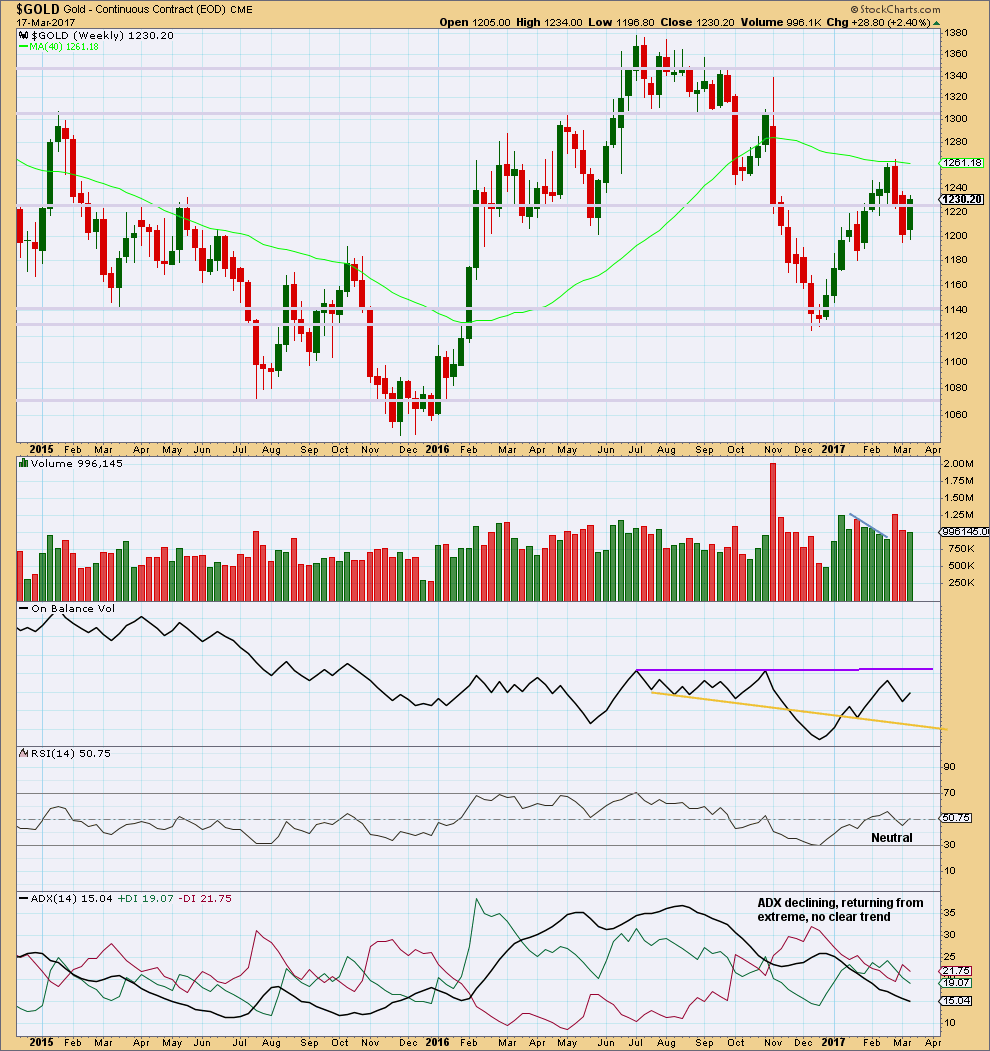
Last week completes an inside week with slightly lighter volume than the previous week. While the previous week saw falling price on declining volume, which pointed to an end to downwards movement, last week looks more like a correction within a downwards trend than a new upwards trend.
On Balance Volume has some distance to go before it would reach either resistance or support, so it is not giving any signal at this stage.
DAILY CHART
Click chart to enlarge. Chart courtesy of StockCharts.com.
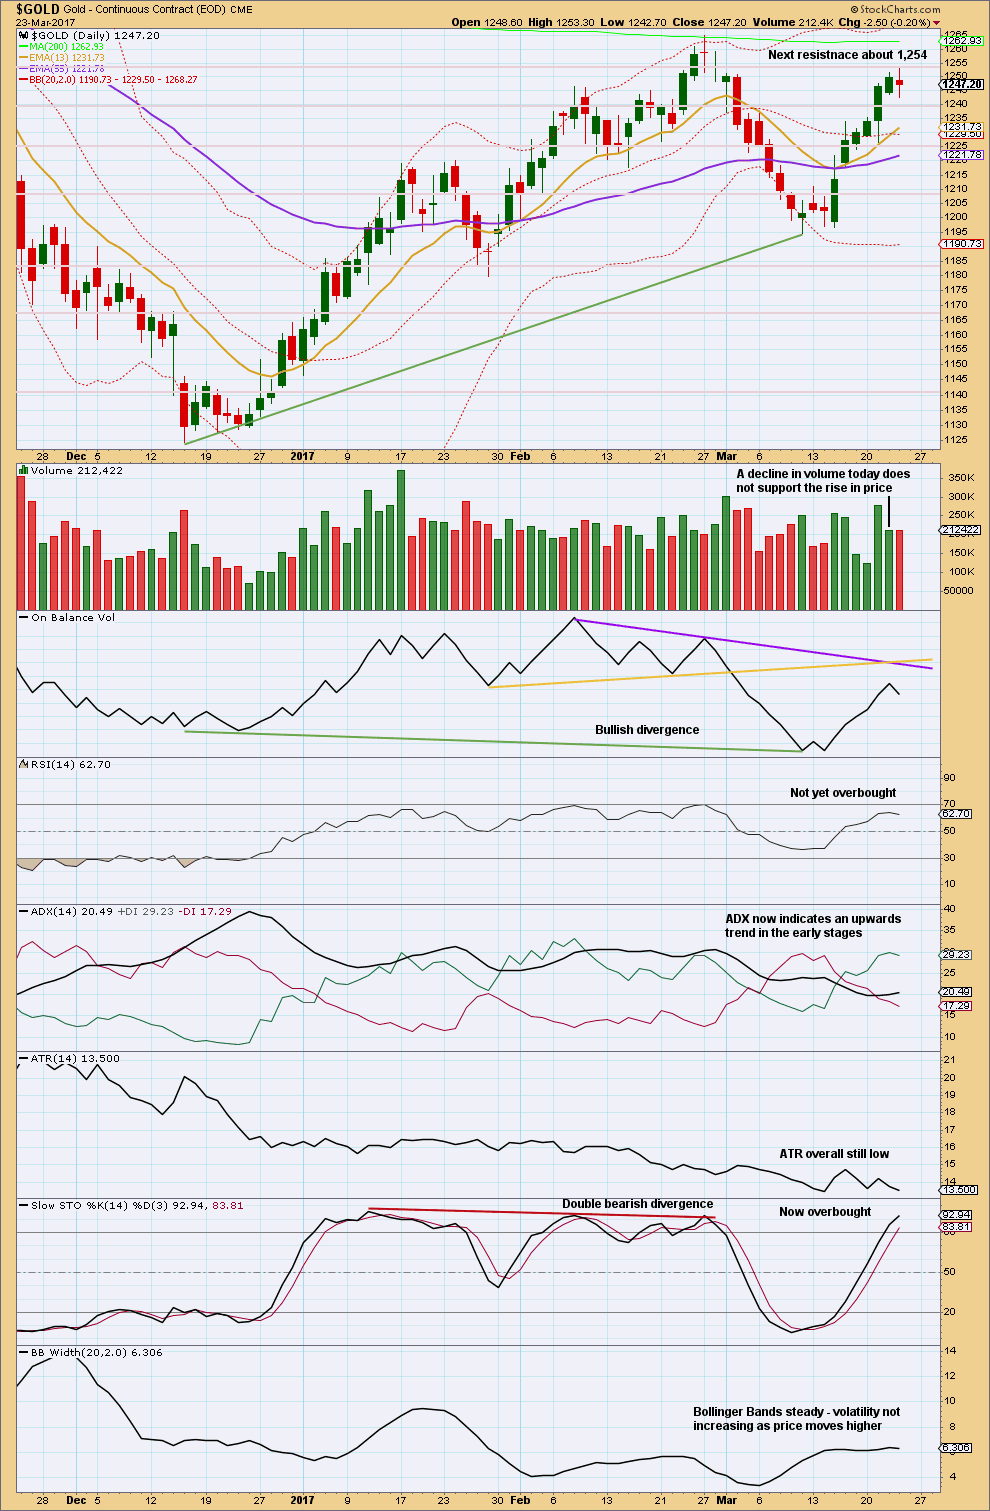
Price is finding resistance about 1,254, an area of prior strong support and resistance.
Today completes a red daily candlestick with a small real body. This is a spinning top candlestick and represents indecision, a balance between bulls and bears. The trend expectation is changed from up to neutral. The balance of volume was downwards and it shows a very slight increase beyond the prior upwards day, which is slightly bearish.
On Balance Volume is too far from resistance to give any signals today.
GDX
DAILY CHART
Click chart to enlarge. Chart courtesy of StockCharts.com.
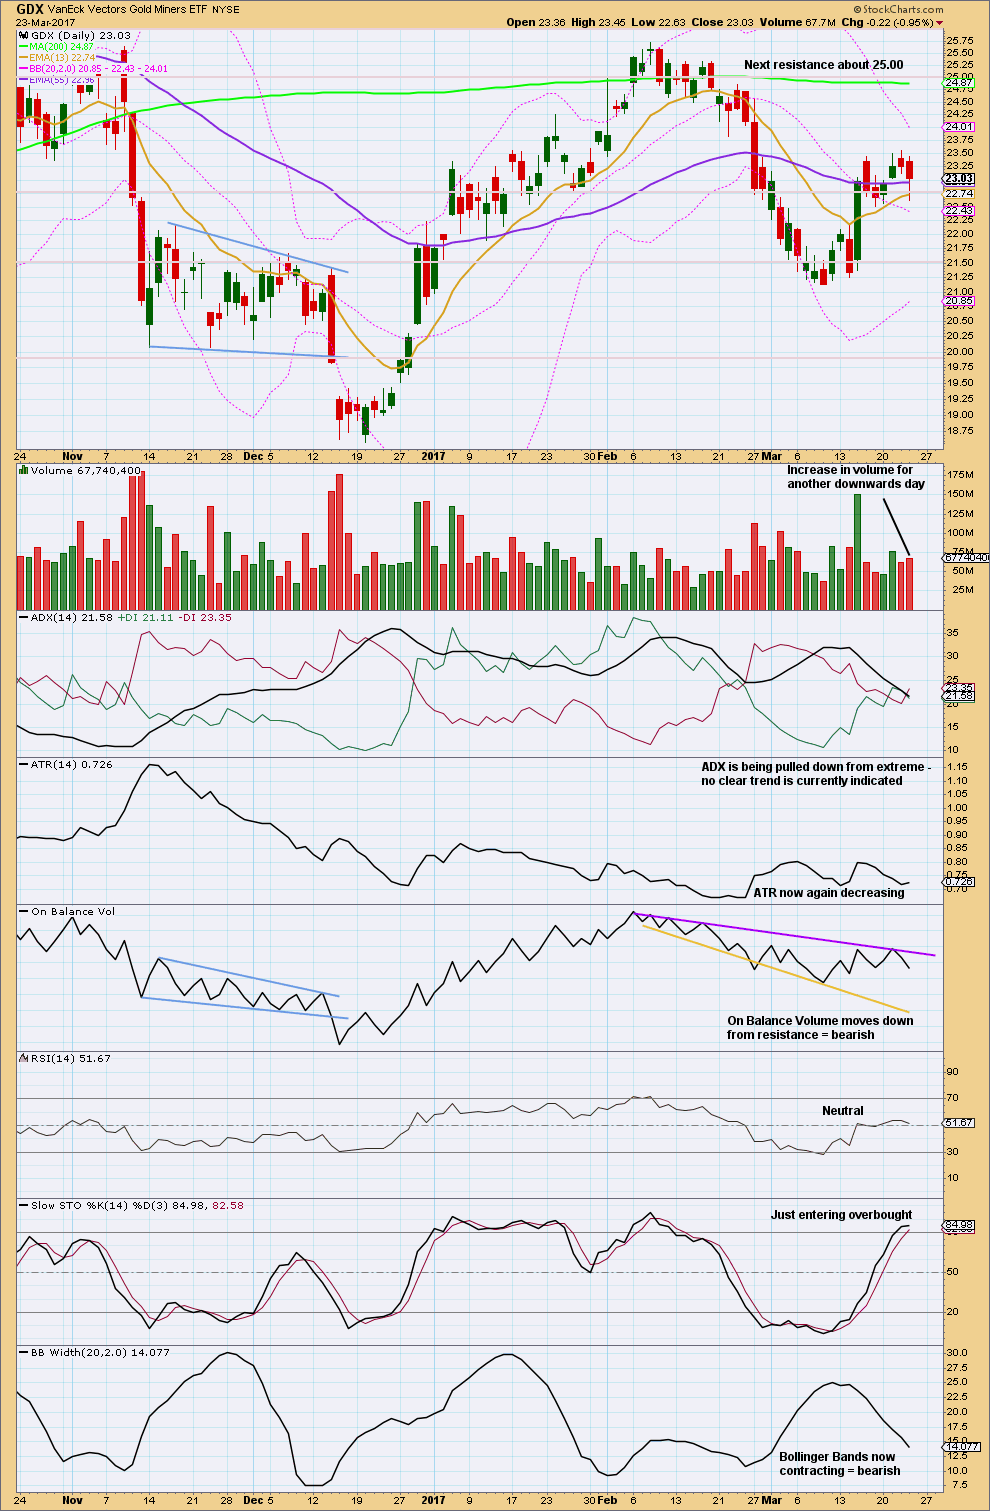
A downwards day from GDX has support from volume.
The long lower wick of today’s candlestick is bullish.
On Balance Volume has proven to be useful showing where price was likely to turn as it found resistance.
Overall, it looks reasonable to expect a deeper pullback for at least a few days here for GDX.
This analysis is published @ 07:47 p.m. EST.
Volume data now finalised (should be anyway) from Stockcharts shows lighter volume for today’s session, the balance of volume was up.
That looks like a typical B wave.
Miners couldn’t even close positive today. Another leg down next week.
Agreed. GDXJ in particular had what looked like a classic B wave up, before it went down ferociously the last 30 minutes before it closed in the red…
Gold is about to break 2nd inv HnS NL in 4 hour period????
https://www.tradingview.com/chart/mIsALpz4/
Dreamer you made me dangerous here??LOL!!
Great! Chart away and have fun 👍
It looks like at it’s end minor 2 may be very shallow. The 0.382 Fibonacci ratio may be a bit optimistic.
What does look most likely though is it’s not over yet folks. Even at this stage within a third wave up at two large degrees this second wave correction should show up on the daily chart to give intermediate wave (3) the right look. Second wave corrections for Gold usually take longer than it’s fourth waves, it’s not until we get into minor wave 4 that it may be very quick and shallow.
The only structure minor 2 cannot be is a triangle. That leaves zigzags, flats and combinations.
Within expanded flats and combinations the B or X wave may make a new price extreme beyond wave A or W. Psychologically this is very difficult to handle. Most traders and analysts will insist the correction is over and the next wave up has begun, right before wave C or Y takes off in the opposite direction.
The thing about B or X waves is they should exhibit internal weakness. They usually have lighter volume, and should exhibit divergence with multiple indicators. Lets examine this upwards movement with that in mind.
Repost
One of the reliable trend indicator for gold and silver is gold to silver ratio (GSR). In 4 hour period it has turned down and broken below the trend line at 70.70. If the ratio continues down to 68 expect gold price to head up from here.
https://www.tradingview.com/chart/mIsALpz4/
The attached weekly chart shows a break down below 70 may be repeat of 2010-2011.
Any ideas on silver?
Sister Silver is leading Gold price up and should hit 17.79+ imo. GL
The RSI on the 4-hourly is a real pain; wont let price grow once it starts to hit 70 plus; good chance still though for Gold price to break through 1251-53…. what if the health care bill is passed, what if it is not…. I guess prices will be all over the place lol….
It is nothing it is noise. Days of real moves are 1 or 2 %!
Small potatoes…5% move days are coming…. 🙂
Looks like it’s going to break through channel; watching.
Lara
Gold movement was not digestable for me.
Was it a fake channel breach and we are still in wave 5 of minor 1..?
Or
May be the quick 3wave down was Wave A and the upmove we are seeing after todays low is Wave B and we can see an expanded flat minor 2..?
It is digestible for you. You’ve correctly noted minor 2 may be a flat correction.
These are very common structures.
Lolzz.
I was holding a nice short position which i opened yesterday. But i had to cover it at cost. Bad trade.
Now how can i digest this move.😁😁
Don’t try to trade small counter trend movements?
It’s often the trades you don’t take which make the difference between profit and loss. Exerting patience and waiting for the right trade set up may see more profits.
If you covered and have no loss then that’s not a bad trade at all, it’s a lesson learned at zero cost. Look at it that way.
Yes you are right. I will keep it in mind
Bounced off of the top of possible newer hourly channel, bear.
This looks a very weird wave 2, I guess we could still be going up in a fifth!
ZZZZZZZZ!!
Here can we assume that the channel breach is satisfactory..?
Yes. It looks satisfactory to me.
Okiess…thanks
Maybe Mick Jagger can help…! 😀
GDX
https://www.tradingview.com/x/qE3CKjel/
Dreamer Nice chart.
How to save image from tradingview chart platform?
I see two Inv HnS in 4 hour period. The current RS is around 1235. Just below is the first NL of inv HnS.
If the second one confirmed than I do not see how gold can correct to 1217???
Just click on the camera icon at the bottom of the chart. Then you can copy a link to post and/or you can save a copy of the chart to post on EWG.
Thanks.
Dreamer, it was interesting to see how GDX bounced up from 22.63, which is exactly the 0.38 retracement from 23.56 high of minor 1 notes on your chart yesterday.
Do you think that was end of minuette (a) of minute a of minor 2?
Hey Ari, at this point, I think Minor 2 for GDX is likely to be a Zig-Zag or a Double Zig-Zag. I’d rather wait and see more structure before labeling the move down. The trend is down for now and the correction is likely to get down near the .618 Fib @ 22.06.
Thanx Dreamer.
Lara,
If you could post an hourly chart for oil to see subdivisions down. TIA
I don’t have an hourly count for Oil, only daily and weekly. And I only publish Oil once a week, unless I include it now in Trading Room.
So far it would have two overlapping first and second waves down.
I know that’s now what you want to hear. But when I trade I don’t always keep a wave count at time frames lower than daily. I do look and give it a quick visual check for threes and fives, but I don’t want to get bogged down in the small detail. I find it puts me off more often.
TBH I am a bit concerned with the choppy aspect of Oil’s decline these last few days. I’m wanting to see it put in a big fat red candlestick, otherwise I may be out.
I’ve moved my stop to just below breakeven. If you’ve got a positive position I would recommend you consider doing that too, depending on where you entered.
“unless I include it now in Trading Room”
Lara thanks, no need for this as you have a daily chart from yesterday there.
Lara, how do you count days for a wave?
I’m assuming that you count the bottom candle, but not the top in an up wave and then a top candle and not the bottom in a down wave. Is that correct or?
Any other tips?
Just curious and want to be consistent with your methodology. Thanks,
Motive wave does it for me 🙂
But yeah, if counting manually then for an upwards wave I’d count the first candle after the bottom, I wouldn’t count the bottom. I would however count the top candle.
For a downwards wave I’d count the first candle after the top to the bottom candle.
Otherwise candles at highs and lows would be counted as 1 day for the upwards wave and 1 day for the downwards, so they’d be counted twice. Which would yield durations longer than reality in total.
A very good question Dreamer. And my approach isn’t necessarily the only one, nor the right one.
OK. Thanks.