
Price continued lower as the two preferred hourly wave counts expected.
Summary: The bottom line for the short term is that while price remains within the channels on the hourly charts expect it to continue to fall. Each time price touches the upper edge of the channels represents an opportunity to join the short term downwards trend, but this is only for more aggressive risk tolerant traders.
This trend may end in one more day. Look out for the possibility of a selling climax. If that happens, take profits on short positions.
If price breaks above the upper edge of the hourly chart channels (with upwards not sideways movement), exit short positions. The downwards trend may be over.
The target remains at 1,197 – 1,192, it is now very close.
New updates to this analysis are in bold.
Last monthly and weekly charts are here. Last historic analysis video is here.
Grand SuperCycle analysis is here.
MAIN ELLIOTT WAVE COUNT
DAILY CHART
Click chart to enlarge.
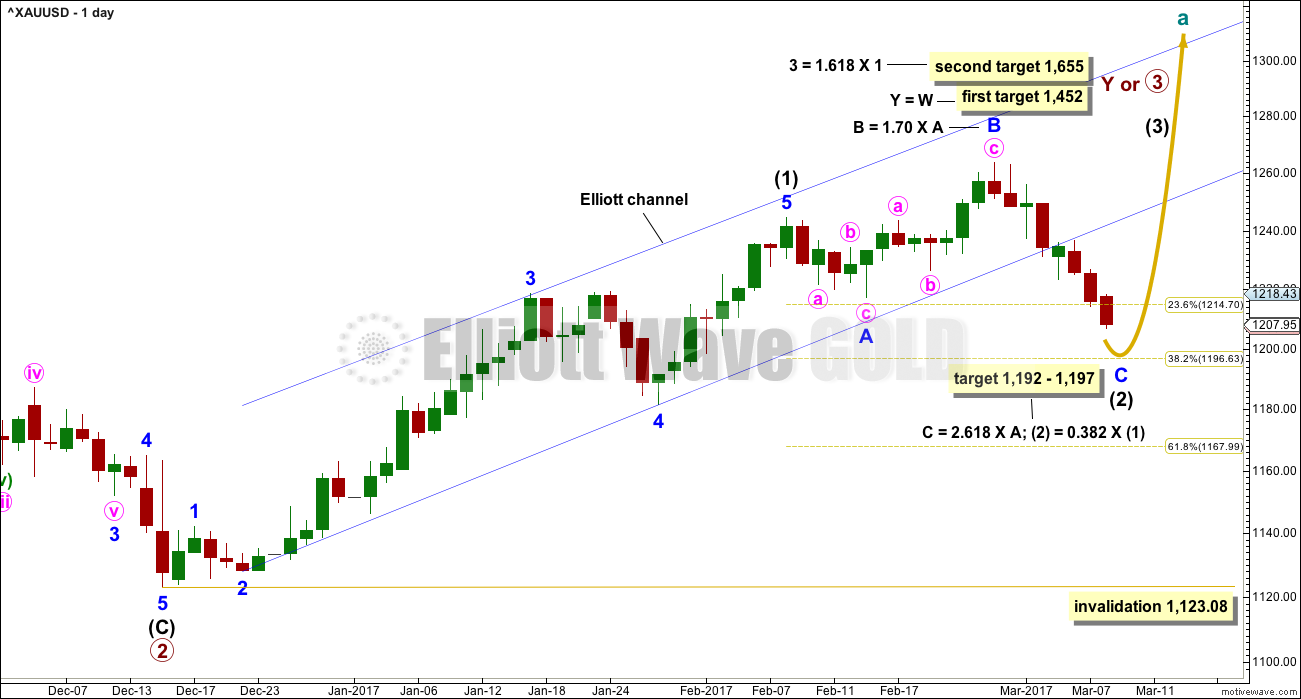
Intermediate wave (1) is a complete five wave impulse lasting 39 days. Intermediate wave (2) so far looks like an expanded flat, which is a very common structure. The most likely point for it to end would be close to the 0.618 Fibonacci ratio of intermediate wave (1) at 1,197. This is also close to where minor wave C would reach the most common Fibonacci ratio to minor wave A at 1,192, so this target zone has a good probability.
Minor wave C must subdivide as a five wave structure. It would be extremely likely to make at least a slight new low below the end of minor wave A at 1,217.05 to avoid a truncation and a very rare running flat.
So far intermediate wave (2) has lasted 20 sessions. The structure is almost complete and looks like a very typical expanded flat. If it ends in just one more session, it may total a Fibonacci 21.
Intermediate wave (2) may not move beyond the start of intermediate wave (1) below 1,123.08.
At this stage, there are multiple ways to see the subdivisions of minor wave C downwards at the hourly chart level. Below are just two possibilities. The wave count presented yesterday that saw a deep bounce for a second wave is now discarded based upon a very low probability.
If this wave count is correct, then at its end minor wave C will provide a very good opportunity to join the longer term upwards trend.
FIRST HOURLY CHART
Click chart to enlarge.
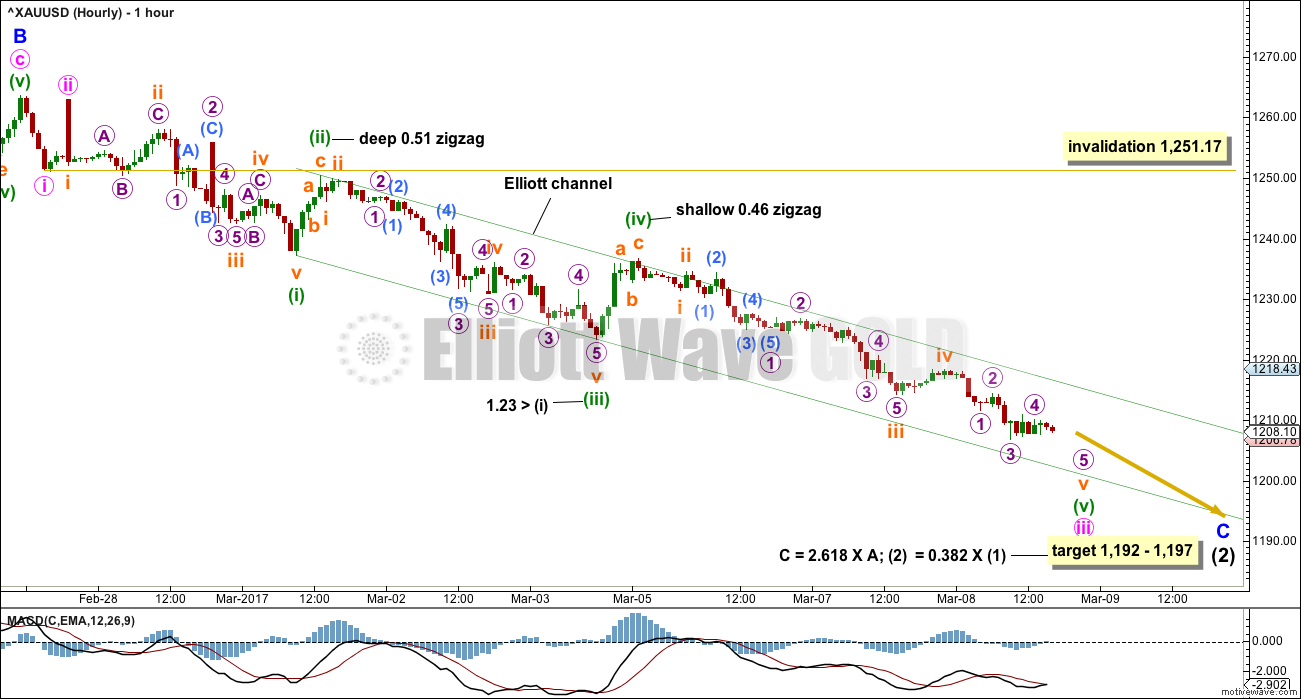
Minor wave C must subdivide as a five wave structure. It is an almost completed impulse.
Minute wave iii is seen still as incomplete.
Minute wave iii may only subdivide as an impulse. It is common for Gold to exhibit very strong extended fifth waves within its third wave impulses. Look out for minuette wave (v) to be very strong, possibly ending with a selling climax. It is possible that the target zone may be too high if minuette wave (v) is very strong.
There is still weakness to downwards movement with MACD showing weaker momentum, but support from volume yesterday improves the probability of this wave count.
If this wave count is right, then each time the upper edge of the channel is touched represents an opportunity to join the short term downwards trend.
SECOND HOURLY CHART
Click chart to enlarge.
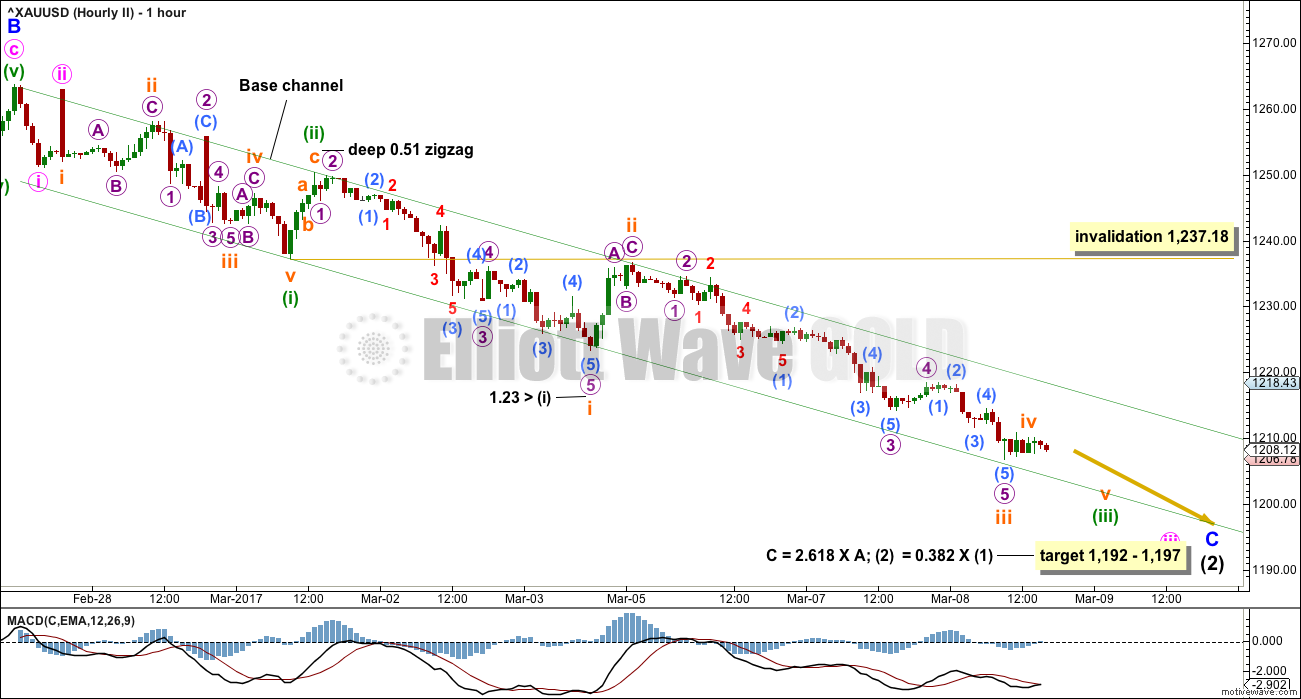
This wave count was the third idea presented yesterday. Now it is the second.
This wave count has a slightly lower probability than the first. It expects the extension within minor wave C is the third wave. It is common for Gold to exhibit extended fifth waves. Both possibilities should be considered.
However, it makes almost no difference still to how the channel is drawn. It makes no difference to the target and no difference to the expected direction.
Use the channels on these hourly charts for an indication of when minor wave C is over. When the channels are breached by upwards movement (not sideways) that shall be the earliest indication that minor wave C is likely to be over, so intermediate wave (2) in its entirety is likely to be over.
The next wave up for Gold may be a third wave at two large degrees, an excellent buying opportunity, if the daily wave count is correct.
TECHNICAL ANALYSIS
WEEKLY CHART
Click chart to enlarge. Chart courtesy of StockCharts.com.
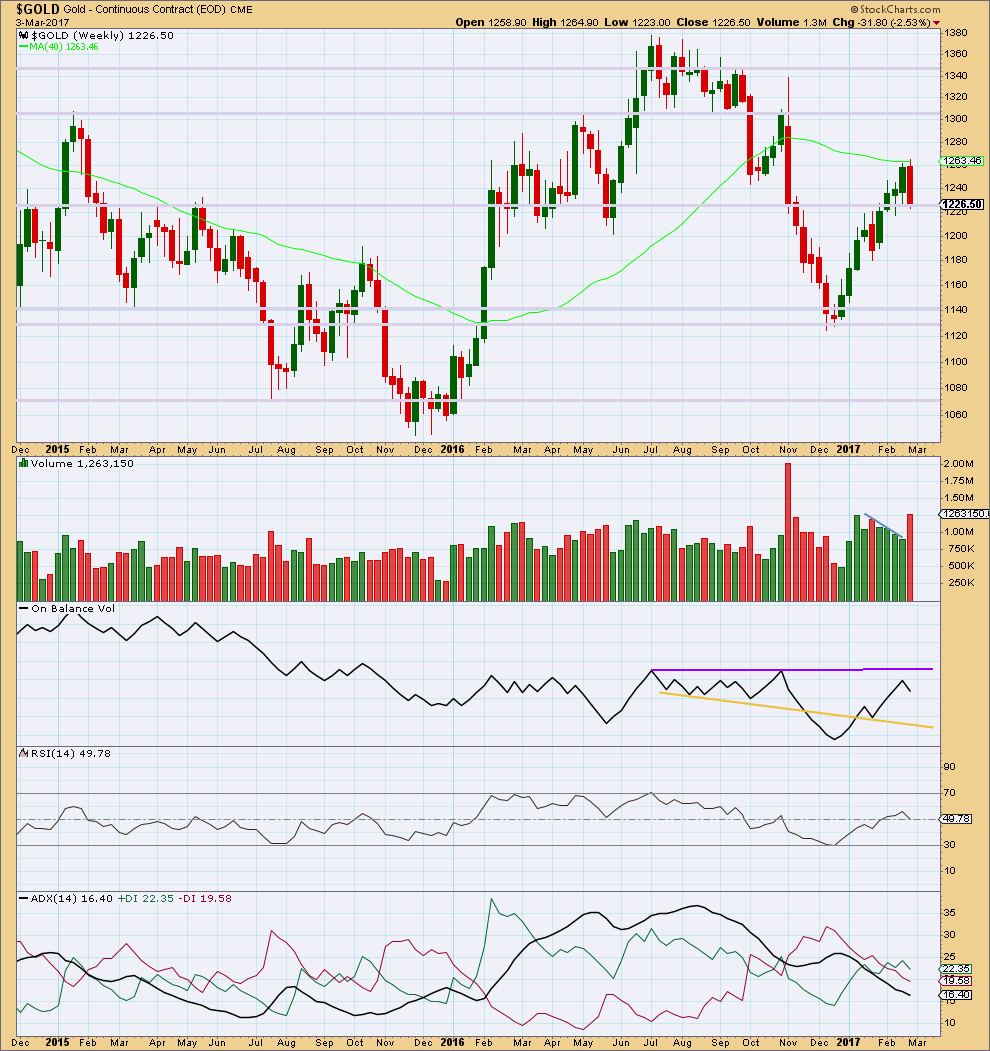
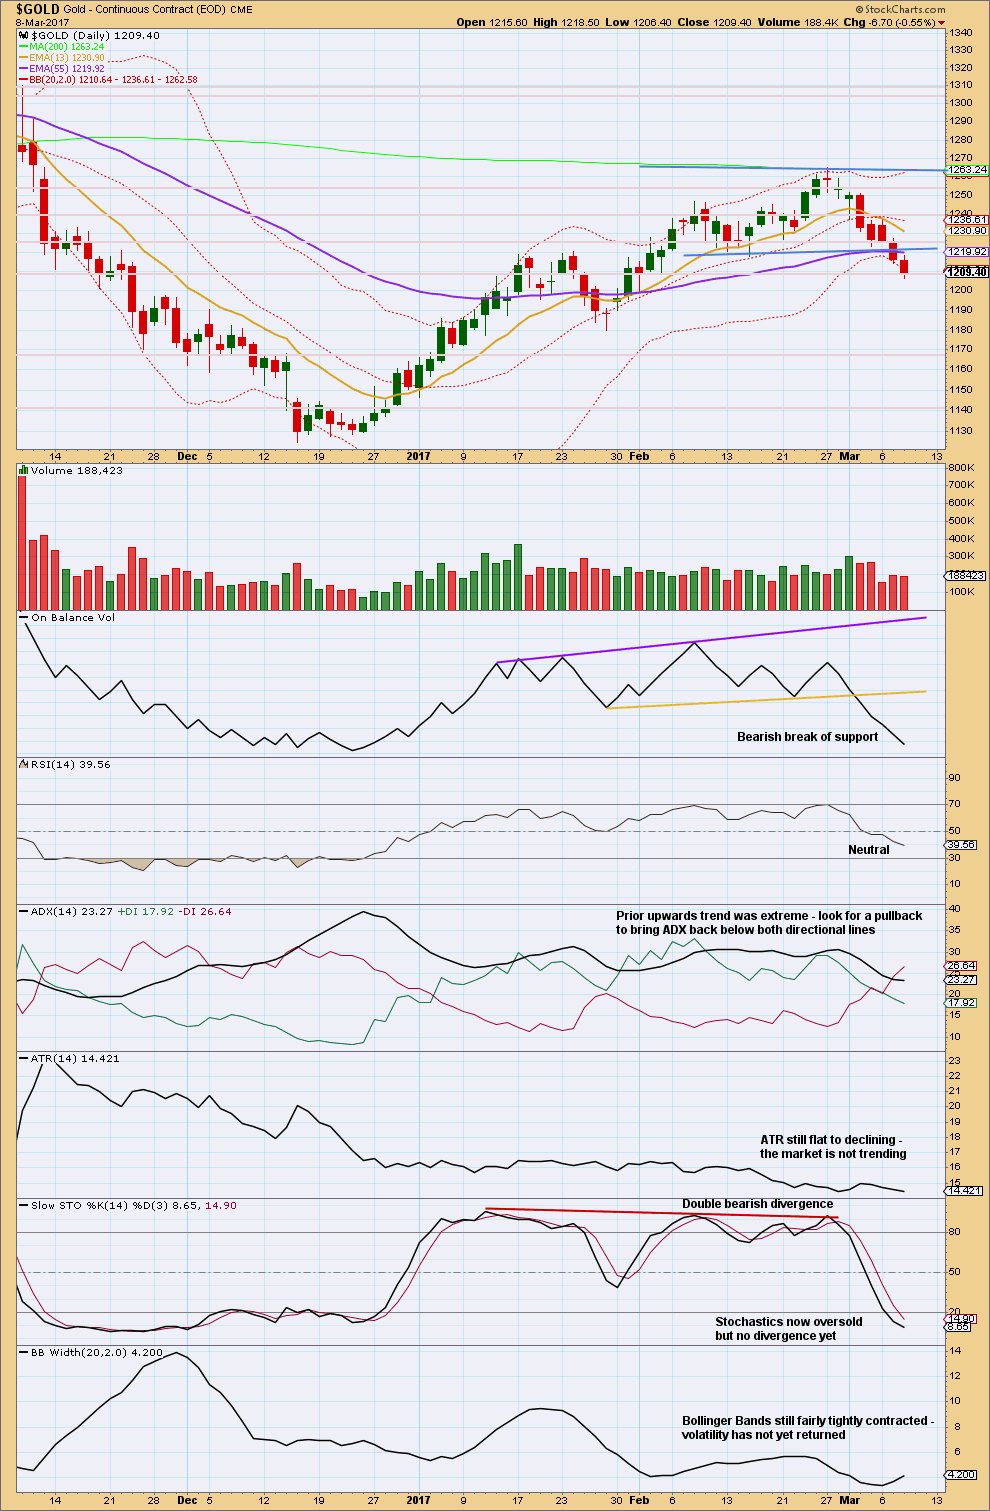
The prior four upwards weeks are all green and showed a decline in volume. Now last week is red and shows a strong increase in volume. Last weekly candlestick completes a bearish engulfing candlestick pattern, the most reliable reversal pattern.
This indicates strongly that upwards movement is over for now. Either sideways or downwards movement from here is a reasonable expectation.
On Balance Volume has still not found resistance.
ADX still indicates the market is not yet trending at the weekly time frame.
DAILY CHART
Click chart to enlarge. Chart courtesy of StockCharts.com.
A slight decline in volume today shows less support for downwards movement. Price has found support about 1,208.
ADX is now below one directional line and has been brought down from extreme, well above 35, to within the low 20’s now. A little more downwards movement may bring ADX lower.
There is still a little room for price to fall further. Next support may be about 1,180.
GDX
DAILY CHART
Click chart to enlarge. Chart courtesy of StockCharts.com.
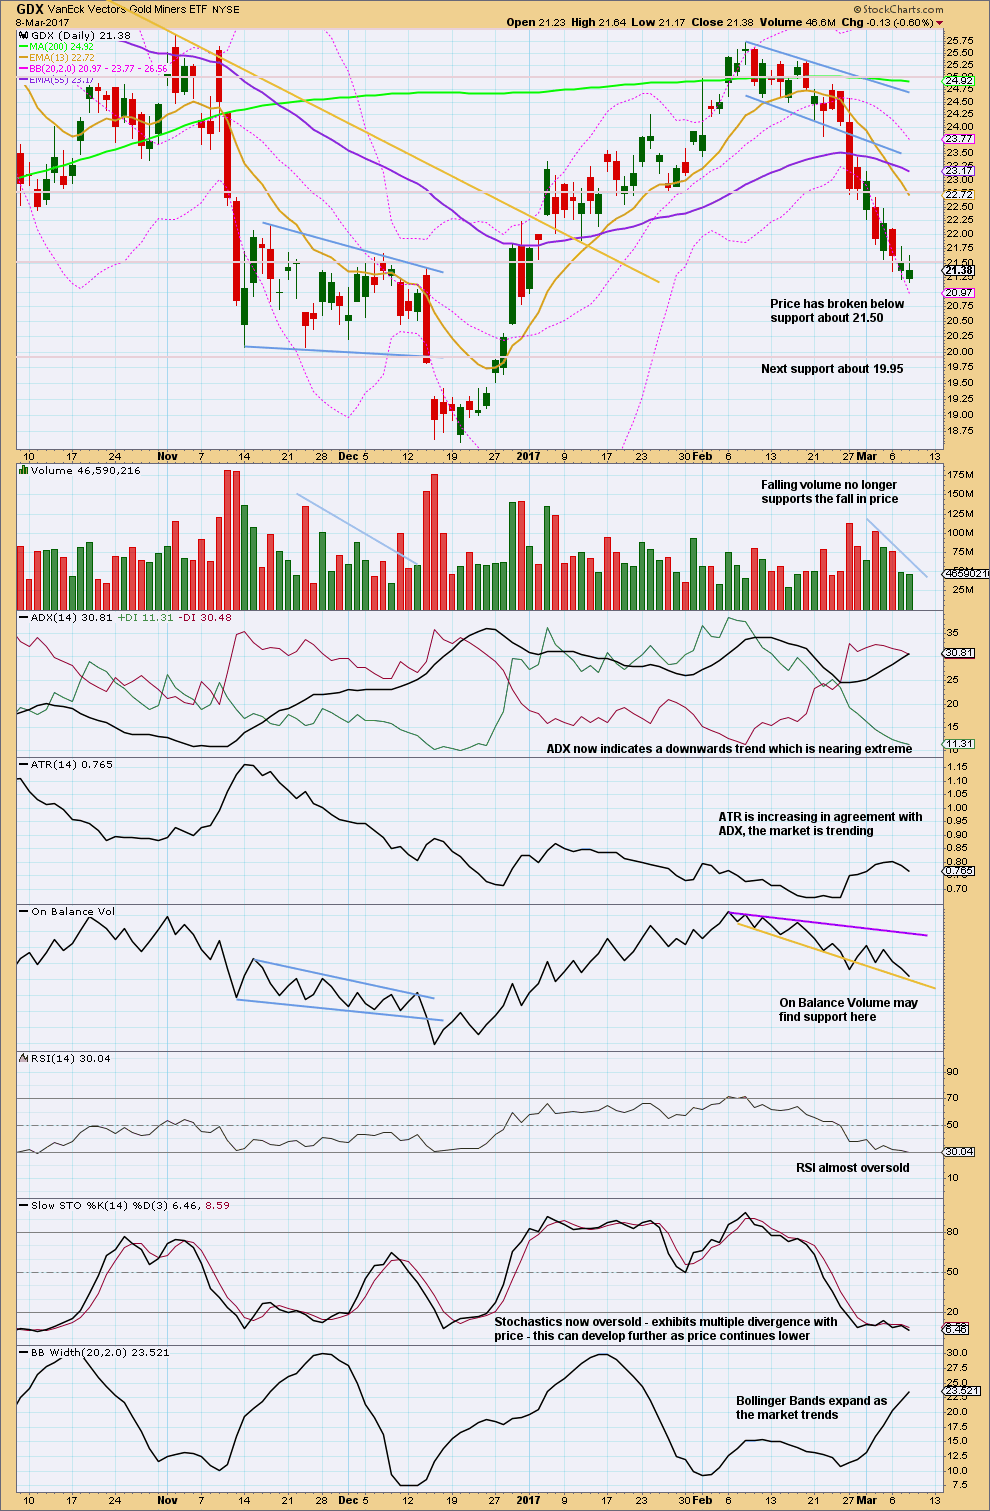
Price has broken below support. Look now for next support about 19.95.
The longer upper wicks on the last two daily candlesticks are slightly bearish.
Support here for On Balance Volume may halt the fall in price. If OBV breaks below the yellow line, it would offer a weak bearish signal.
There is still a little room for price to fall here.
This analysis is published @ 09:05 p.m. EST.
Lara, will you be doing another trading room soon? If so, please include natural gas. It’s only 1 cent below $3. Thank you, for everything that you do for us.
Dermot asked a question yesterday about a very bearish wave count.
There is one Dermot, it’s in the historic analysis.
I’ll update the weekly charts today to show you.
The bottom MAY be in for GDX. Looks like an ending diagonal may be complete. Need a channel breach for confirmation.
At 1,196 minute v would = minute i in length.
Favour the upper end of the target zone now, it would see Fibonacci ratios at minute and intermediate degrees.
The bottom line still is the channel needs to be breached before we have any evidence at all that this is over. While price remains within the channel allow for the possibility that price could still fall.
Members holding shorts may choose to exit if the target is hit, or as Verne suggests exit a portion there and hold the balance.
Short positions should be exited if the channel is breached by upwards movement.
When we have end of session data I’ll have a clearer idea of how much longer and further this may go. Looking at some indicators now on the hourly chart it isn’t showing much weakness yet, so if you have shorts hold on for at least a little longer.
Anyone else noticing that the new lows in gold/silver are not corresponding to new lows in miners. Of course the miners were much more oversold also. But although the miners are not taking off to the upside, they’re not making new lows either…
There is some divergence here.
I am a bit conflicted about what to do about my hedges which are showing a nice profit. I think we are close to a bottom but I still would like to see that 13 day SMA flatten out a bit. I have to keep reminding myself that the primary purpose of a hedge is not necessarily to make a profit, but to protect a position and it cannot continue to do that if you cash it it. Hanging tight. 🙂
That is true. But you have to consider how close we are to Lara’s targets, and the fact that RSI today for GDX is less than 30… and the 100 day moving average will provide at least some support. It just looks like we’ll get some sort of bounce here at least, even if we go lower a bit after that IMO.
But I’m not about to start giving you opinions here Verne 🙂 you’re the pro here for sure.
Two heads are better than one! I greatly appreciate the feedback Ari.
Unloaded balf… 🙂
Money management question: When it comes to ending waves (and people with jobs other than trading and can’t watch) is it best to set target prices, move stop loss to just above 1 hour channel, last support/structure? I currently have great profits. Usually scalp but have held this short for a while and don’t want to lose profits or exit too soon.
My approach is to always have a profit target when I enter a trade. That in turn will depend on whether it is a short, intermediate, or long term trade. When profits hit your target, the very least you should do is recover your initial investment and if you think the trade has more potential you can trade with “house money” after adjusting your stop.
Hourly chart adx is above 45..
Does hourly chart technicals matters..?
No.
GDX has moved mostly sideways for the last two days as Gold has moved lower. This divergence suggests that the correction is nearing it’s end.
The channel is running out of room for more sideways movement. An upward or downward breakout is likely for tomorrow. I think a downward break is more likely. The correction may end in another 1 or 2 days.
https://www.tradingview.com/x/2OD02WUn/
I recently saw a chart that has Silver down in a five wave impulse considered only the A wave of an unfolding abc corrrection. If that is the case, we still have a B then a C wave to go. I am looking at possible alternatives because of that 13/50 daily SMA cross for the miners. 13 still pointing down and should be starting to flatten ahead of an impending turn.
Silver looks like a zigzag 5-3-5 correction to me.
Things are really oversold so I too have some doubts about that count. I am still a bit concerned about the moving averages in the miners. I was hoping for a green print today but so far no cigar…