
Last week expected a pullback to begin for Silver either at the high for the 23rd of March, or very soon. This is not what has happened. Price has continued to move higher.
Summary: Identifying when a pullback is going to begin for Silver has proven to be very difficult. But this does not mean it should now be expected that it will not happen, because it may have begun as a small expanded flat that may end in another one to three days, about 17.684.
New updates to this analysis are in bold.
Last monthly chart is here.
ELLIOTT WAVE COUNT
WEEKLY CHART
Click chart to enlarge.
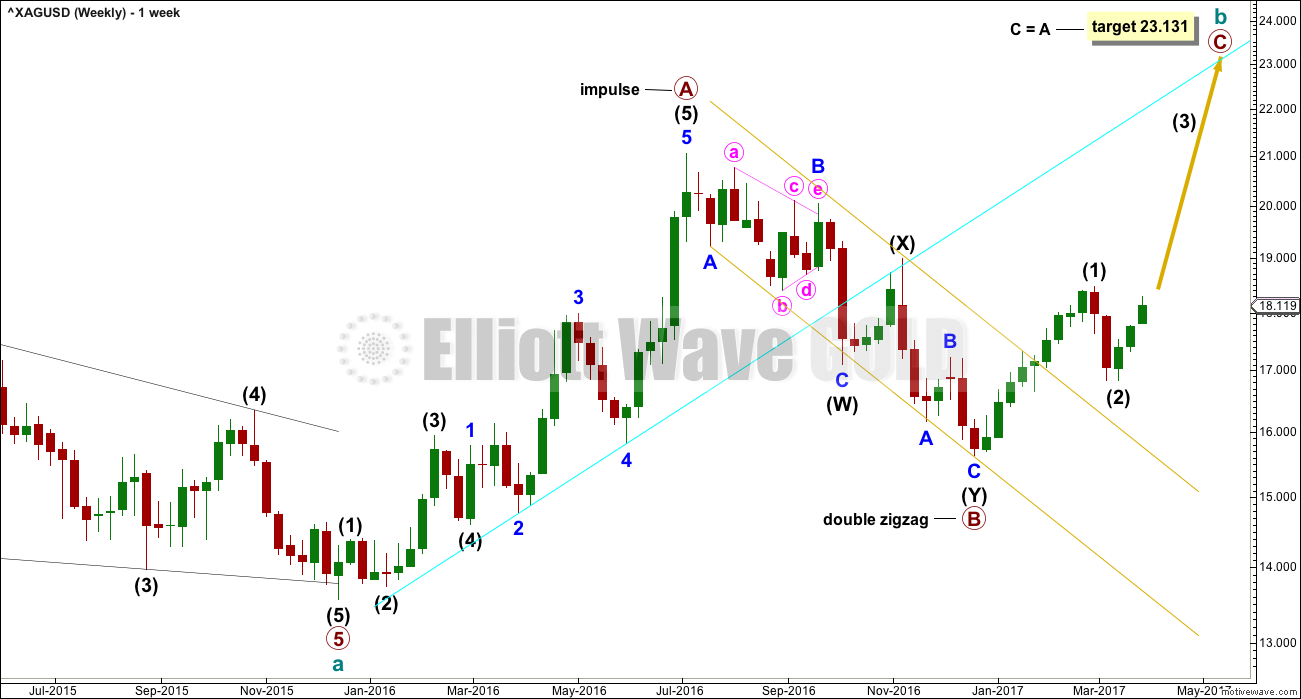
Upwards movement labelled primary wave A fits perfectly as an impulse.
Primary wave B fits as a deep double zigzag. Primary wave C must subdivide as a five wave structure. The target expects it to reach the most common Fibonacci ratio to primary wave A.
Primary wave A lasted 29 weeks. Primary wave B lasted 24 weeks. These waves are in proportion. However, B waves can be very long lasting, so it is important to consider alternates. An alternate is provided at the daily chart level.
DAILY CHART
Click chart to enlarge.
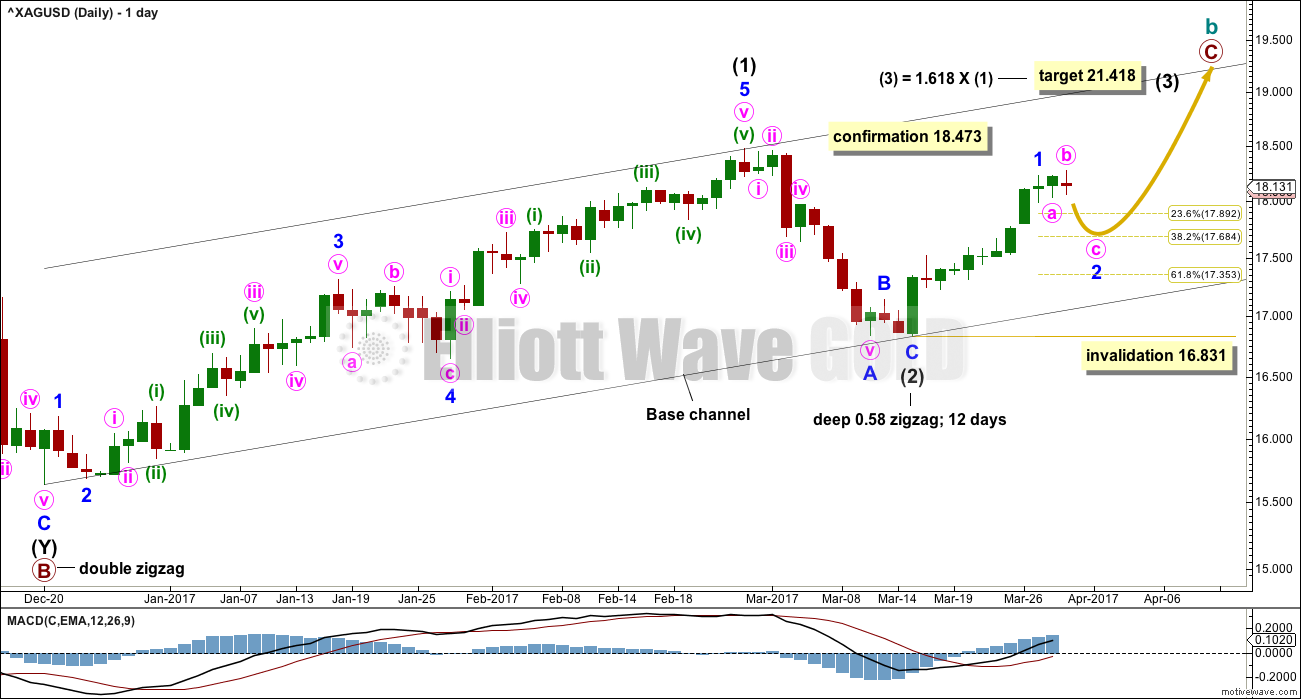
Intermediate wave (2) now looks complete as a zigzag, close to the 0.618 Fibonacci ratio of intermediate wave (1).
A new high above 18.473 would invalidate the alternate below and provide confirmation of this main wave count. At that stage, intermediate wave (3) would also have moved beyond the end of intermediate wave (1) meeting the Elliott wave rule.
Within intermediate wave (3), no second wave correction may move beyond the start of its first wave below 16.831.
It is possible this week to see a complete five wave impulse at the hourly chart level for minor wave 1. Minor wave 2 may have begun as a flat correction. At this stage, within intermediate wave (3), the upwards pull of the middle of a big third wave may be strong enough to force minor wave 2 to be more brief and shallow than second waves normally are.
Lower degree corrections should now find support at the lower edge of the base channel.
ALTERNATE DAILY CHART
Click chart to enlarge.
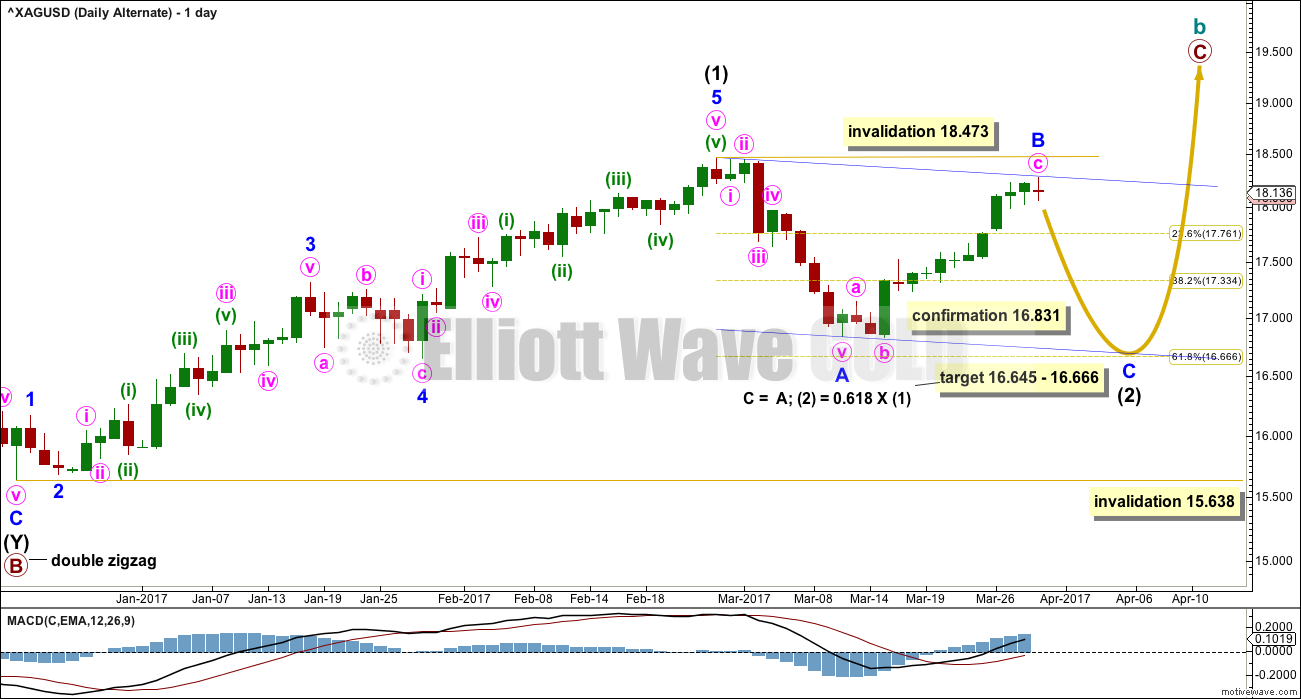
What if intermediate wave (2) is not over?
Minor wave A will fit as a five and minor wave B fits as a regular flat correction. However, regular flats normally have C waves which are about even in length with their A waves and they normally fit neatly within a small channel. This one has a remarkably long C wave, so this substantially reduces the probability of this wave count this week.
The target is recalculated again this week for intermediate wave (2) to end.
Intermediate wave (2) may not move beyond the start of intermediate wave (1) below 15.638.
TECHNICAL ANALYSIS
WEEKLY CHART
Click chart to enlarge. Chart courtesy of StockCharts.com.
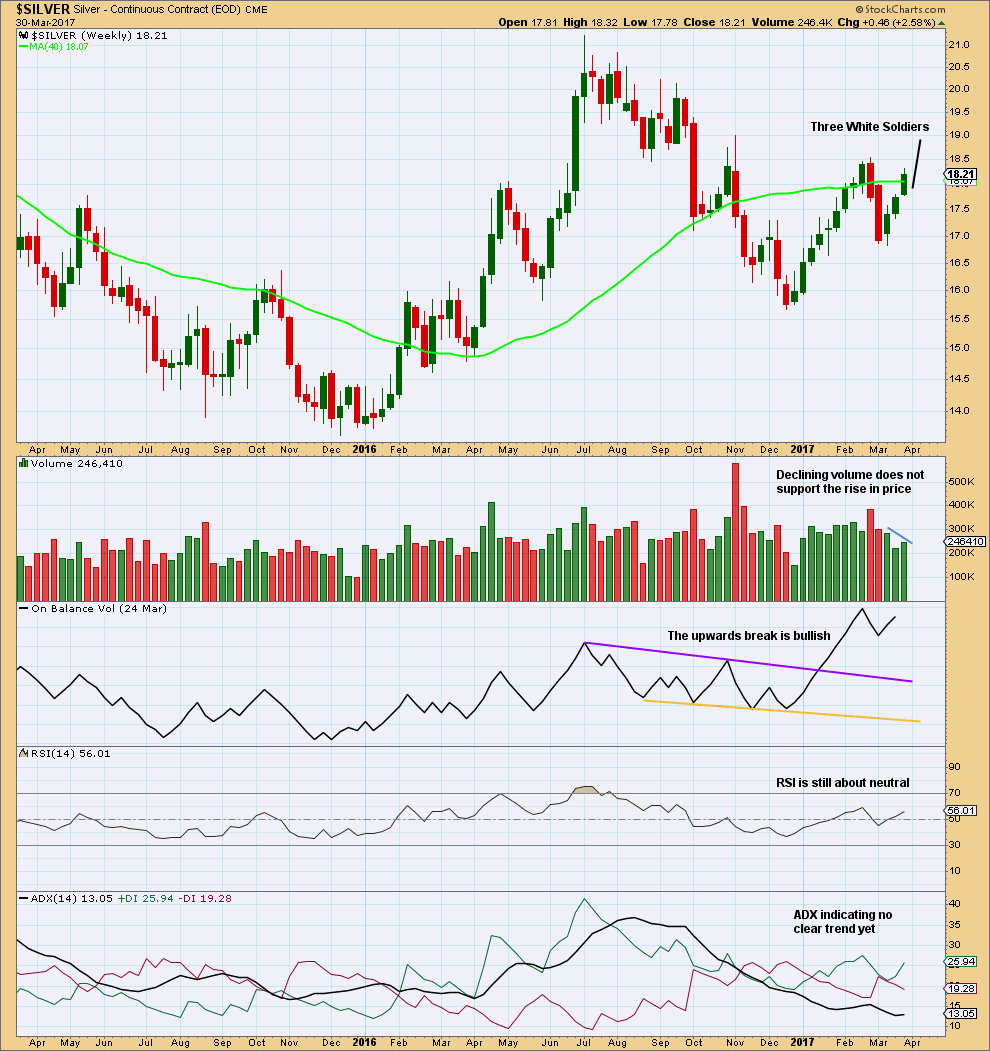
The last three green weekly candlesticks complete a bullish candlestick pattern, Advancing Three White Soldiers. This supports the main Elliott wave count over the alternate.
Slightly declining volume may be resolved by a pullback here at the daily chart level, and maybe at the weekly chart level.
DAILY CHART
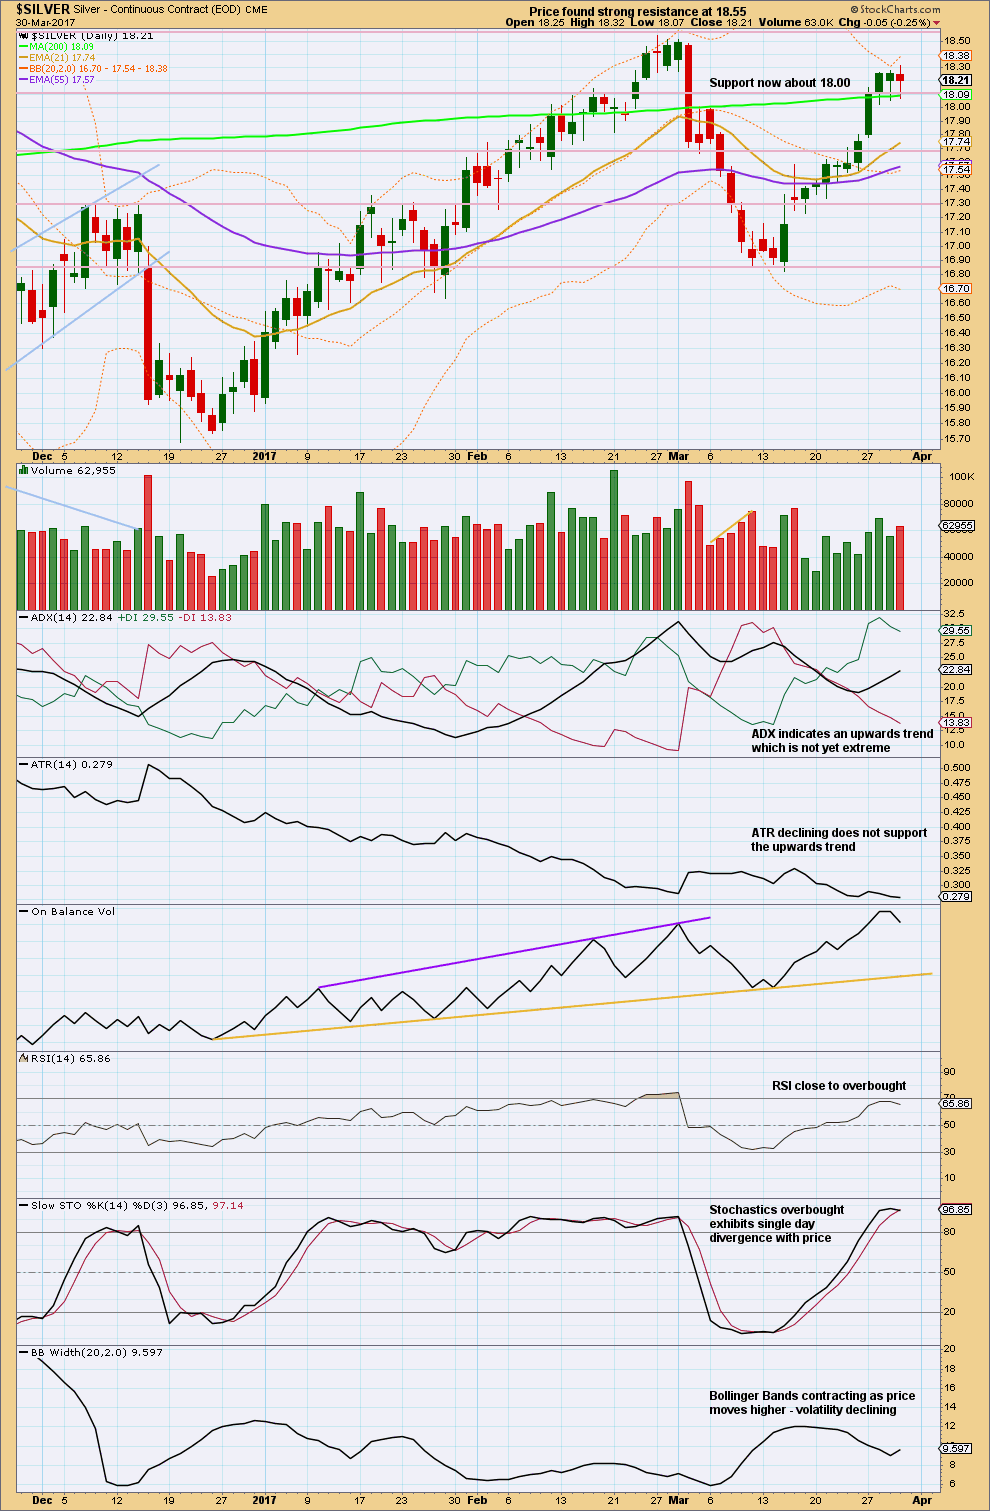
Click chart to enlarge. Chart courtesy of StockCharts.com.
The Dragonfly Doji noted last week was not followed by any downwards movement. Price has continued higher.
18.00 is an area of strong prior support and resistance. Now price is above it, so this point may offer some support.
The candlestick of the 29th looks like a Hanging Man. Coming after an uptrend, this is bearish. But the bullishness inherent in it (the long lower wick) means it requires confirmation, and the red daily candlestick of the 30th provides that confirmation.
A little more confidence is had that a small pullback or a sideways consolidation may unfold here.
The 30th of March moved price higher with a higher high and a higher low, but the candlestick closed red. The balance of volume during this session was downwards and it shows an increase. There was support for downwards movement during this session, so this is bearish.
ADX and ATR do not agree. This is concerning for bulls.
Stochastics today indicates a pullback or consolidation may develop here.
This analysis is published @ 09:15 p.m. EST.