
Silver has continued lower over the last few days as expected from last week’s analysis. The target remains the same.
Summary: A deeper pullback may be close to complete now. The target is about 16.666. If the Elliott wave count is correct, then this pullback at its end presents an opportunity to join the larger upwards trend at a good price.
New updates to this analysis are in bold.
Last monthly chart is here.
ELLIOTT WAVE COUNT
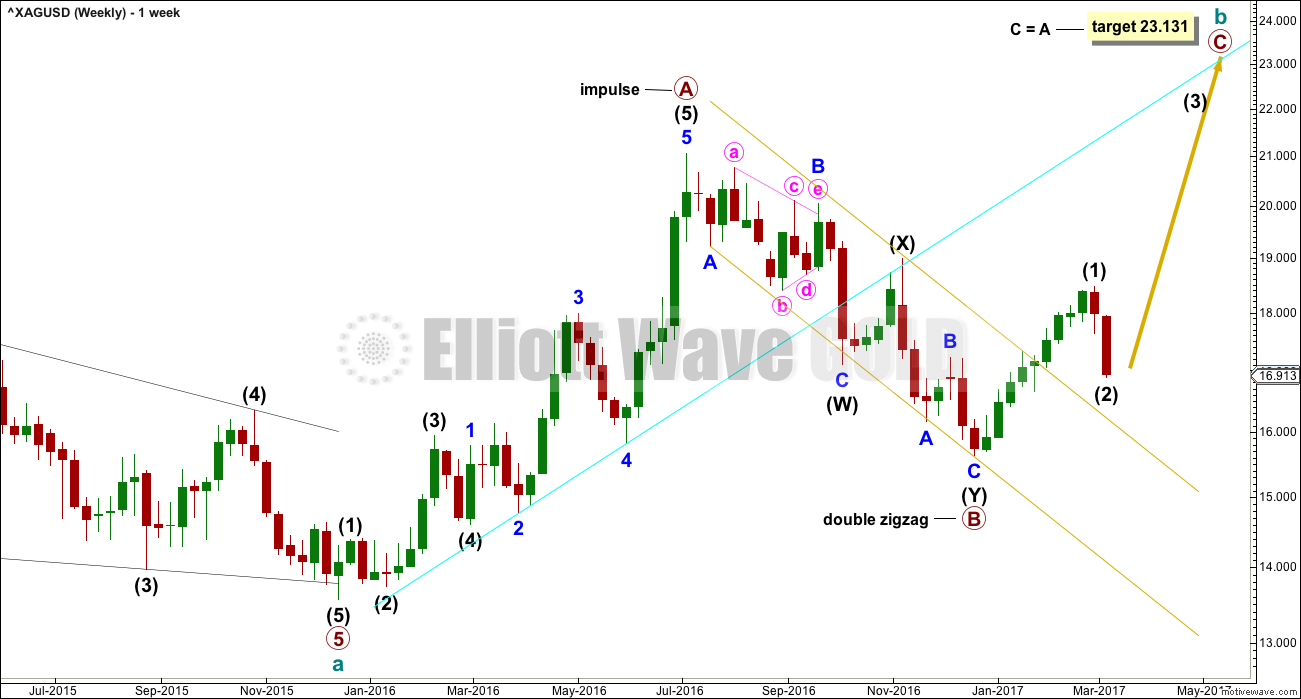
WEEKLY CHART
Click chart to enlarge.
Upwards movement labelled primary wave A fits perfectly as an impulse.
Primary wave B fits as a deep double zigzag. Primary wave C must subdivide as a five wave structure. The target expects it to reach the most common Fibonacci ratio to primary wave A.
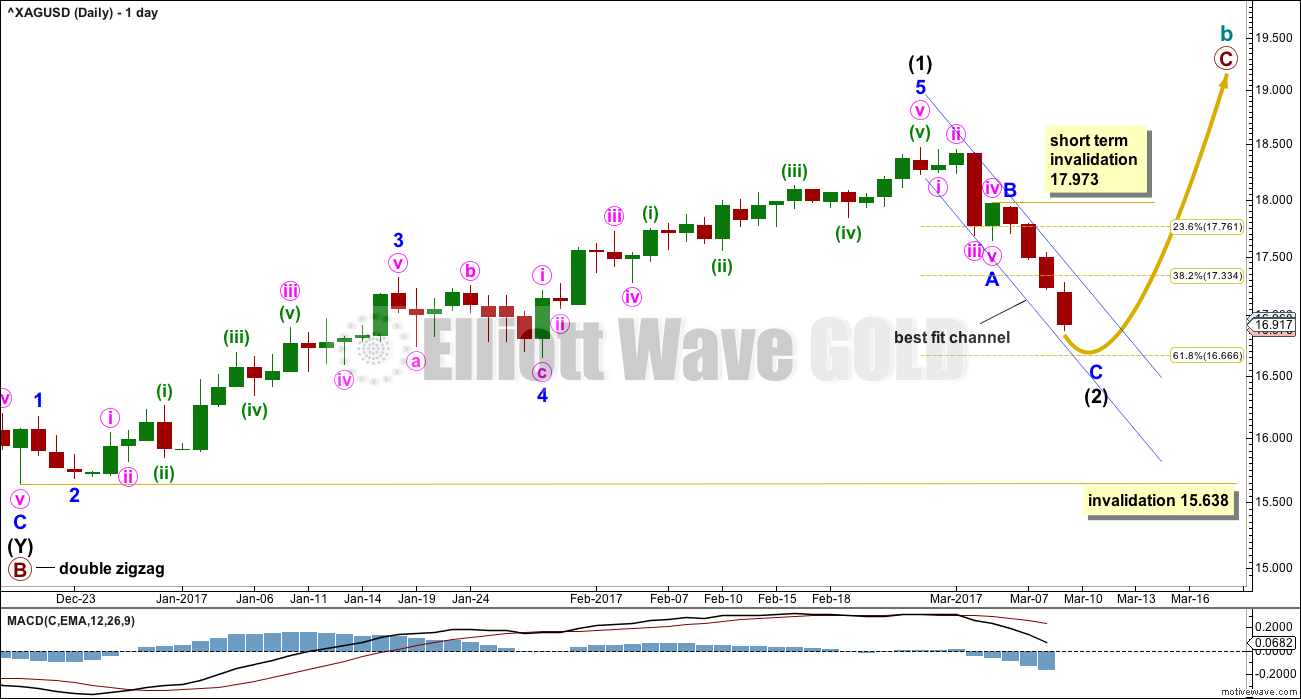
DAILY CHART
Click chart to enlarge.
The most likely point for intermediate wave (2) to end would be the 0.618 Fibonacci ratio of intermediate wave (1) about 16.666.
Intermediate wave (2) may be any corrective structure except a triangle. The first movement within it should be a five down, because this is a movement at intermediate degree.
At this stage, it looks like minor wave A is a complete five down, minor wave B is a quick shallow zigzag, and minor wave C may be close to completion.
Intermediate wave (1) lasted 50 days, no Fibonacci duration. Intermediate wave (2) may reasonably be expected to last a Fibonacci 34 or 55 days in total. However, as price is closing in now on the 0.618 Fibonacci ratio, intermediate wave (2) may not exhibit a Fibonacci duration or it may if it is over now in a Fibonacci 8 days or in another 5 to total a Fibonacci 13.
The alternate daily Elliott wave count presented in last week’s analysis is now invalidated leaving only one wave count.
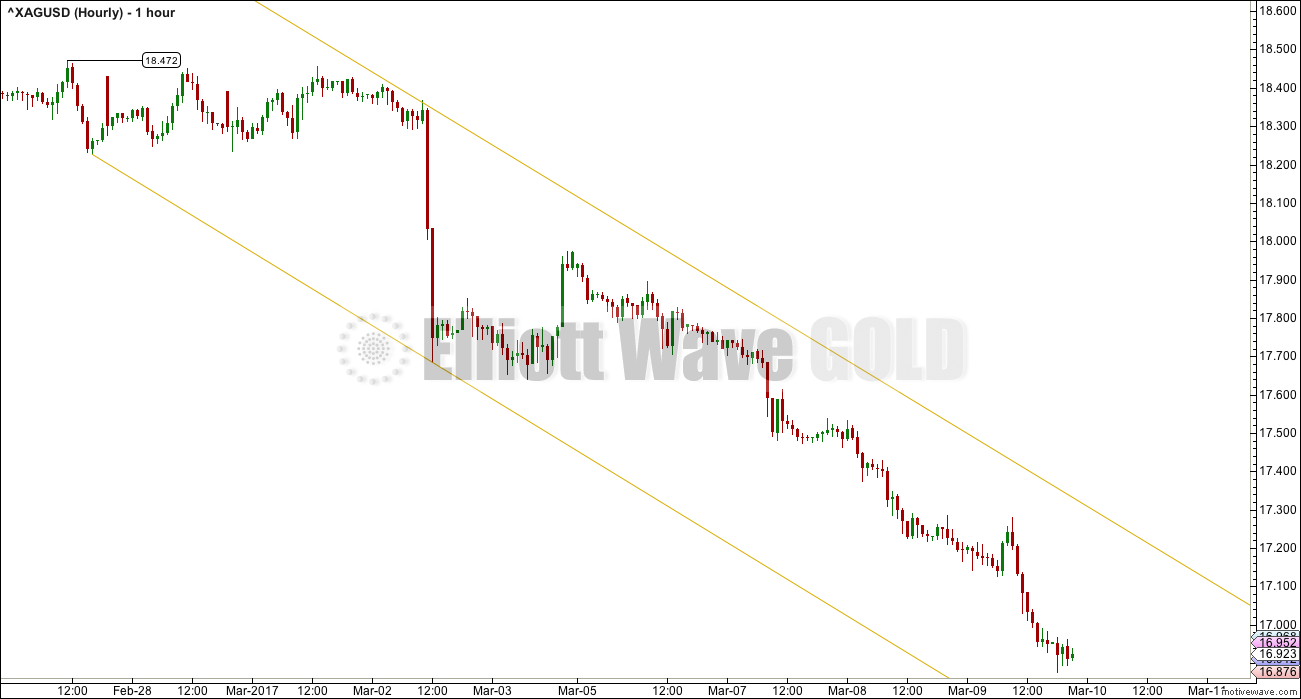
HOURLY CHART
Click chart to enlarge.
The only purpose for this hourly chart is to illustrate one possible trend channel. If members are holding short positions on Silver, and if they have confidence in this analysis, then use the channel to signal an exit for short positions. When the upper edge of the channel is breached by upwards movement, not sideways, it would be an early indication of a possible trend change.
This means that the end of the movement is not captured, but there is almost no technical analysis method which will neatly pick highs and lows for you. The idea is to capture as much of a trend as reasonable, entering after some confirmation and exiting after some confirmation of a change.
If Silver does see a trend change, it may be one at intermediate degree. If members choose to enter long, then remember my two Golden Rules of risk management:
1. Always use a stop.
2. Do not invest more than 1-5% of equity on any one trade.
A stop just below the last swing low would be reasonable after confirmation of a trend change; allow the market room to move. Adjust position size so that rule 2 is met after determining where your stop is.
Setting stops too close risks being whipsawed out of your position, only to see the market continue in the expected direction.
TECHNICAL ANALYSIS
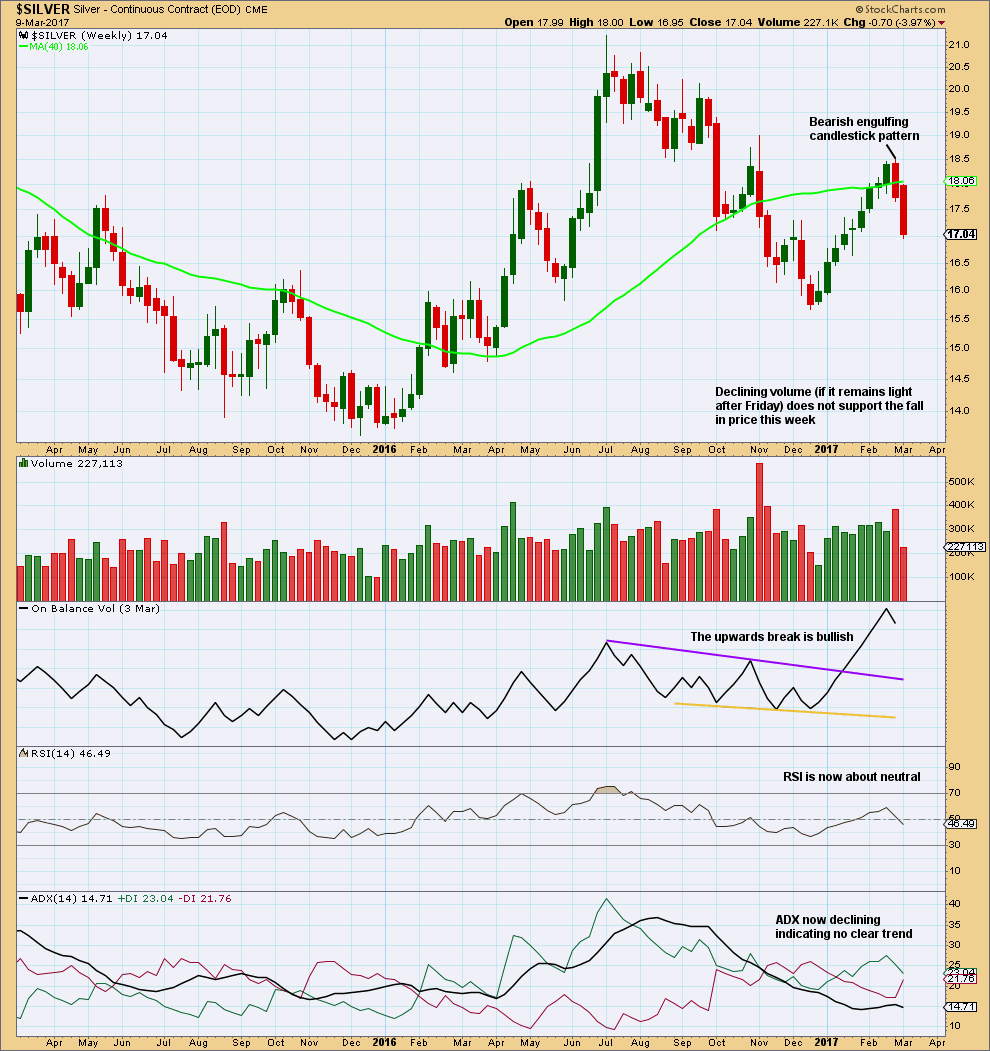
WEEKLY CHART
Click chart to enlarge. Chart courtesy of StockCharts.com.
Unless Friday’s session completes with very heavy volume, it looks like volume this week will be a lot lighter than last week. The fall in price is not supported by volume and this puts doubt on the strength of this downwards trend. Price may not fall much further. This fits the Elliott wave count.
DAILY CHART
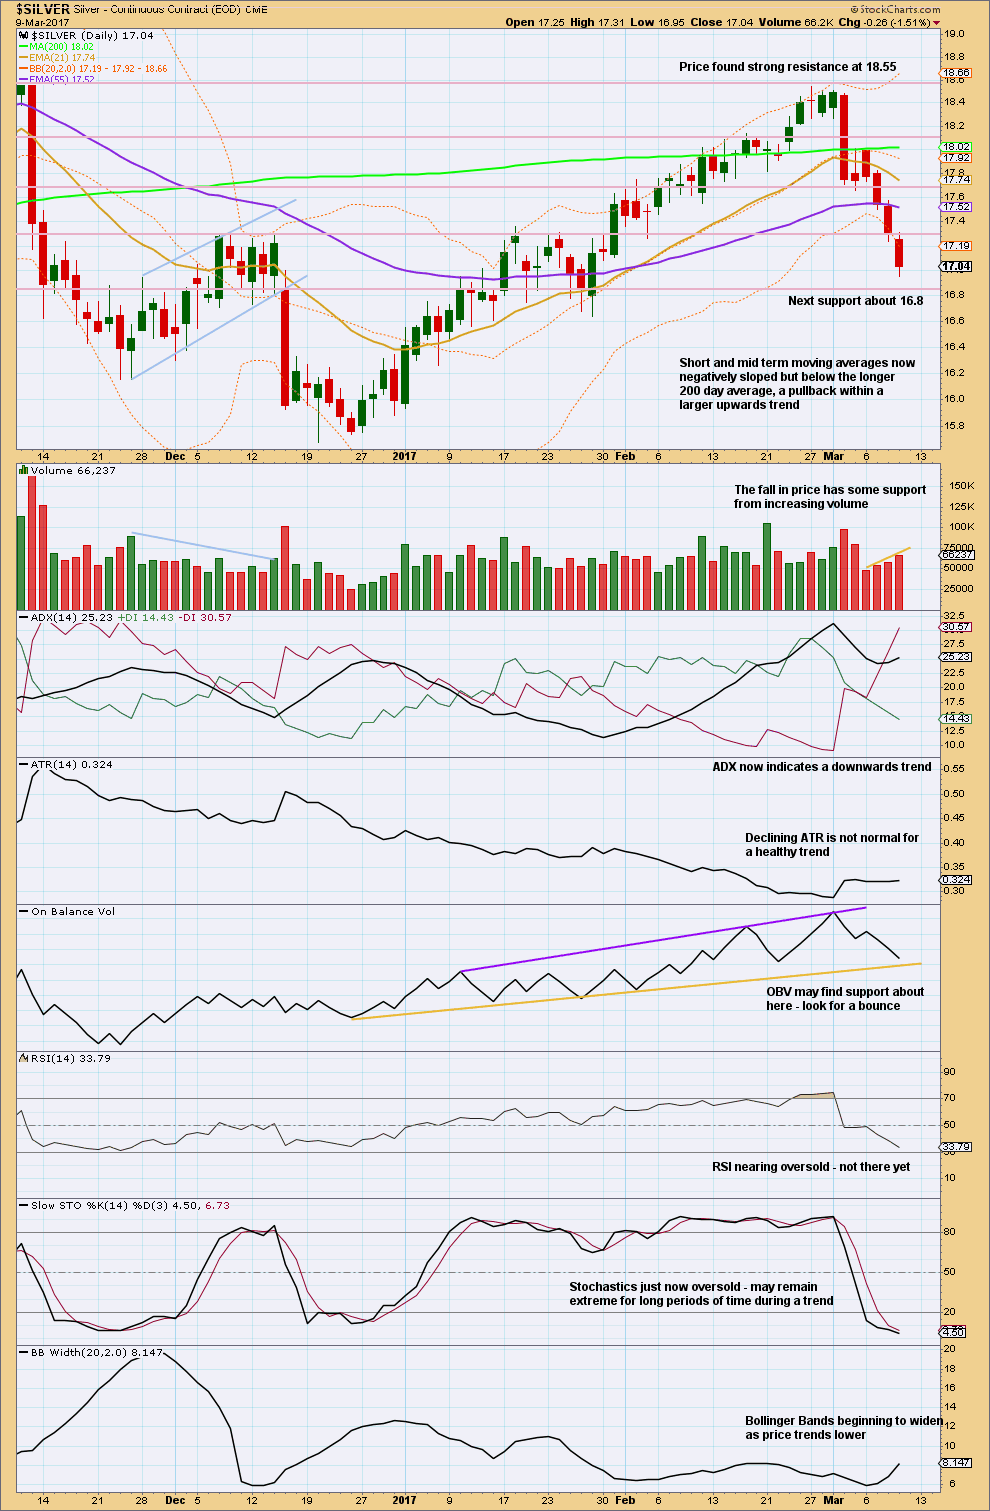
Click chart to enlarge. Chart courtesy of StockCharts.com.
Next support is at 16.85, about 16.80.
Volume for the last four sessions shows a steady increase to support the fall in price. However, these sessions are all lighter than prior upwards sessions and the start of this downwards movement. The larger picture sees less support here for falling price from volume than there was for the prior rise in price. This is more typical of a counter trend pullback than it is for a healthy trend.
There is room for price to fall a little further before reaching support and before On Balance Volume reaches support.
This analysis is published @ 10:15 p.m. EST.