
Today’s Trading Room looks at Copper, US Oil, NGas, USD Index, EURBGP and USDJPY.
To learn what the Trading Room is about see first Trading Room analysis here.
Trading Room will focus on classic technical analysis. Elliott wave analysis will be for support and for targets / invalidation points.
Copper
TECHNICAL ANALYSIS
Click chart to enlarge. Chart courtesy of StockCharts.com.
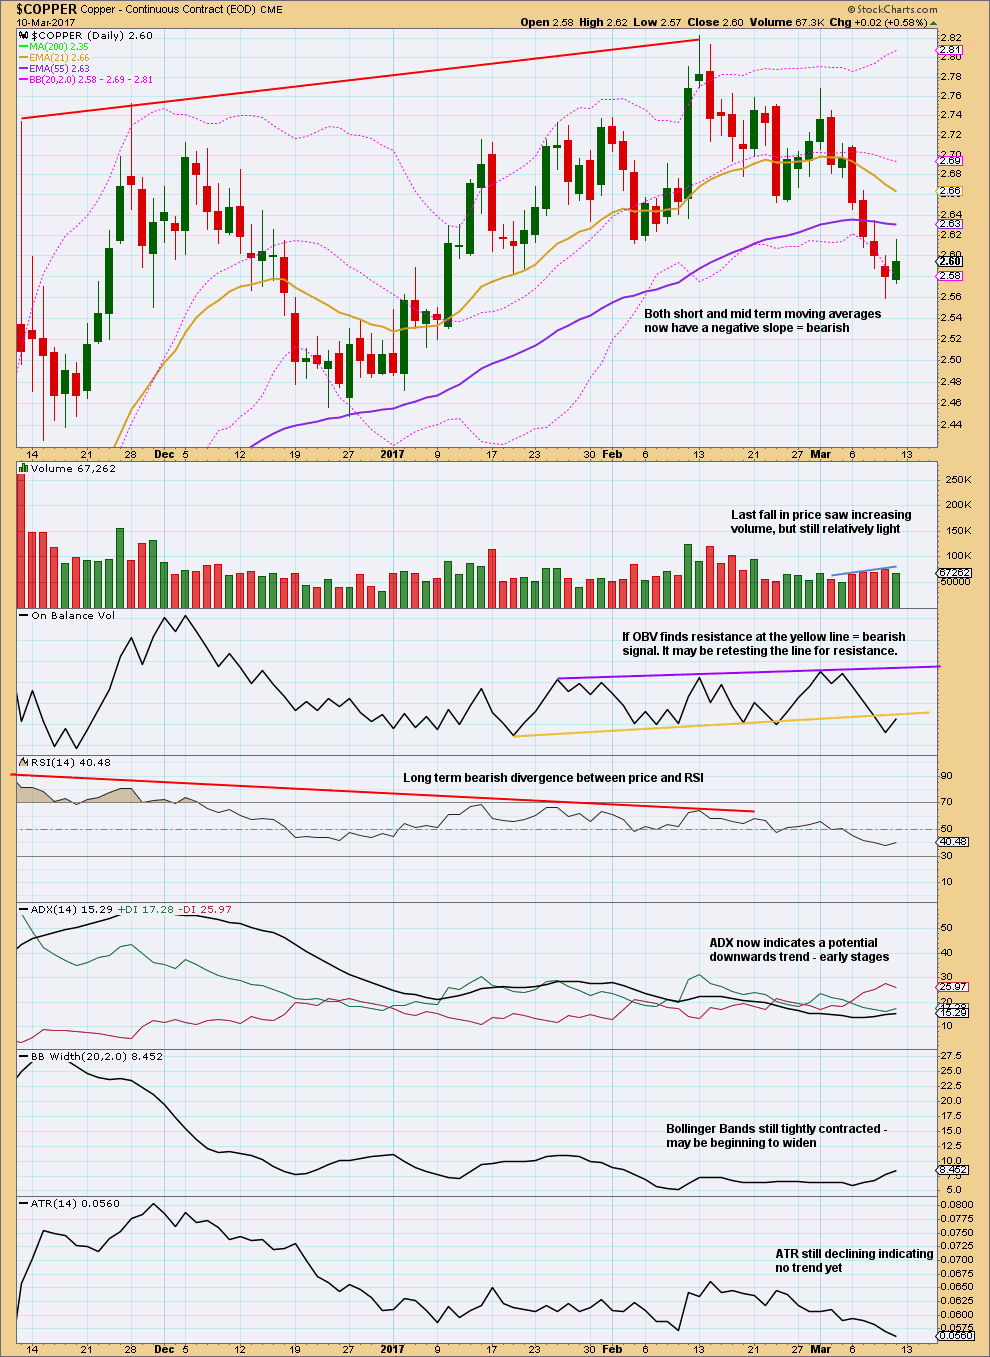
Volume supports downwards movement. Copper has broken below support and is now trending down.
Lighter volume for the last upwards session is slightly bearish, as is the long upper wick. On Balance Volume is at resistance.
Two concerns: Price may yet move higher before it turns back down and ATR is still declining.
ELLIOTT WAVE ANALYSIS
Click chart to enlarge.
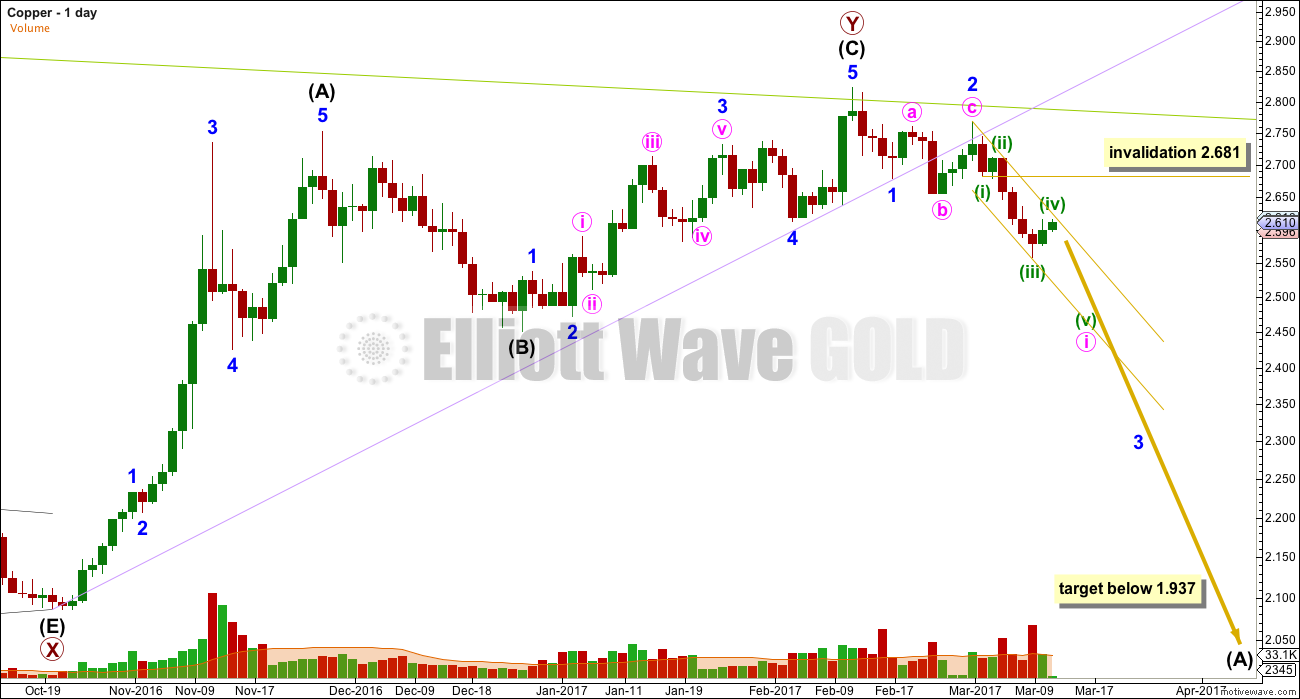
The invalidation point is not too far away. A small fourth wave correction may be complete.
The next wave down may exhibit some increase in momentum as it’s a fifth wave for a commodity.
Trading advice for members only: [wlm_private “GOLD Daily YT|GOLD Daily NT|GOLD Daily NTGR|GOLD DAILY 6M NT|GOLD DAILY 6M YT|GOLD DAILY 6M NT GFR|GOLD Plus Daily YT|GOLD Plus Daily NT|OIL SILVER Weekly YT|OIL SILVER Weekly NT|GOLD Plus Daily 6M NT|GOLDPLUSDAY6M|OIL SILVER Weekly 6M NT|GOLDPLUSDAY1M|GOLDPLUSDAY1MYT|GOLDDAY6M|GOLDDAY1M|GOLDDAY1MYT|OILSILVERWEEK6M|OILSILVERWEEK1M|OILSILVERWEEK1MYT”]Stops for short positions may be set just above 2.681. Target at 1.937. Be prepared to have an underwater position possibly for one day.[/wlm_private]
US Oil (WTI Crude – Spot)
TECHNICAL ANALYSIS
Click chart to enlarge. Chart courtesy of StockCharts.com.
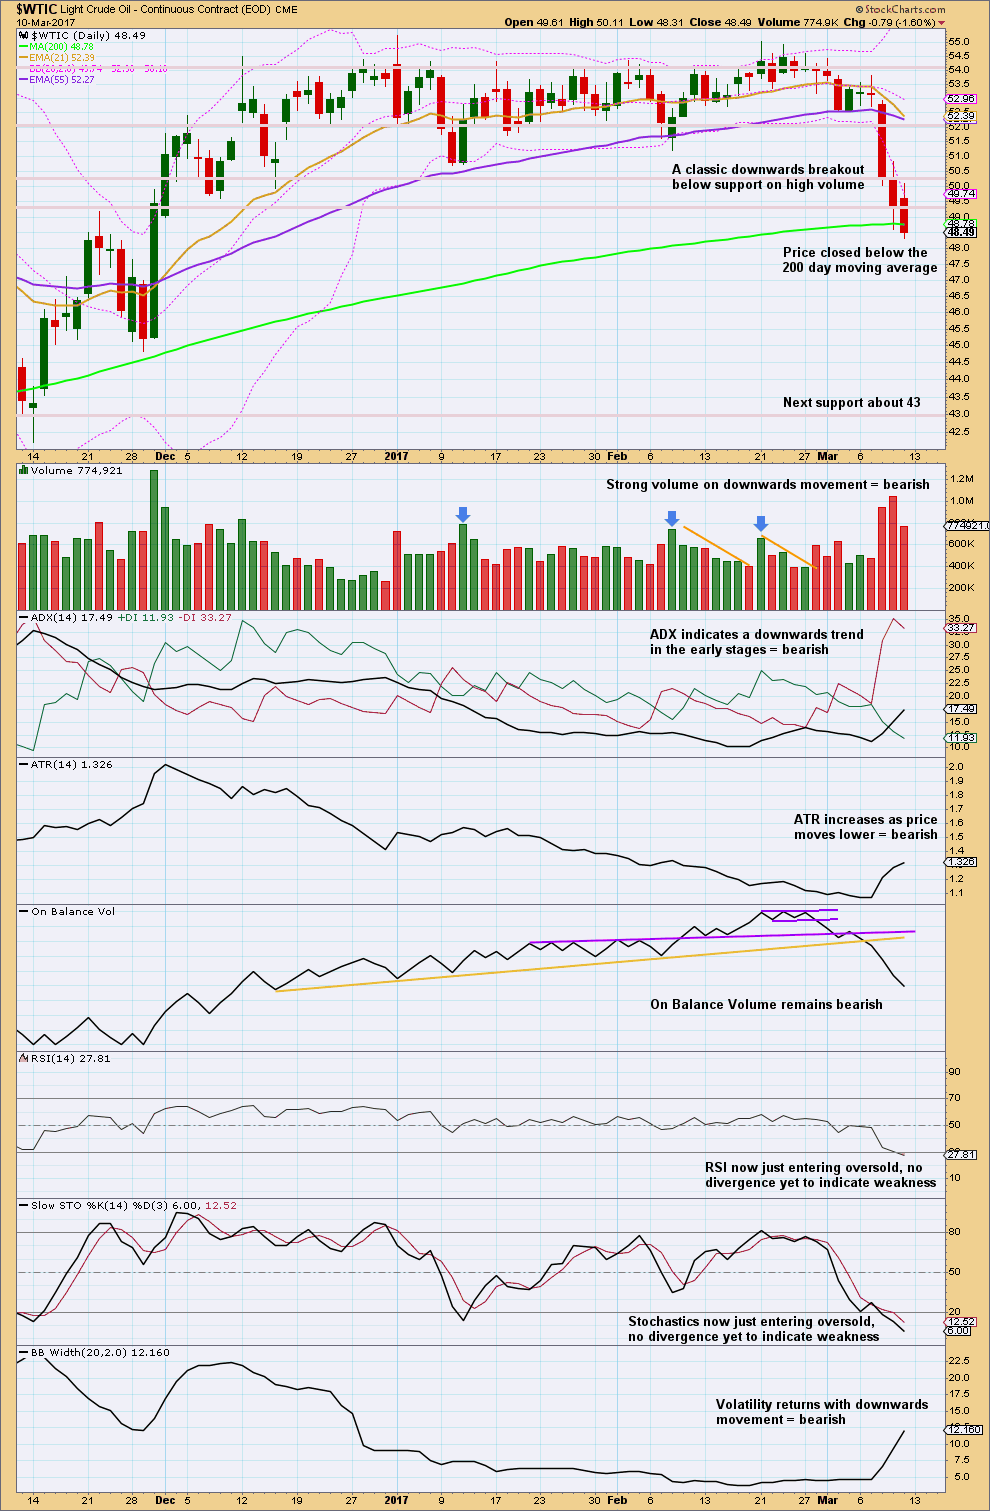
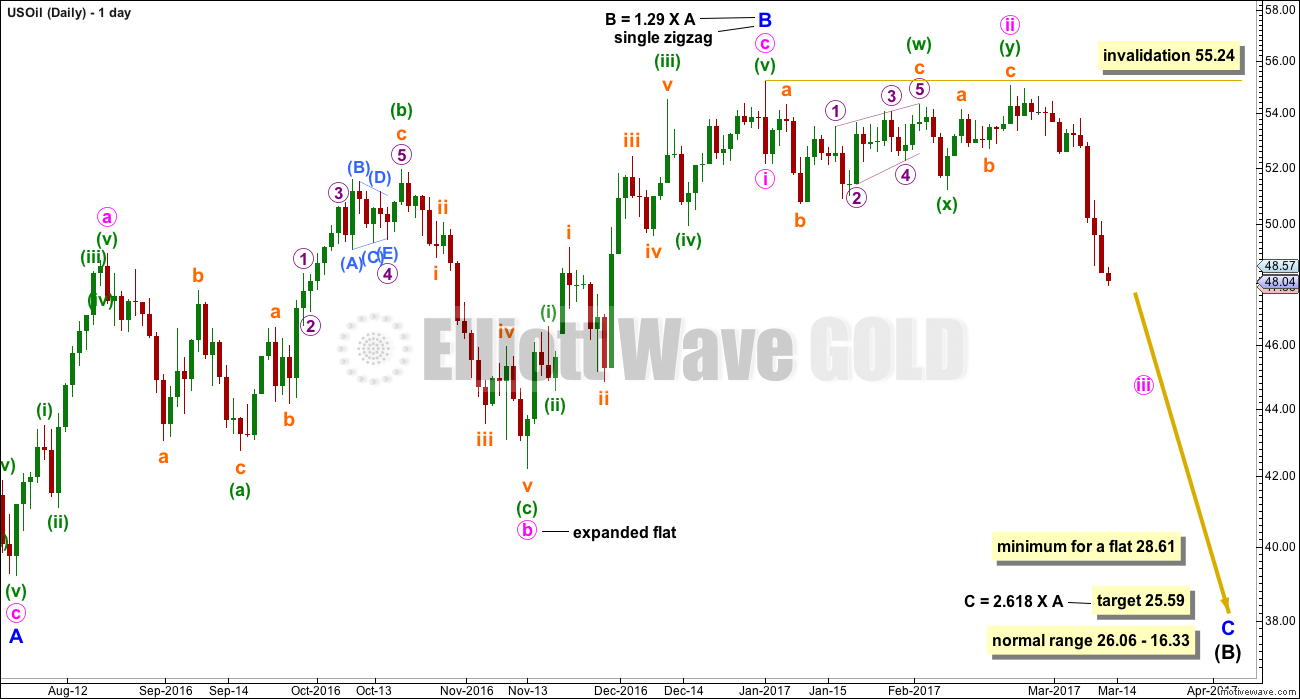
RSI and Stochastics can remain extreme for reasonable periods of time when US Oil trends. Oversold conditions for these two indicators does not necessarily mean a low must be in place.
Very strong volume over the last three days supports downwards movement.
Sometimes after a breakout price curves back to retest prior support or resistance. It is possible here that US Oil may turn up for a test of resistance about 50.70. However, this does not always happen.
HOURLY CHART
Click chart to enlarge.
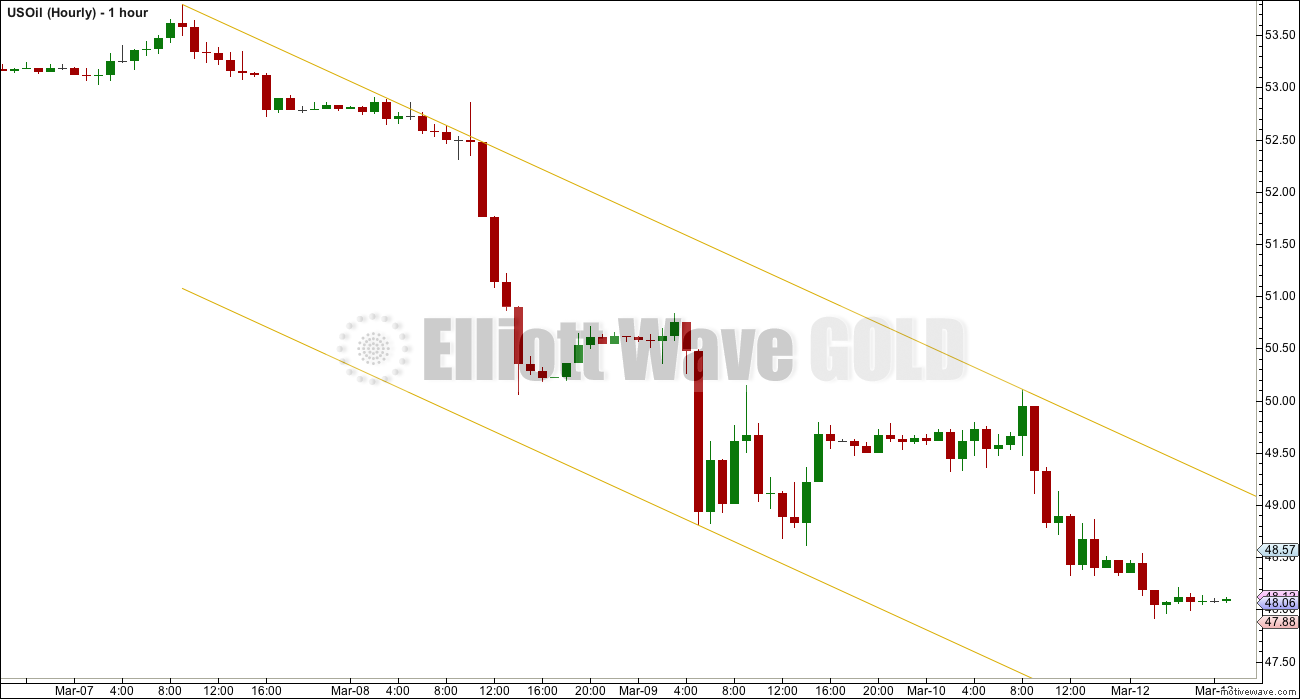
While price remains within this channel expect it to continue downwards. If the channel is breached, then a larger bounce may be underway.
ELLIOTT WAVE ANALYSIS
Click chart to enlarge.
A larger flat correction may be unfolding for a fourth wave (EWG members should refer to the US Oil monthly chart for the bigger picture here). Within a flat correction, intermediate wave (B) must retrace a minimum 0.9 length of intermediate wave (A) at 28.61.
Trading advice for members only: [wlm_private “GOLD Daily YT|GOLD Daily NT|GOLD Daily NTGR|GOLD DAILY 6M NT|GOLD DAILY 6M YT|GOLD DAILY 6M NT GFR|GOLD Plus Daily YT|GOLD Plus Daily NT|OIL SILVER Weekly YT|OIL SILVER Weekly NT|GOLD Plus Daily 6M NT|GOLDPLUSDAY6M|OIL SILVER Weekly 6M NT|GOLDPLUSDAY1M|GOLDPLUSDAY1MYT|GOLDDAY6M|GOLDDAY1M|GOLDDAY1MYT|OILSILVERWEEK6M|OILSILVERWEEK1M|OILSILVERWEEK1MYT”]Entering short now may be a more risky or short term trade. If entering short here, watch price carefully. Use the channel on the hourly chart to exit short positions if it is breached. Stops may be set just above prior resistance at 50.72, The target is at 46.91 for minute iii to reach 1.618 the length of minute i.[/wlm_private]
Natural Gas
TECHNICAL ANALYSIS
Click chart to enlarge. Chart courtesy of StockCharts.com.
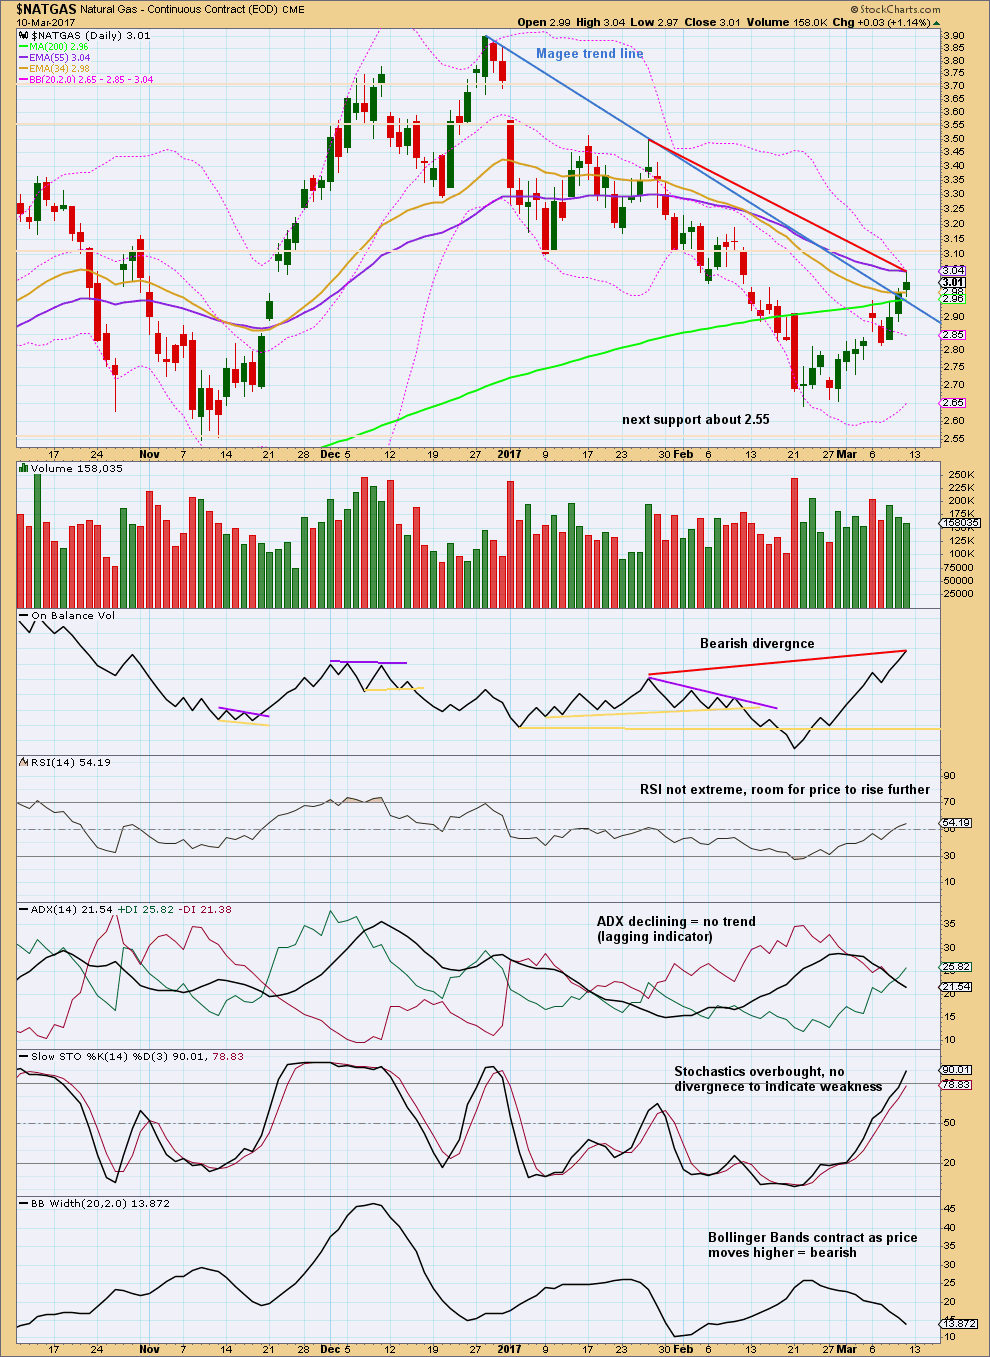
It is concerning that the Magee trend line is breached.
The last three daily candlesticks complete stalled pattern. The longer upper wick on the last candlestick is bearish. Declining volume for the last two upwards days is bearish.
On Balance Volume is bullish in that it is making strong new highs with price. There is some bearish divergence as noted.
Overall, it does look like this is a counter trend movement. But there is no indication it is over at this stage, so it may move higher.
ELLIOTT WAVE ANALYSIS
Click chart to enlarge.
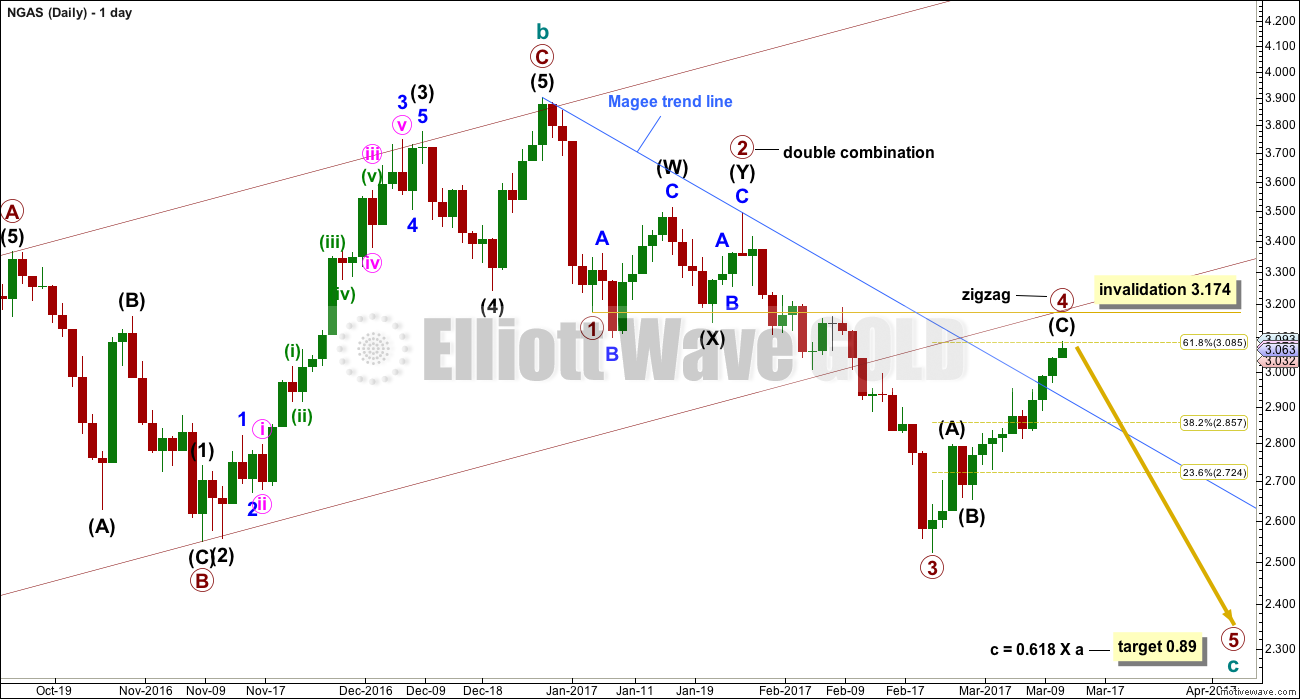
The fourth wave is now very close to first wave price territory. If this portion of the wave count is correct, then there is very little room for NGas to move into. The target expects a long strong extended fifth wave, typical of commodities.
Trading advice for members only: [wlm_private “GOLD Daily YT|GOLD Daily NT|GOLD Daily NTGR|GOLD DAILY 6M NT|GOLD DAILY 6M YT|GOLD DAILY 6M NT GFR|GOLD Plus Daily YT|GOLD Plus Daily NT|OIL SILVER Weekly YT|OIL SILVER Weekly NT|GOLD Plus Daily 6M NT|GOLDPLUSDAY6M|OIL SILVER Weekly 6M NT|GOLDPLUSDAY1M|GOLDPLUSDAY1MYT|GOLDDAY6M|GOLDDAY1M|GOLDDAY1MYT|OILSILVERWEEK6M|OILSILVERWEEK1M|OILSILVERWEEK1MYT”]If entering short here, stops may be set just above 3.174. The target may be at 0.89. Be prepared to have an underwater position for another day. Alternatively, wait for a strong red daily candlestick for a less risky entry point.[/wlm_private]
USD Index
TECHNICAL ANALYSIS
Click chart to enlarge. Chart courtesy of StockCharts.com.
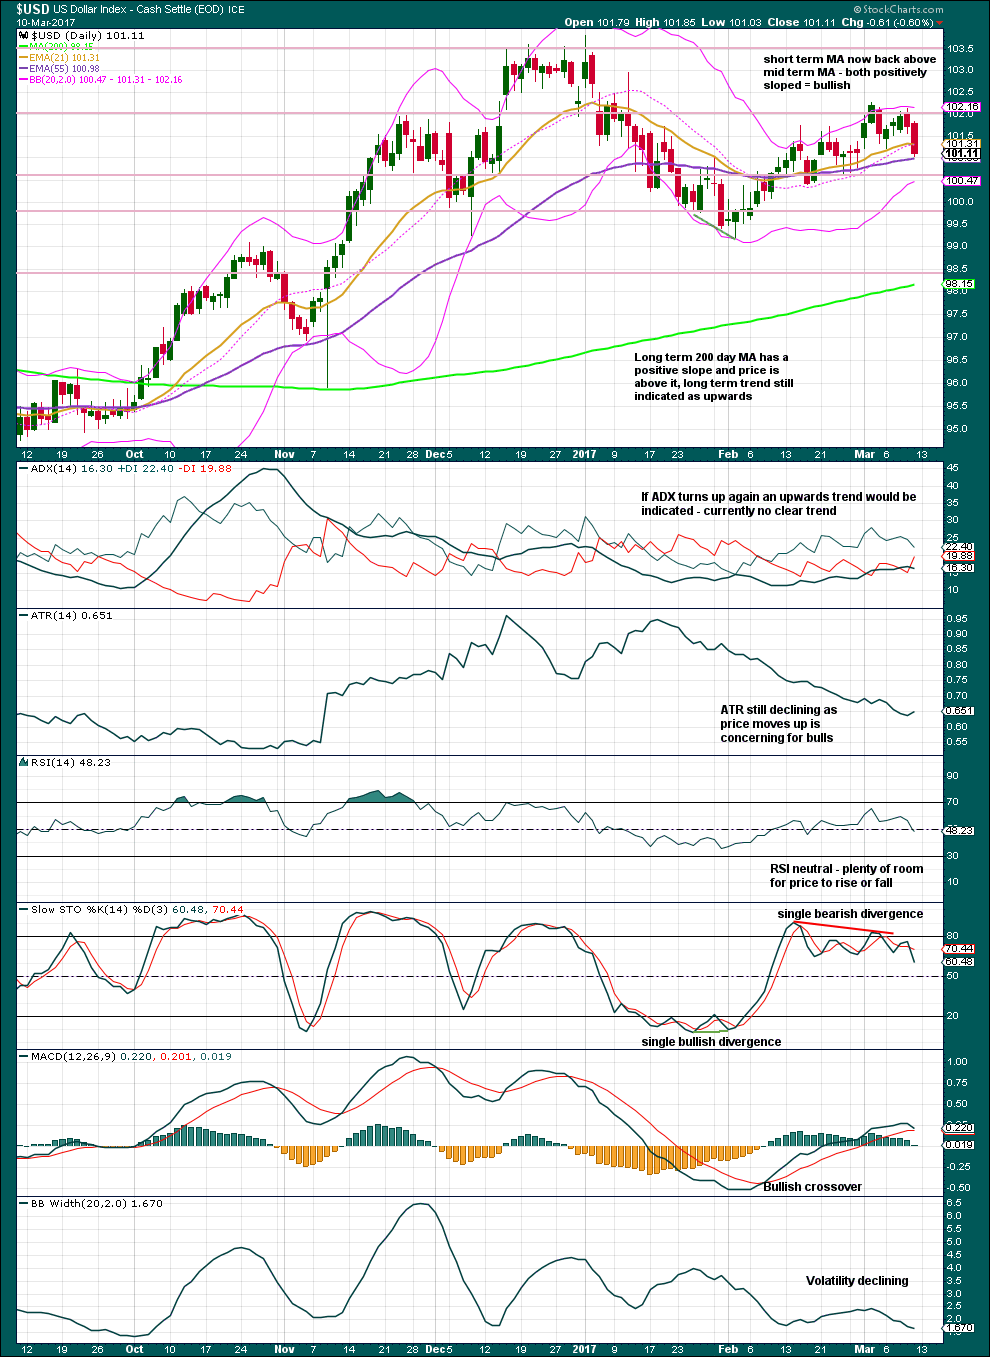
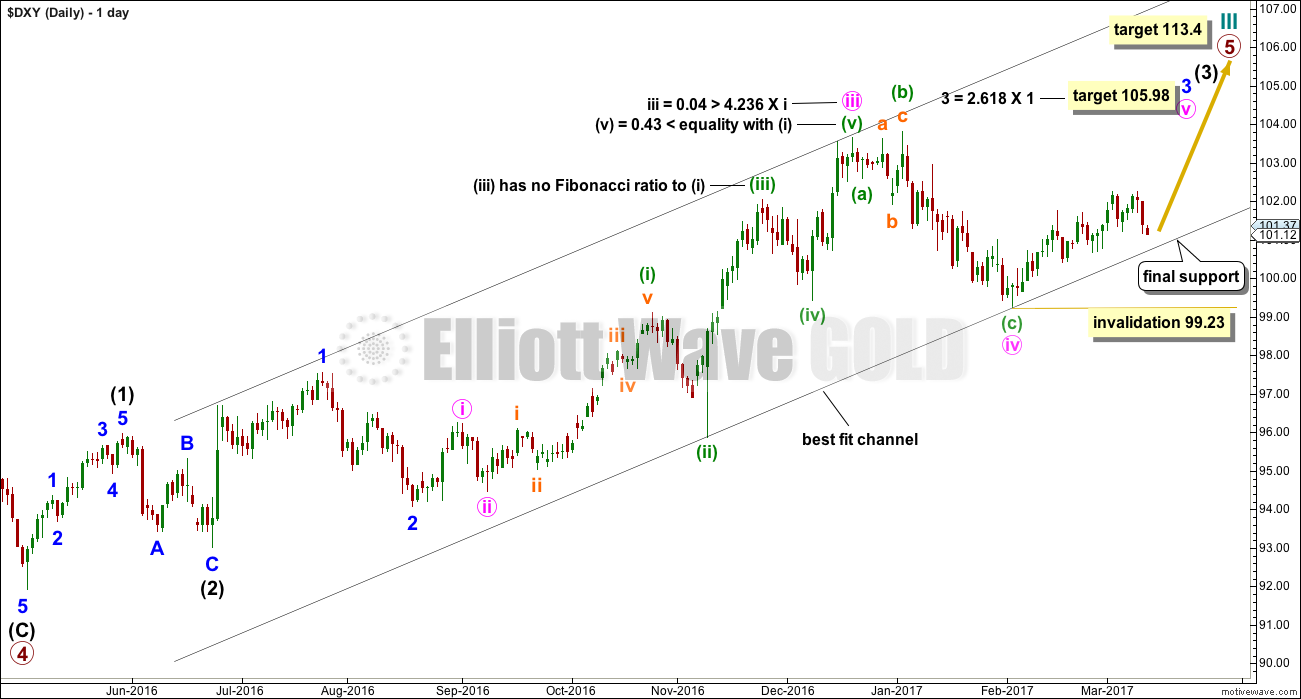
If there is a resumption of the larger upwards trend, then this next wave up is in its very early stages. In the short term, it looks like USD Index has made a relatively deep correction. Support is about 100.60. If price can break above resistance at 103, then next resistance is about 103.50.
ELLIOTT WAVE ANALYSIS
Click chart to enlarge.
The structure of primary wave 5 is still incomplete. If the current correction moves lower, it should find support at the lower edge of the trend channel. If that trend channel is breached, then the wave count would be in doubt.
Trading advice for members only: [wlm_private “GOLD Daily YT|GOLD Daily NT|GOLD Daily NTGR|GOLD DAILY 6M NT|GOLD DAILY 6M YT|GOLD DAILY 6M NT GFR|GOLD Plus Daily YT|GOLD Plus Daily NT|OIL SILVER Weekly YT|OIL SILVER Weekly NT|GOLD Plus Daily 6M NT|GOLDPLUSDAY6M|OIL SILVER Weekly 6M NT|GOLDPLUSDAY1M|GOLDPLUSDAY1MYT|GOLDDAY6M|GOLDDAY1M|GOLDDAY1MYT|OILSILVERWEEK6M|OILSILVERWEEK1M|OILSILVERWEEK1MYT”]If entering long, stops may be set just below the trend channel; about 100.50 would allow the market room to move. Be prepared to have an underwater position for up to about three days. Target at 105.98.[/wlm_private]
EURGBP
TECHNICAL ANALYSIS
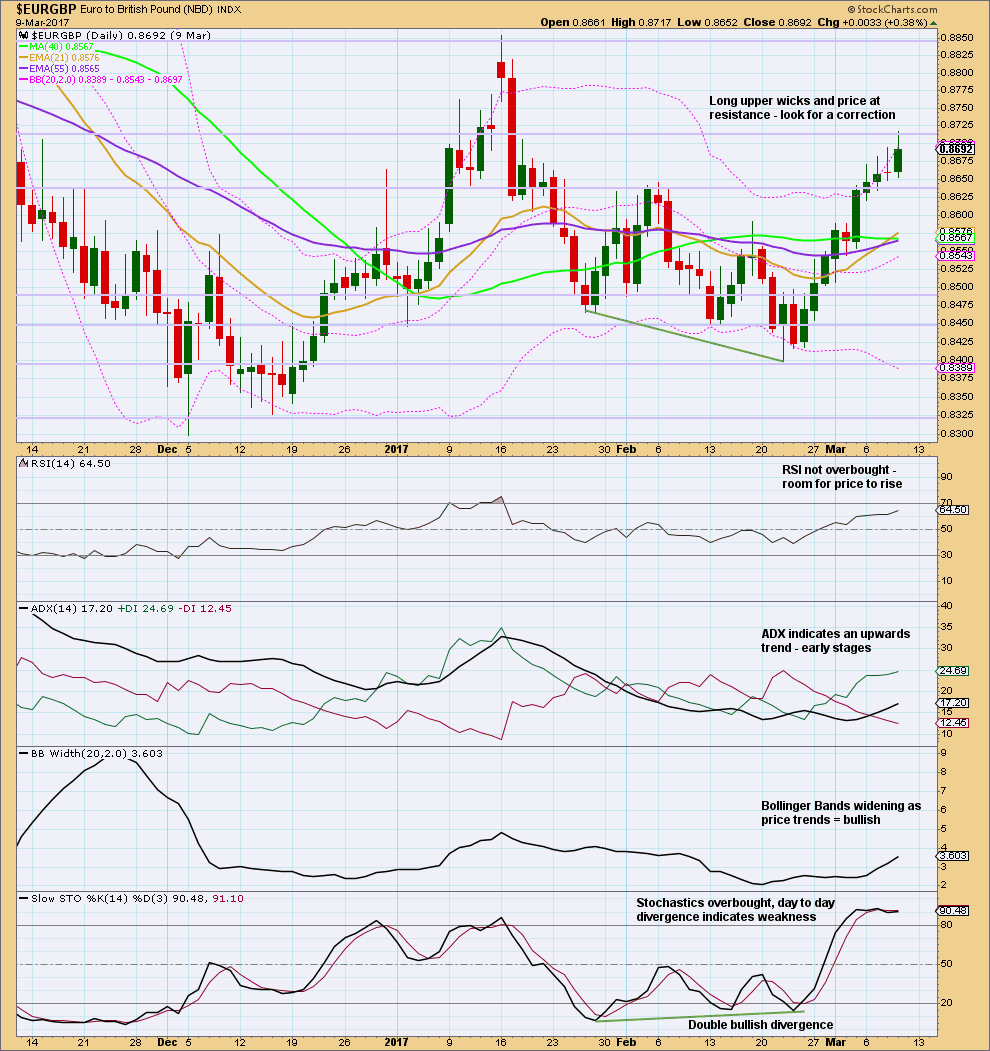
Click chart to enlarge. Chart courtesy of StockCharts.com.
It looks like EURGBP is currently at resistance and may move into a small consolidation for a few days. This may bring Stochastics down from overbought. Price may find support about 0.8635.
It looks like there is a new upwards trend beginning.
ELLIOTT WAVE ANALYSIS
Click chart to enlarge.
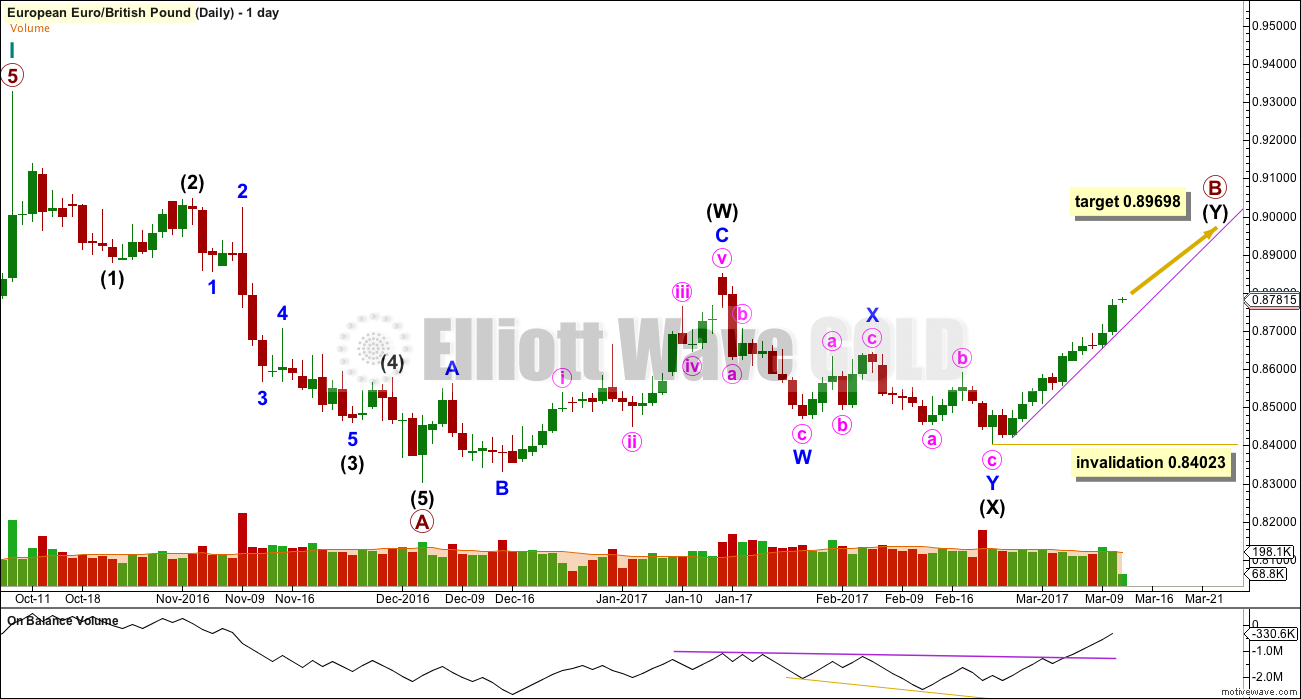
The upwards movement should unfold as a three wave structure, so there should be downwards movement for minor wave B within it. If the target is wrong, it may be too low.
Trading advice for members only: [wlm_private “GOLD Daily YT|GOLD Daily NT|GOLD Daily NTGR|GOLD DAILY 6M NT|GOLD DAILY 6M YT|GOLD DAILY 6M NT GFR|GOLD Plus Daily YT|GOLD Plus Daily NT|OIL SILVER Weekly YT|OIL SILVER Weekly NT|GOLD Plus Daily 6M NT|GOLDPLUSDAY6M|OIL SILVER Weekly 6M NT|GOLDPLUSDAY1M|GOLDPLUSDAY1MYT|GOLDDAY6M|GOLDDAY1M|GOLDDAY1MYT|OILSILVERWEEK6M|OILSILVERWEEK1M|OILSILVERWEEK1MYT”]Watch over the next few days for a small consolidation. That may present a better opportunity to join the trend.[/wlm_private]
USDJPY
TECHNICAL ANALYSIS
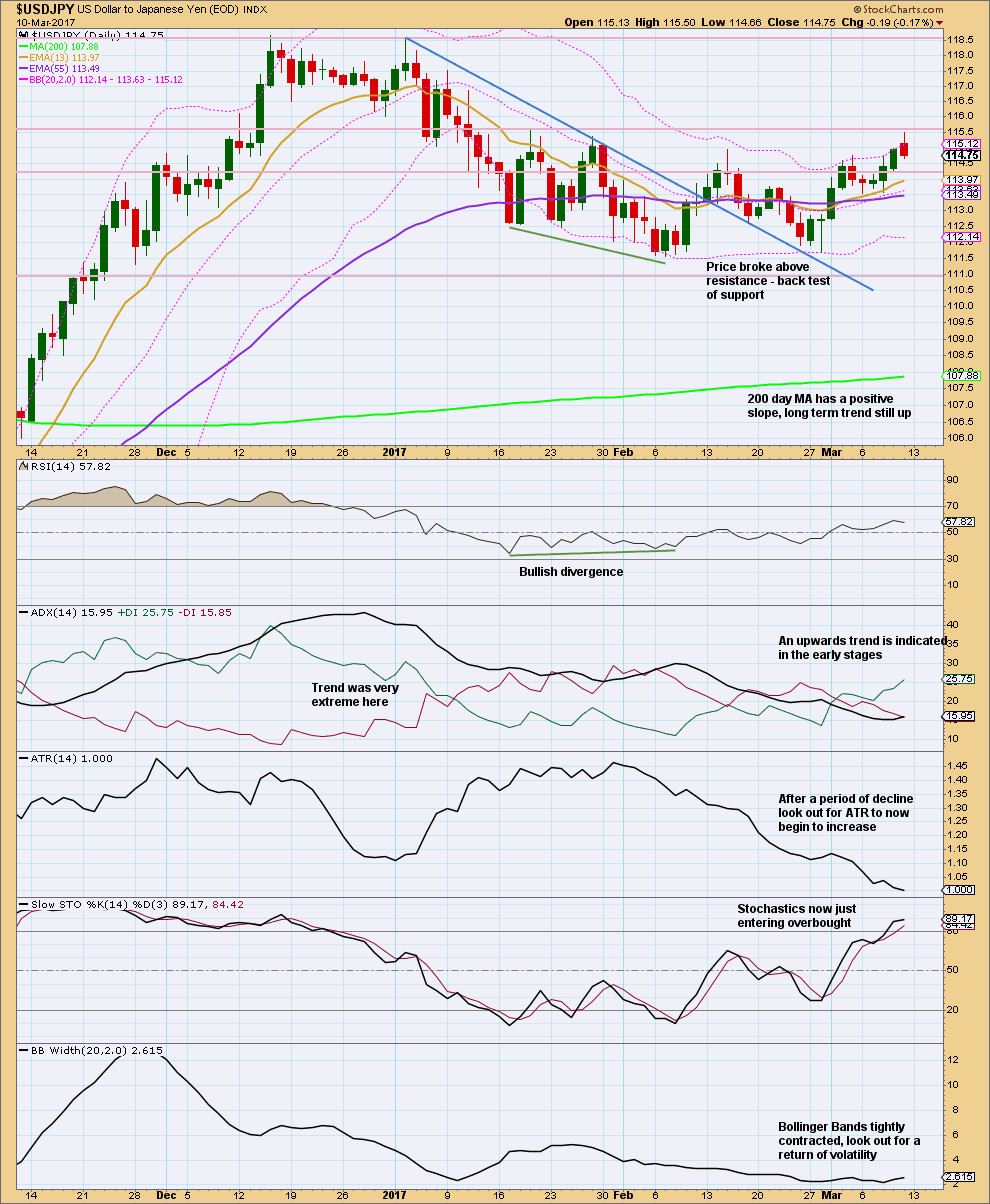
Click chart to enlarge. Chart courtesy of StockCharts.com.
This pair has proven tricky to find an entry. It is currently in a consolidation with resistance about 115.55 and support about 111.55.
The short term Fibonacci 13 day moving average has just crossed above the mid term Fibonacci 55 day moving average giving a bullish crossover.
RSI is not extreme. Stochastics is extreme, but this may remain extreme for long periods of time when this market trends.
VOLUME ANALYSIS
Click chart to enlarge.
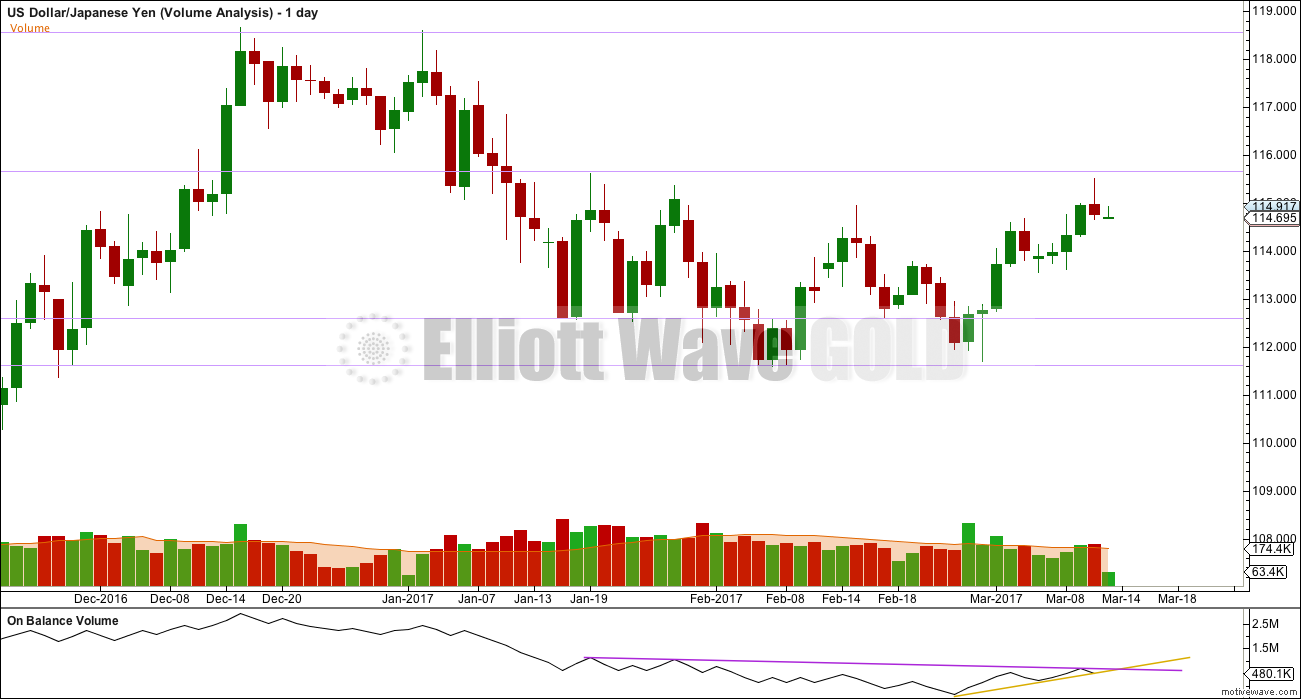
Volume for the last three upwards days showed an increase to support the rise in price. The long upper wick on the last daily candlestick is bearish.
On Balance Volume is squeezed. A break above the purple resistance line would be a reasonable bullish signal. A break below the yellow support line would be a weak bearish signal.
ELLIOTT WAVE ANALYSIS
Click chart to enlarge.
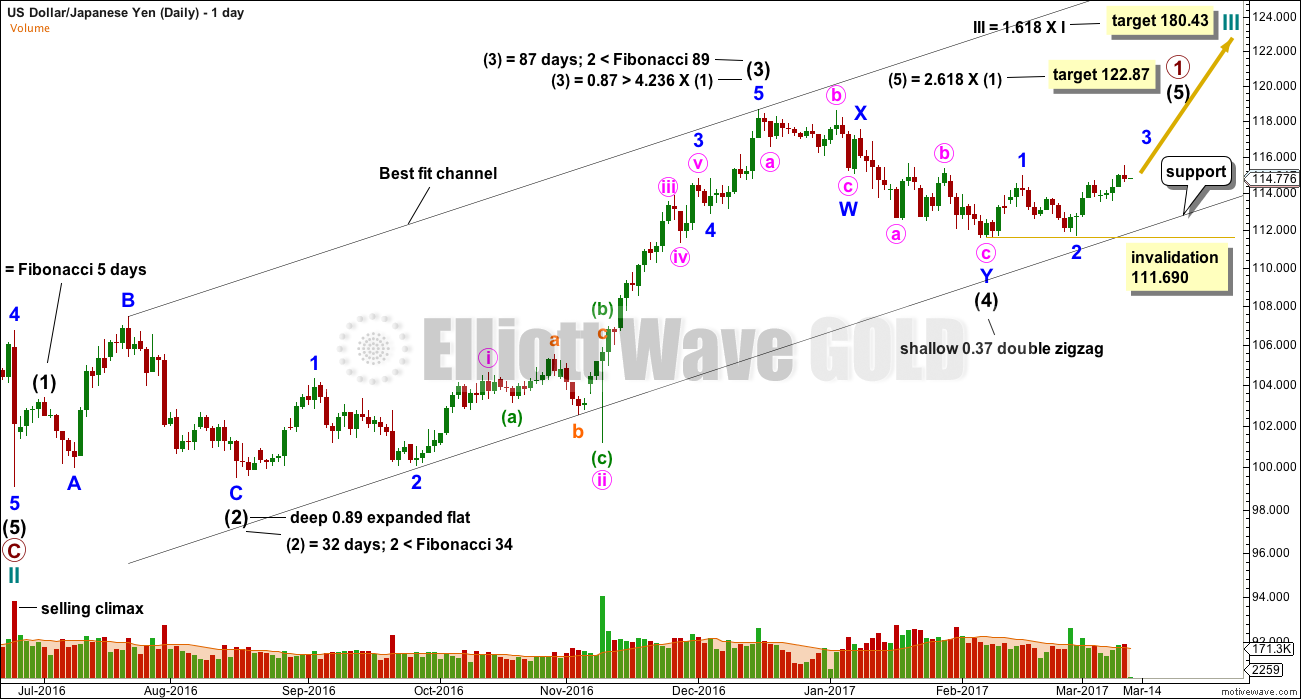
The structure of cycle wave III is still incomplete. The fifth wave up needs to unfold.
Trading advice for members only: [wlm_private “GOLD Daily YT|GOLD Daily NT|GOLD Daily NTGR|GOLD DAILY 6M NT|GOLD DAILY 6M YT|GOLD DAILY 6M NT GFR|GOLD Plus Daily YT|GOLD Plus Daily NT|OIL SILVER Weekly YT|OIL SILVER Weekly NT|GOLD Plus Daily 6M NT|GOLDPLUSDAY6M|OIL SILVER Weekly 6M NT|GOLDPLUSDAY1M|GOLDPLUSDAY1MYT|GOLDDAY6M|GOLDDAY1M|GOLDDAY1MYT|OILSILVERWEEK6M|OILSILVERWEEK1M|OILSILVERWEEK1MYT”]If entering long here, be prepared to hold an underwater position for a few days. More risk averse traders may wait for a classic breakout with a strong upwards day to close above resistance at 115.55 on a day with strong volume, then enter long. If entering long here, stops may be set just below 111.69 to give the market room to move. Target is at 122.87.[/wlm_private]
DISCLAIMER
As always, it is essential that anyone using this analysis for trading advice manages risk carefully. Follow my two Golden Rules:
1. Always use a stop.
2. Never invest more than 1-5% of equity on any one trade.
Trading is about probabilities, not certainties. Failure to follow my two Golden Rules of trading indicates failure to manage risk.
Accept that this analysis may be wrong. It is impossible for any analyst to predict with certainty what a market will do next.
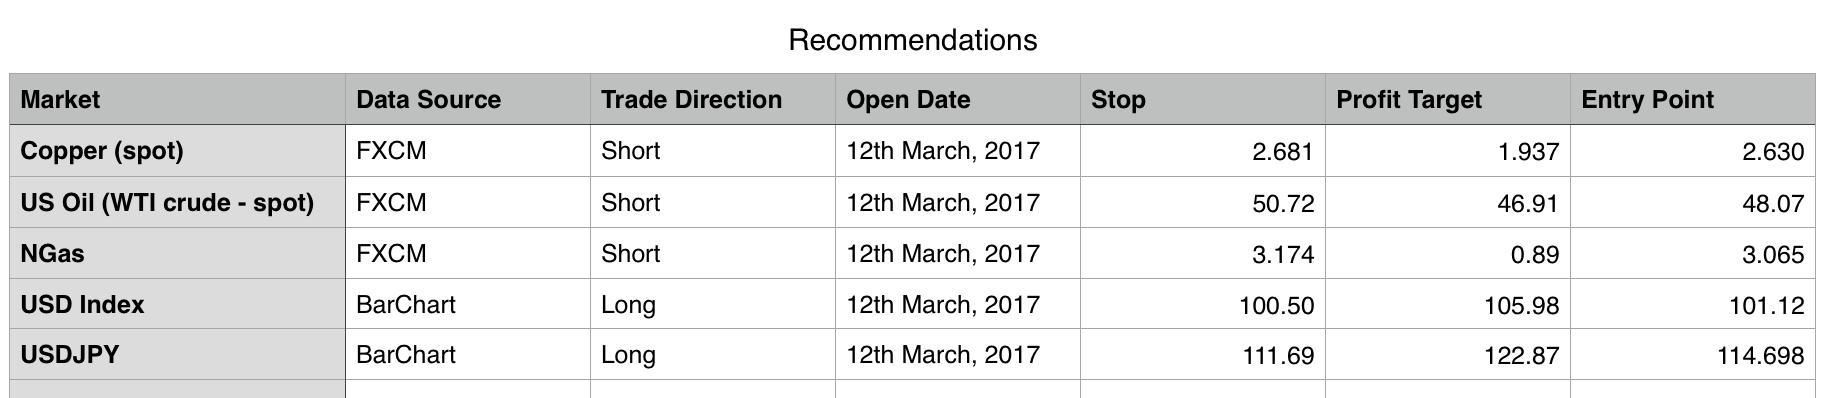
TRADING ROOM SUMMARY TABLE
New to Trading Room is a simplified table to summarise Trading Room. (Thanks to our member Dreamer for the idea.)
Subsequent posts will add a separate table for Open Positions and when applicable a third table for Closed Positions.
[wlm_private “GOLD Daily YT|GOLD Daily NT|GOLD Daily NTGR|GOLD DAILY 6M NT|GOLD DAILY 6M YT|GOLD DAILY 6M NT GFR|GOLD Plus Daily YT|GOLD Plus Daily NT|OIL SILVER Weekly YT|OIL SILVER Weekly NT|GOLD Plus Daily 6M NT|GOLDPLUSDAY6M|OIL SILVER Weekly 6M NT|GOLDPLUSDAY1M|GOLDPLUSDAY1MYT|GOLDDAY6M|GOLDDAY1M|GOLDDAY1MYT|OILSILVERWEEK6M|OILSILVERWEEK1M|OILSILVERWEEK1MYT”]
Click table to enlarge.[/wlm_private]
This analysis is published @ 03:20 a.m. EST.
It’s just occurred to me also that the recommendation for where to place stops isn’t actually the price point you need to set your stop at exactly.
Remember that broker margins mean the stop has to be slightly further away. When market volatility spike and price whipsaws, broker margins widen to sometimes about 3X normal.
When I set my stop I always add 3X the broker margin.
Otherwise you may get taken out by a whipsaw and your broker, only to see price turn and move your way. It’s the most frustrating experience, do avoid it.
Thank you Lara
Hi Lara, what’s wrong with EURUSD?)) 1.08 is the target now? thanks a lot
I have not included EURUSD in this Trading Room post because I’m not confident it’s offering a set up. It looked like it was going to trend down, but then it shot up. I’m watching it daily, and if I see it ready to break up or down I’ll post it again. It’s range bound and I’m looking for On Balance Volume to indicate next direction.
Lara, a big 👍for adding the summary table of recommendations! I think members are really going to benefit more from your Trading Room when they can easily see your recommendations with the targets, etc. Can’t wait to see some closed trades with great results in the coming weeks and months!
Yes, lets see how it goes. Good call Dreamer.
The eventual idea will be to access it as a dashboard, as per your suggestion. For now it’ll just be at the end of each post.
Kudos….this is excellent. I like the use of the term underwater…exactly what it is. Thanks, Lara!
The entry points on the Recommendation Table is simply the price point the market was at when the analysis was published.
For EURGBP keep an eye on comments here, if I see a set up I’ll note it here.