
Today’s Trading Room looks at Copper only.
To learn what the Trading Room is about see first Trading Room analysis here.
Trading Room will focus on classic technical analysis. Elliott wave analysis will be for support and for targets / invalidation points.
Copper (Spot)
TECHNICAL ANALYSIS
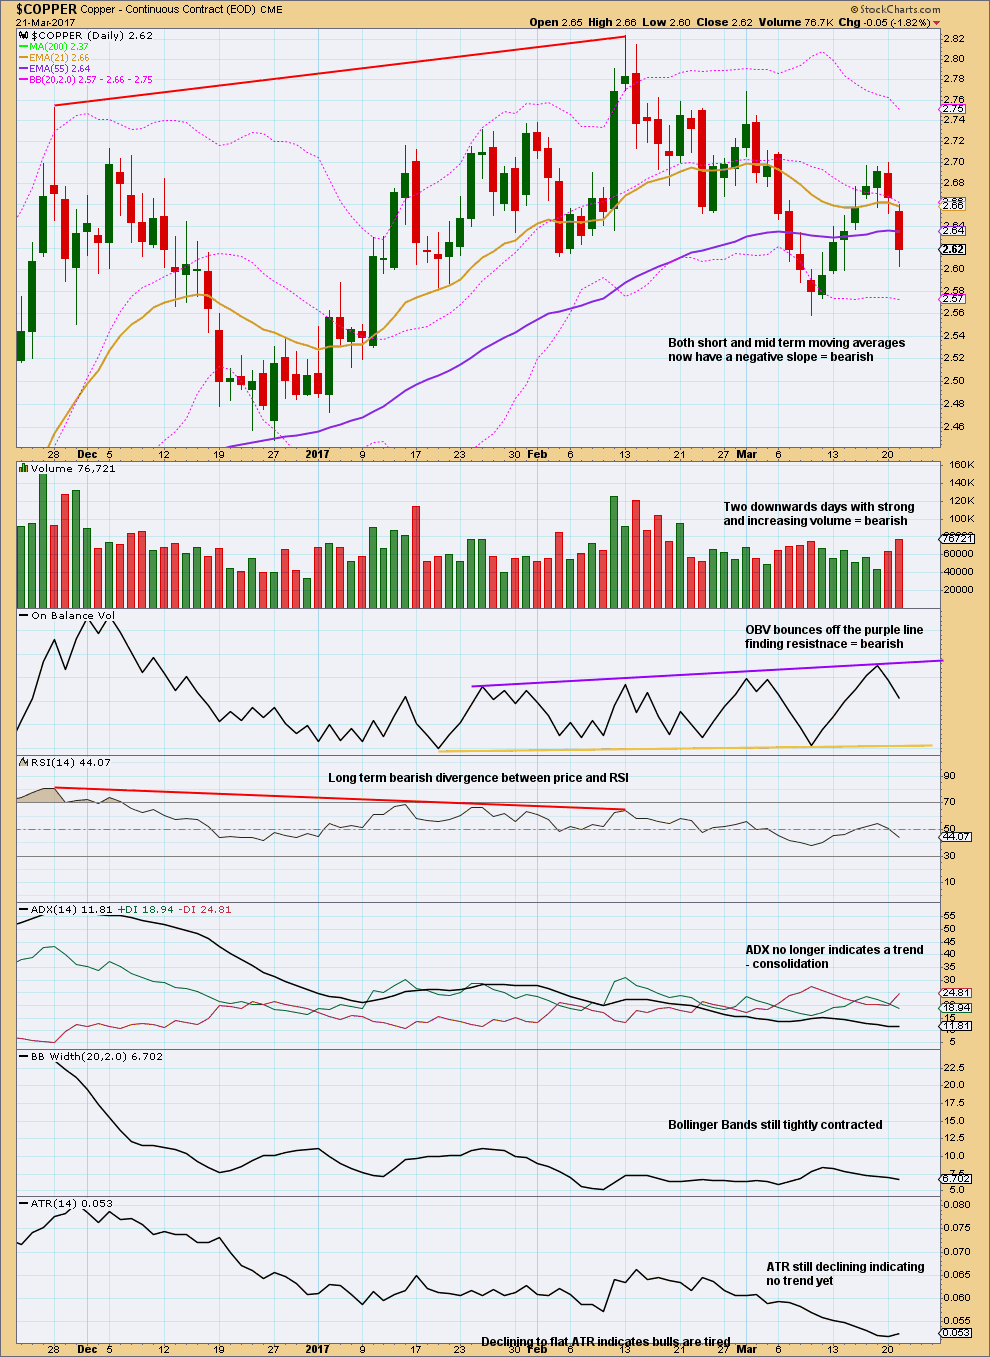
Click chart to enlarge. Chart courtesy of StockCharts.com.
The first movement downwards from the high on the 13th of February to the low of the 23rd of February was choppy and overlapping and came on overall declining volume. The market fell of its own weight.
The bounce up to the 1st of March came with some increase in volume. The volume profile looks slightly bullish up to this point, but not strongly.
The fall to the last low on the 9th of March came with increasing volume. This looks clearly bearish.
The next bounce to the high of the 20th of March came with clearly declining volume. This looks like a counter trend movement within a new downwards trend.
ADX has not yet indicated a downwards trend. It is below 15 although it is rising slightly today and the -DX line is above the +DX line.
Contracting Bollinger Bands and declining ATR suggest the market is not yet trending.
The most bearish part of this chart is the recent volume profile. Other indicators suggest caution for short positions.
ELLIOTT WAVE ANALYSIS
Click chart to enlarge.
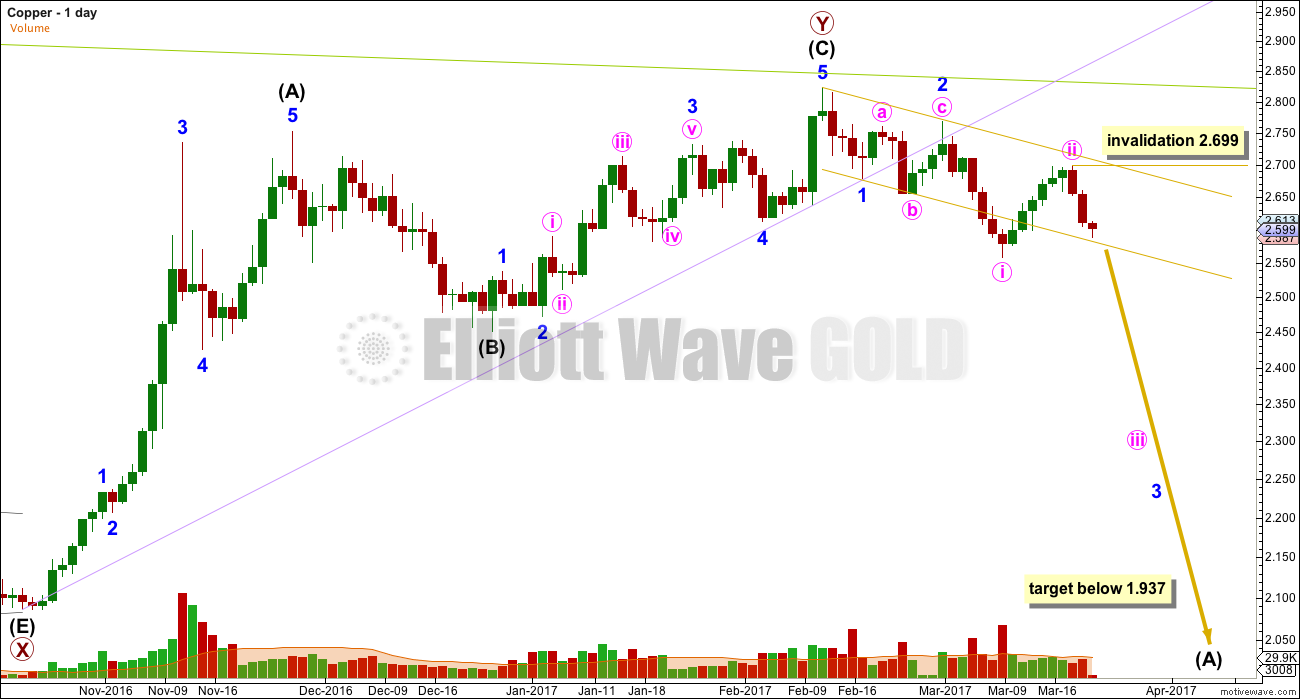
Copper may be in the very early stages of a new downwards trend. The green trend line goes back to August 2011 and has recently provided resistance. After price breached the lower edge of the lilac line, it then turned up to find resistance at that line for a typical throwback.
The gold channel is a base channel about minor waves 1 and 2. The upper edge has provided resistance for another second wave correction. The lower edge may now be providing some support. If this Elliott wave count is correct, then Copper should break below support at the lower edge of this channel. It may then turn upwards for a test of resistance before moving down and away.
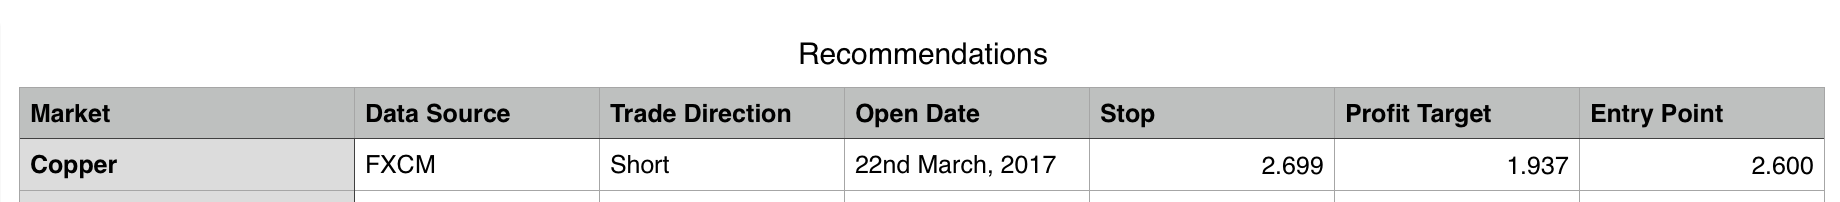
Trading advice for members only: [wlm_private “GOLD Daily YT|GOLD Daily NT|GOLD Daily NTGR|GOLD DAILY 6M NT|GOLD DAILY 6M YT|GOLD DAILY 6M NT GFR|GOLD Plus Daily YT|GOLD Plus Daily NT|OIL SILVER Weekly YT|OIL SILVER Weekly NT|GOLD Plus Daily 6M NT|GOLDPLUSDAY6M|OIL SILVER Weekly 6M NT|GOLDPLUSDAY1M|GOLDPLUSDAY1MYT|GOLDDAY6M|GOLDDAY1M|GOLDDAY1MYT|OILSILVERWEEK6M|OILSILVERWEEK1M|OILSILVERWEEK1MYT”]Stops may be set just above the last swing high of the 20th of March at 2.699. Targets may be 1.937 in the first instance. Price may bounce up for a day or so from the gold trend line, so be prepared to hold an underwater position for a few days. If price slices through this trend line, then look for a possible throwback to test resistance. If that happens, then enter short if price again comes to touch the lower edge of the channel.[/wlm_private]
DISCLAIMER
As always, it is essential that anyone using this analysis for trading advice manages risk carefully. Follow my two Golden Rules:
1. Always use a stop.
2. Never invest more than 1-5% of equity on any one trade.
Trading is about probabilities, not certainties. Failure to follow my two Golden Rules of trading indicates failure to manage risk.
Accept that this analysis may be wrong. It is impossible for any analyst to predict with certainty what a market will do next.
TRADING ROOM SUMMARY TABLES
OPEN POSITIONS
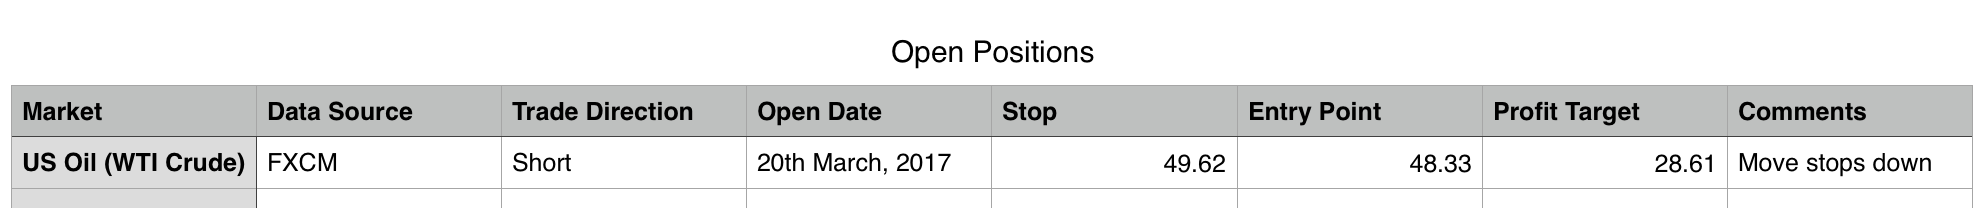
Click table to enlarge.
CLOSED POSITIONS
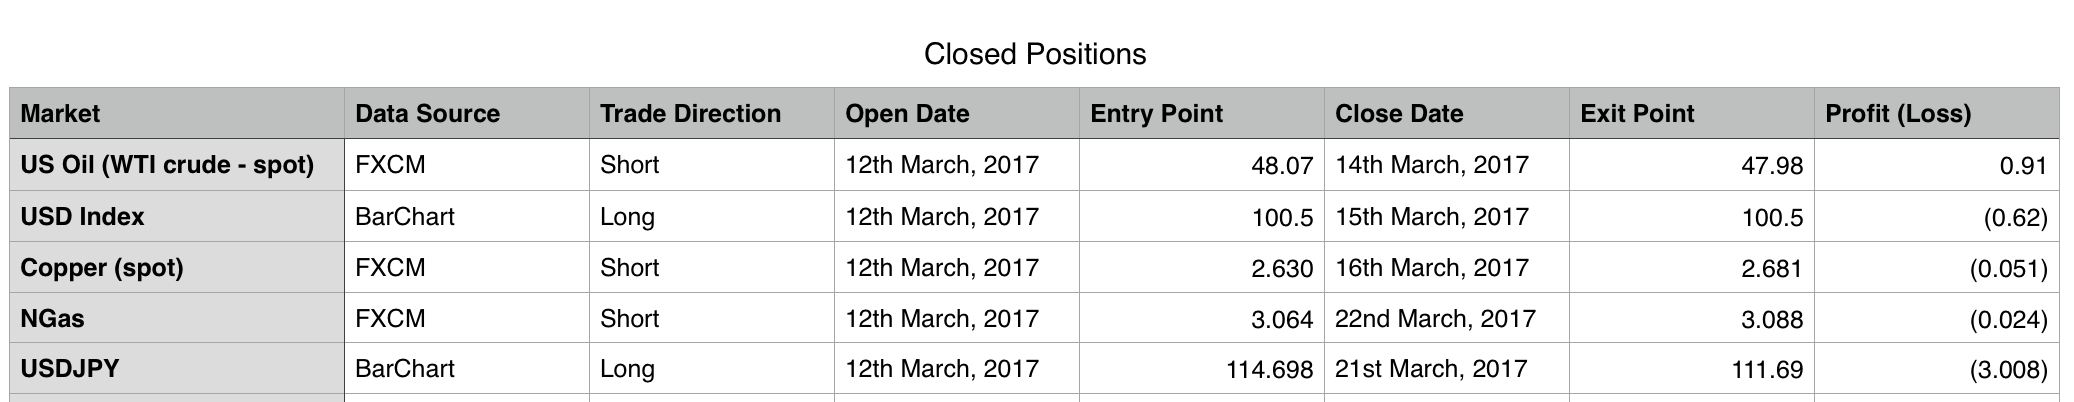
Click table to enlarge.
RECOMMENDATIONS
[wlm_private “GOLD Daily YT|GOLD Daily NT|GOLD Daily NTGR|GOLD DAILY 6M NT|GOLD DAILY 6M YT|GOLD DAILY 6M NT GFR|GOLD Plus Daily YT|GOLD Plus Daily NT|OIL SILVER Weekly YT|OIL SILVER Weekly NT|GOLD Plus Daily 6M NT|GOLDPLUSDAY6M|OIL SILVER Weekly 6M NT|GOLDPLUSDAY1M|GOLDPLUSDAY1MYT|GOLDDAY6M|GOLDDAY1M|GOLDDAY1MYT|OILSILVERWEEK6M|OILSILVERWEEK1M|OILSILVERWEEK1MYT”]
Click table to enlarge.[/wlm_private]
This analysis is published @ 02:07 a.m. EST.
Lara one question..
Can we assume that yesterdays correction in copper seems to be over now and can add shorts with stoploss
Nice
Hi Lara,
Could you please do an analysis of the FTSE in the Trading Forum – I think it is looking very bearish.
Many thanks.
Again a sudden rise in copper..
Position is underwater now
I know. It’s frustrating.
I did warn of this possibility though:
“Price may bounce up for a day or so from the gold trend line, so be prepared to hold an underwater position for a few days.”
Trading room is a very unique and helpful feature you have added lara…
Thank you