
A small correction unfolded over the last week as expected.
Summary: The target for downwards movement to end is minimum 28.61, with 25.59 reasonably likely. Move stops to either just above the swing high of the 16th of March (check your broker data for the exact price point) or to breakeven to eliminate risk (for positions opened close to the high of the 16th of March).
New updates to this analysis are in bold.
MONTHLY ELLIOTT WAVE COUNT
Click chart to enlarge.
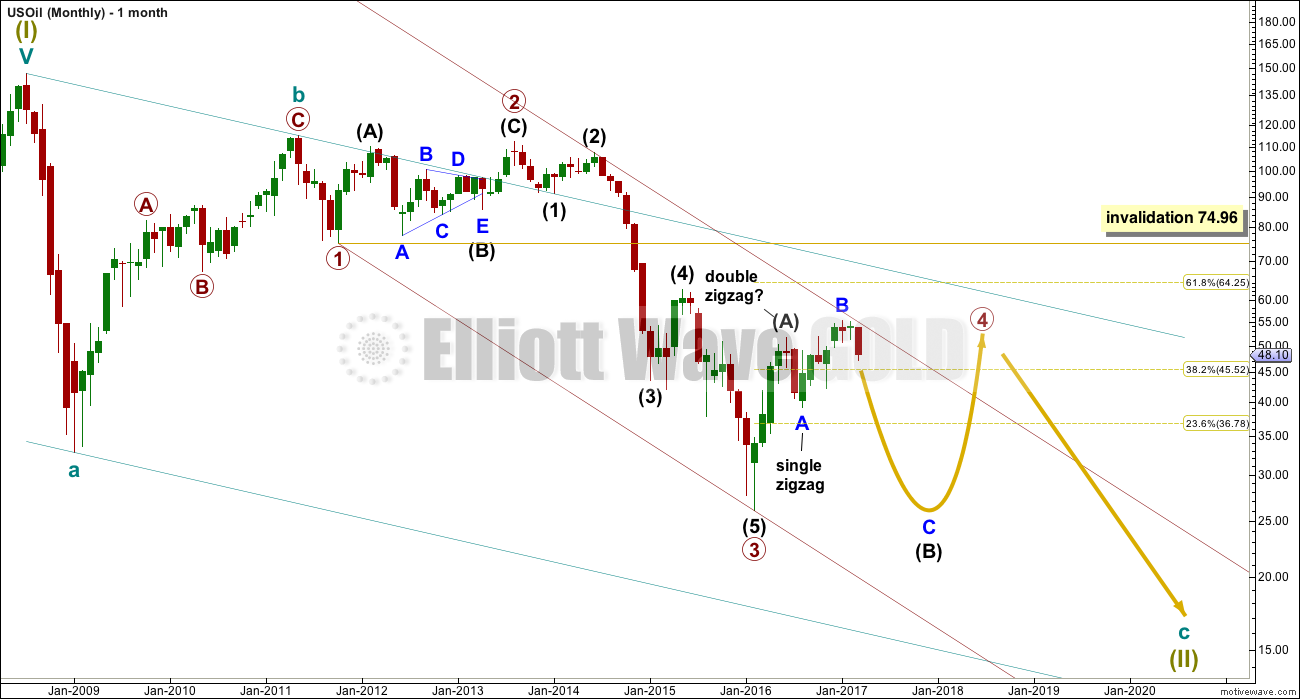
Within the bear market, cycle wave b is seen as ending in May 2011. Thereafter, a five wave structure downwards for cycle wave c begins.
Within cycle wave c, at this stage it does not look like primary wave 5 could be complete. That would only be possible if primary wave 4 was over too quickly.
Primary wave 1 is a short impulse lasting five months. Primary wave 2 is a very deep 0.94 zigzag lasting 22 months. Primary wave 3 is a complete impulse with no Fibonacci ratio to primary wave 1. It lasted 30 months.
Primary wave 4 is likely to exhibit alternation with primary wave 2. Primary wave 4 is most likely to be a flat, combination or triangle. Within all of these types of structures, the first movement subdivides as a three. The least likely structure for primary wave 4 is a zigzag.
Primary wave 4 is likely to end within the price territory of the fourth wave of one lesser degree; intermediate wave (4) has its range from 42.03 to 62.58.
If primary wave 4 is incomplete, then it looks like it may not remain contained within the channel. Sometimes fourth waves overshoot channels and this is why Elliott developed a second technique to redraw the channel when it does not contain a fourth wave.
Primary wave 4 is most likely to be shallow to exhibit alternation in depth with primary wave 2. So far it has passed the 0.382 Fibonacci ratio at 45.52. It may now continue to move mostly sideways in a large range.
Primary wave 4 may not move into primary wave 1 price territory above 74.96.
At this stage, primary wave 4 has completed intermediate wave (A) only. Intermediate wave (B) is incomplete.
WEEKLY ELLIOTT WAVE COUNT
Click chart to enlarge.
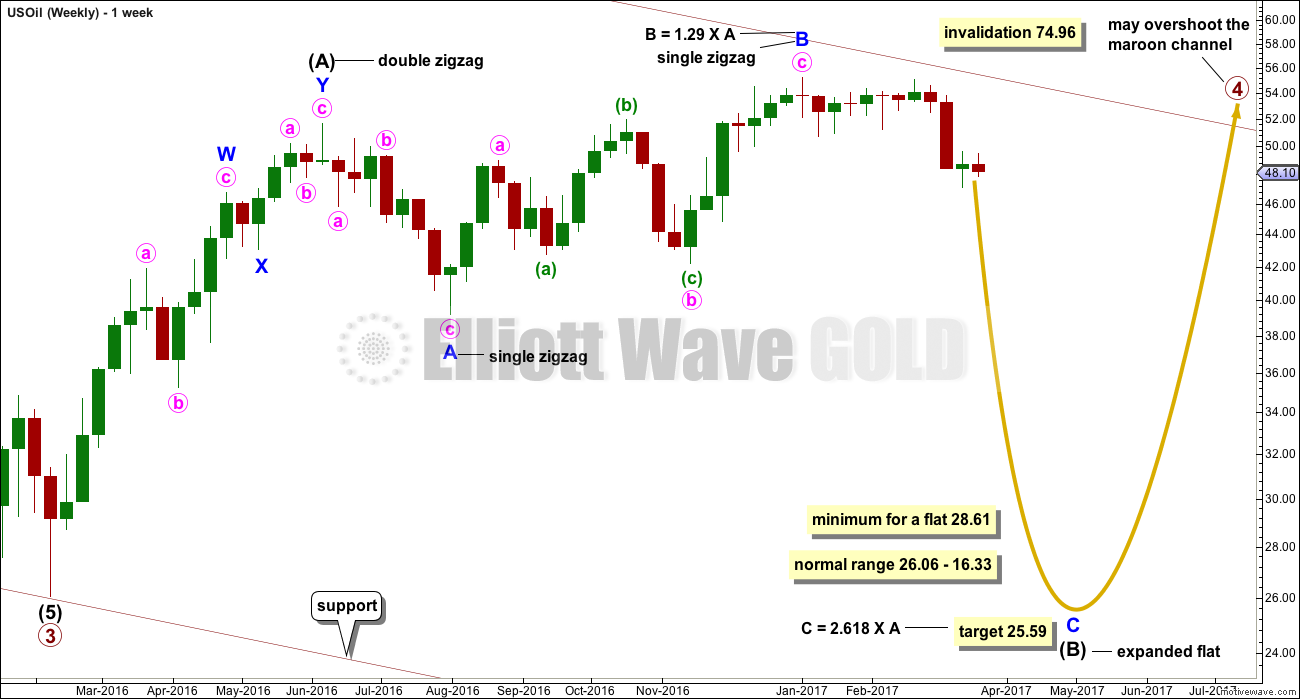
The whole structure of primary wave 4 is seen here in more detail.
The first wave labelled intermediate wave (A) is seen as a double zigzag, which is classified as a three.
Intermediate wave (B) is also a three. This means primary wave 4 is most likely unfolding as a flat correction if my analysis of intermediate wave (A) is correct. Flats are very common structures.
Intermediate wave (B) began with a zigzag downwards. This indicates it too is unfolding most likely as a flat correction.
Within intermediate wave (B), the zigzag upwards for minor wave B is a 1.29 correction of minor wave A. This indicates intermediate wave (B) may be unfolding as an expanded flat, the most common type.
The normal range for intermediate wave (B) within a flat correction for primary wave 4 is from 1 to 1.38 the length of intermediate wave (A) giving a range from 26.06 to 16.33.
Primary wave 4 may not move into primary wave 1 price territory above 74.96.
Within the larger expanded flat correction of primary wave 4, intermediate wave (B) must retrace a minimum 0.9 length of intermediate wave (A) at 28.61 or below.
DAILY ELLIOTT WAVE COUNT
Click chart to enlarge.
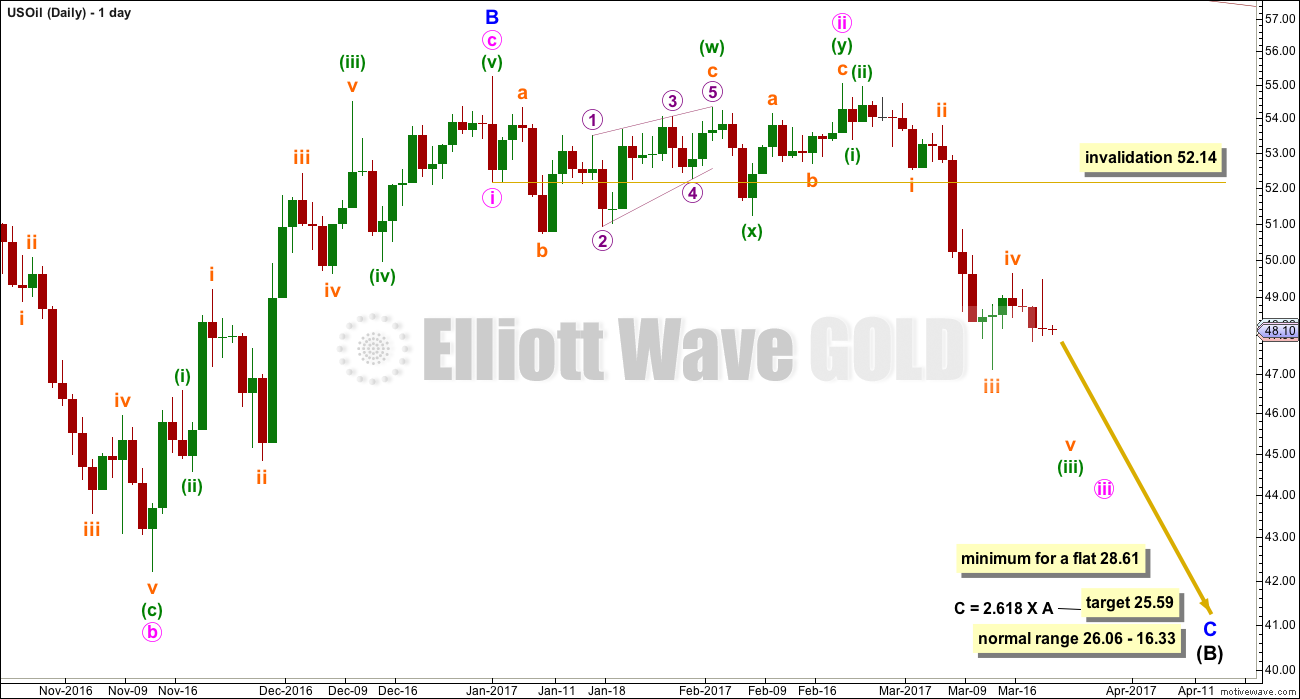
Minor wave C downwards must subdivide as a five wave structure.
Within minor wave C, minute wave iii now looks to be underway and may have passed its middle portion. A first possible target for it to end may be at 46.91 where it would reach 2.618 the length of minute wave i. If price keeps falling through this first target, then the next target may be at 41.90 where it would reach 4.236 the length of minute wave i.
Within minor wave C, minute wave i is not extended. This means that either or both of minute waves iii and v may be extended. For commodities it is very common for fifth waves to be strong extensions.
Within the middle of minute wave iii, subminuette wave iii is just 0.41 longer than 2.618 the length of subminuette wave i. Subminuette wave iv may be over here; if it is, it would have good proportion to subminuette wave ii.
When minute wave iv arrives it should last at least two weeks. It is most likely to be a zigzag or triangle. It may not move into minute wave i price territory above 52.14.
TECHNICAL ANALYSIS
DAILY CHART
Click chart to enlarge. Chart courtesy of StockCharts.com.
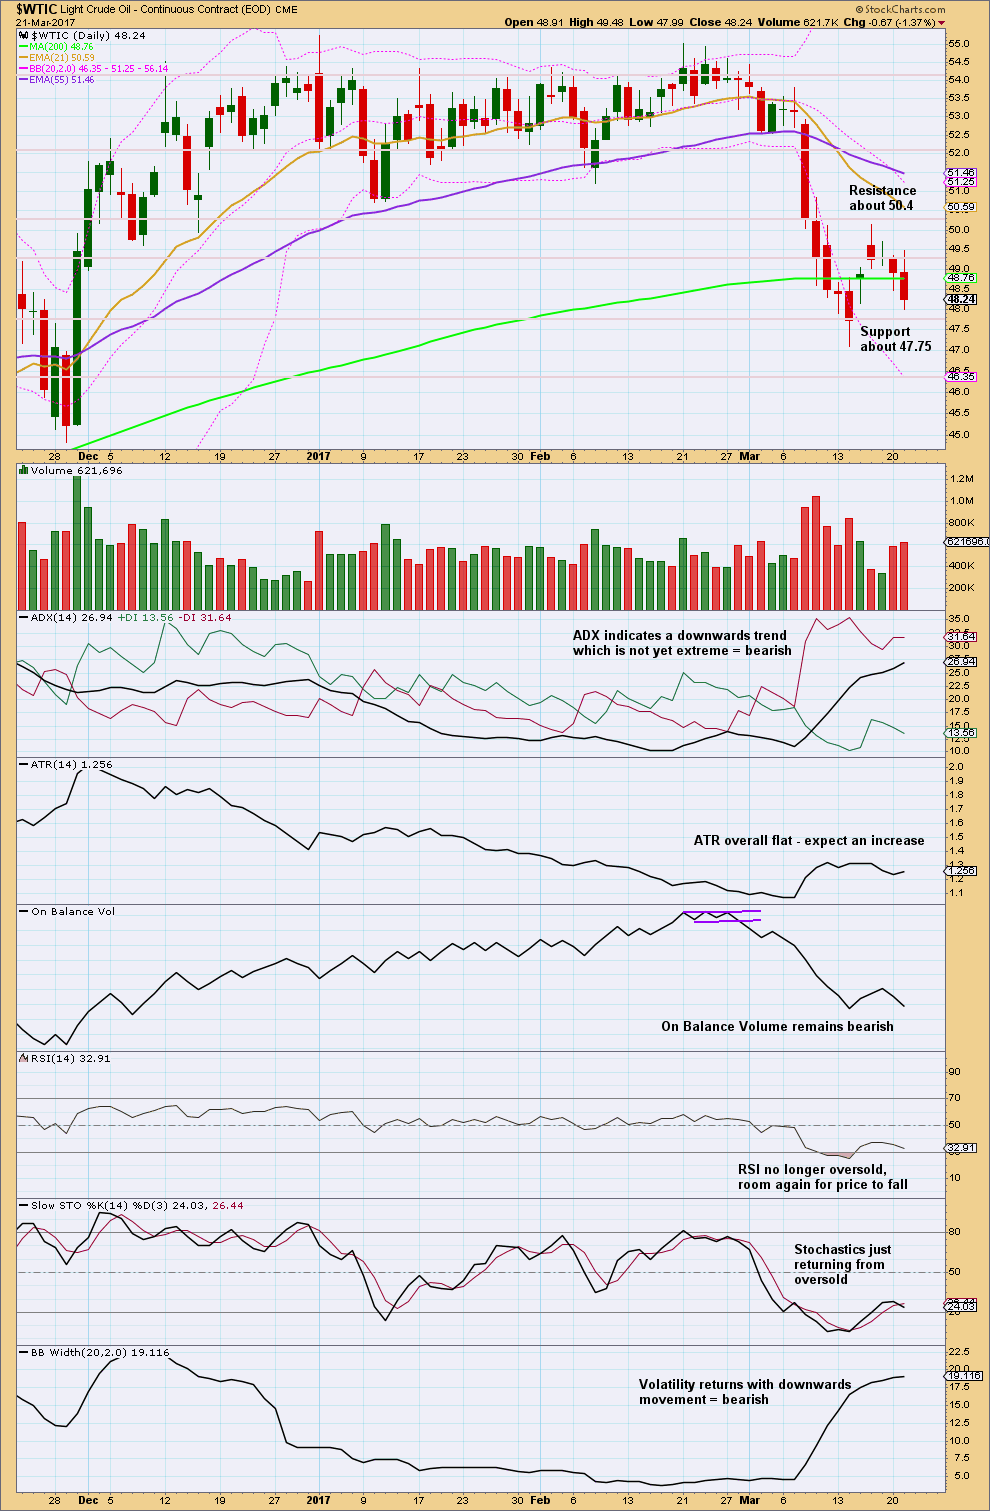
Today’s strong downwards day comes with an increase in volume, which supports the fall in price.
The last two downwards days have stronger volume than the prior three days. This looks like a small consolidation within the downwards trend has now ended and the last two days look like the resumption of the downwards trend.
ADX indicates this trend has still room to continue. RSI and Stochastics are no longer oversold. There is room for price to fall again.
Members who opened short positions after yesterday’s Trading Room post may now move stops either to just above the last swing high at 50.14 (on StockCharts data), or to breakeven to eliminate risk. If opening new short positions here, be prepared to hold an underwater position for a day or two. If this analysis is correct, it should not be for longer than that.
As always remember my two Golden Rules for trading:
1. Always use a stop.
2. Never invest more than 1-5% of equity on any one trade.
VOLATILITY INDEX
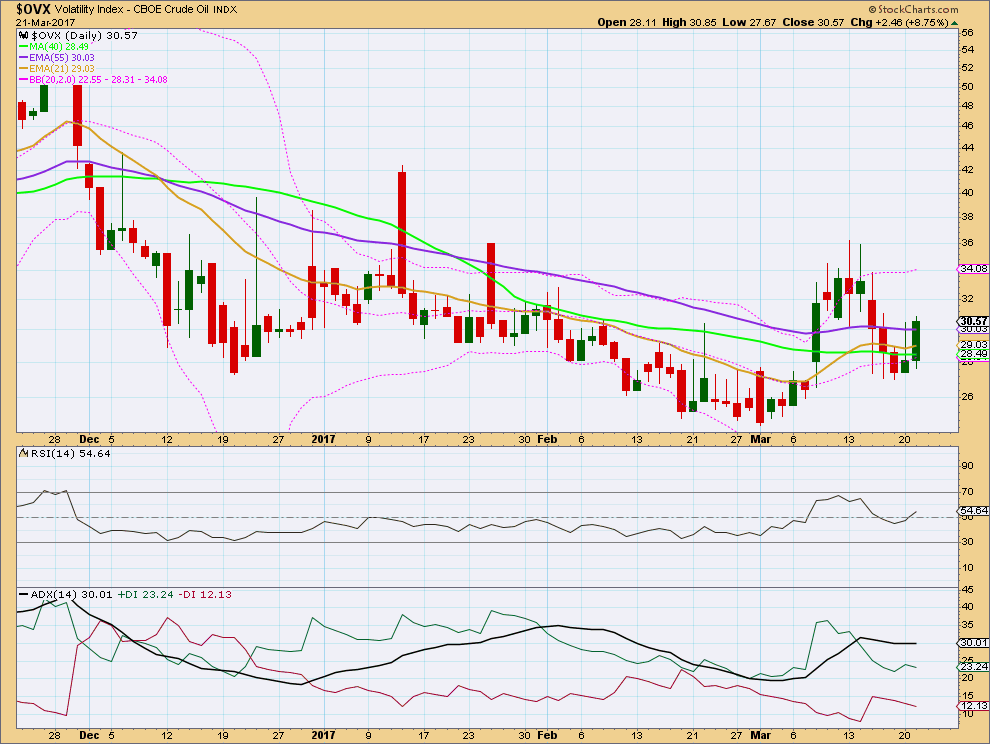
Click chart to enlarge. Chart courtesy of StockCharts.com.
Normally, volatility should decline as price rises and volatility should increase as price falls. Divergence from this normal can provide a bullish or bearish signal for Oil.
Bullish divergence noted in last analysis was followed by a small bounce in price. There is no new divergence noted today.
This analysis is published @ 01:50 a.m. EST.