
Price is now moving sideways again. Some strategies for traders are outlined today.
Summary: Oil looks to have entered a new consolidation. Wait for it to develop further. The breakout will be expected to be downwards but not yet.
New updates to this analysis are in bold.
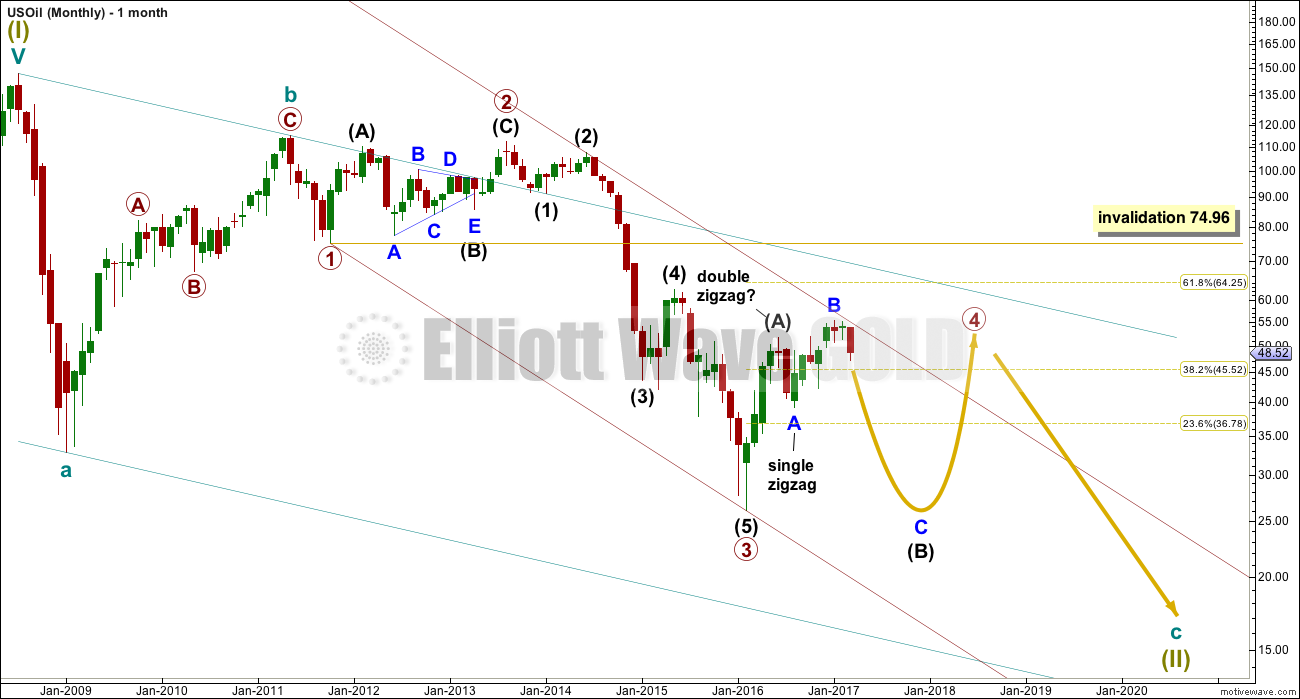
MONTHLY ELLIOTT WAVE COUNT
Click chart to enlarge.
Within the bear market, cycle wave b is seen as ending in May 2011. Thereafter, a five wave structure downwards for cycle wave c begins.
Within cycle wave c, at this stage it does not look like primary wave 5 could be complete. That would only be possible if primary wave 4 was over too quickly.
Primary wave 1 is a short impulse lasting five months. Primary wave 2 is a very deep 0.94 zigzag lasting 22 months. Primary wave 3 is a complete impulse with no Fibonacci ratio to primary wave 1. It lasted 30 months.
Primary wave 4 is likely to exhibit alternation with primary wave 2. Primary wave 4 is most likely to be a flat, combination or triangle. Within all of these types of structures, the first movement subdivides as a three. The least likely structure for primary wave 4 is a zigzag.
Primary wave 4 is likely to end within the price territory of the fourth wave of one lesser degree; intermediate wave (4) has its range from 42.03 to 62.58.
If primary wave 4 is incomplete, then it looks like it may not remain contained within the channel. Sometimes fourth waves overshoot channels and this is why Elliott developed a second technique to redraw the channel when it does not contain a fourth wave.
Primary wave 4 is most likely to be shallow to exhibit alternation in depth with primary wave 2. So far it has passed the 0.382 Fibonacci ratio at 45.52. It may now continue to move mostly sideways in a large range.
Primary wave 4 may not move into primary wave 1 price territory above 74.96.
At this stage, primary wave 4 has completed intermediate wave (A) only. Intermediate wave (B) is incomplete.
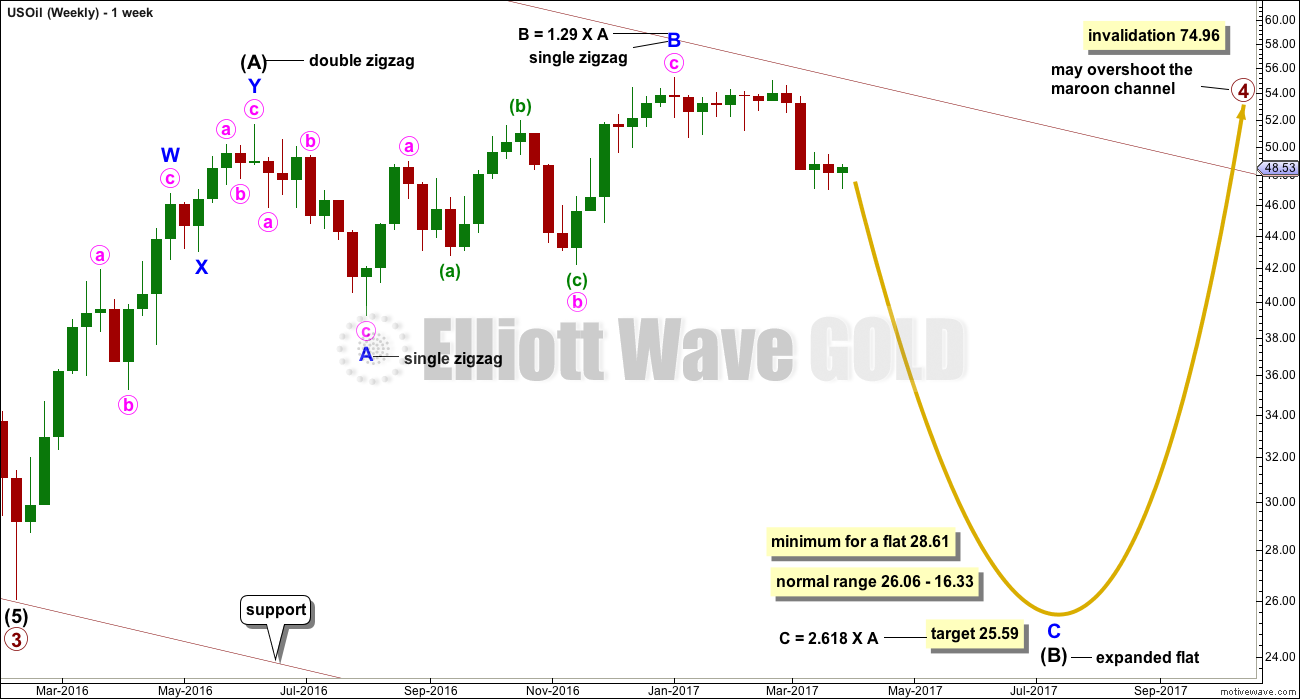
WEEKLY ELLIOTT WAVE COUNT
Click chart to enlarge.
The whole structure of primary wave 4 is seen here in more detail.
The first wave labelled intermediate wave (A) is seen as a double zigzag, which is classified as a three.
Intermediate wave (B) is also a three. This means primary wave 4 is most likely unfolding as a flat correction if my analysis of intermediate wave (A) is correct. Flats are very common structures.
Intermediate wave (B) began with a zigzag downwards. This indicates it too is unfolding most likely as a flat correction.
Within intermediate wave (B), the zigzag upwards for minor wave B is a 1.29 correction of minor wave A. This indicates intermediate wave (B) may be unfolding as an expanded flat, the most common type.
The normal range for intermediate wave (B) within a flat correction for primary wave 4 is from 1 to 1.38 the length of intermediate wave (A) giving a range from 26.06 to 16.33.
Primary wave 4 may not move into primary wave 1 price territory above 74.96.
Within the larger expanded flat correction of primary wave 4, intermediate wave (B) must retrace a minimum 0.9 length of intermediate wave (A) at 28.61 or below.
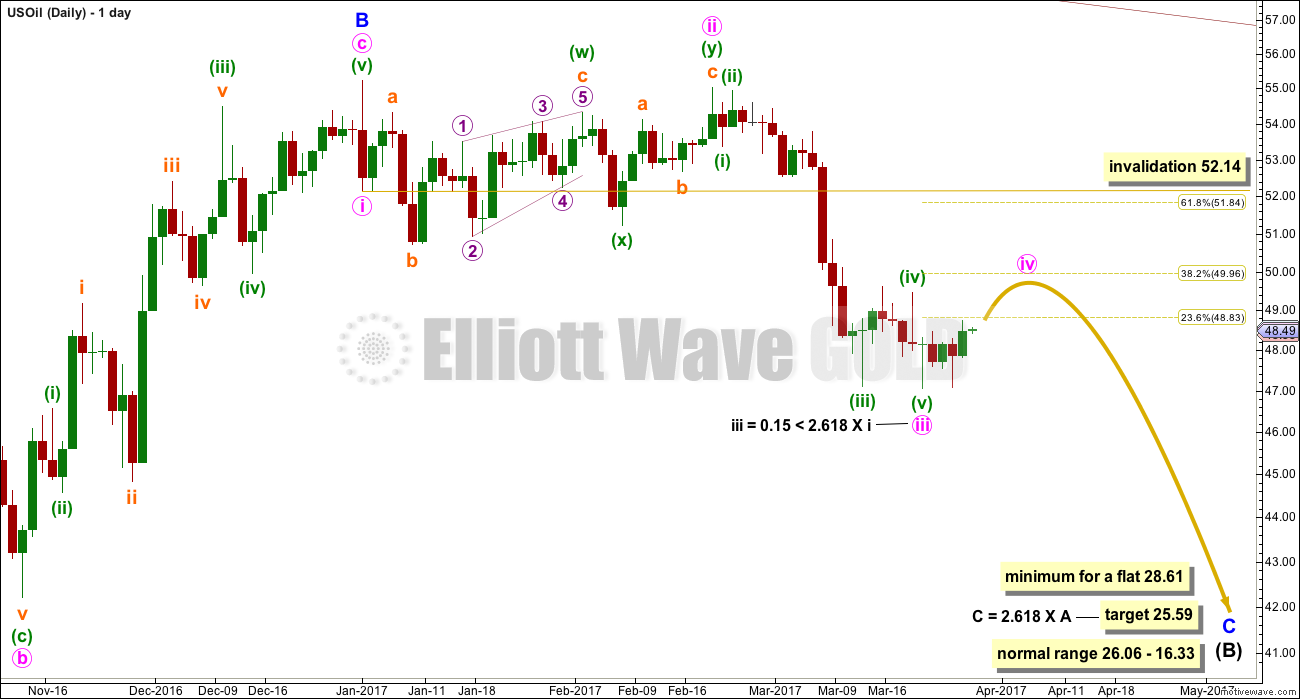
DAILY ELLIOTT WAVE COUNT
Click chart to enlarge.
Minor wave C downwards must subdivide as a five wave structure.
Minute wave iii looks now to have ended 0.15 short of the first target given. It exhibits a Fibonacci ratio to minute wave i.
Minute wave ii was a time consuming and very deep double combination. Given the guideline of alternation, minute wave iv may be expected to be a more shallow correction. It would most likely be a single or double zigzag, but it may also be a triangle and exhibit reasonable alternation.
Minute wave iv is most likely to end close to the 0.382 Fibonacci ratio of minute wave iii at 49.96.
Minute wave ii lasted 35 days, one more than a Fibonacci 34. If minute wave iv is a single or double zigzag, then it should be more brief, as these are quicker structures. Minute wave iv may last a Fibonacci 8, 13 or possibly 21 days. Look out for it to possibly be fairly brief; the power of the upcoming extended fifth wave may pull it down and force it to be more brief than otherwise expected.
Minute wave v downwards may be a very strong, swift and extended wave. It may end with a selling climax, which is typical for commodities.
Minute wave iv may not move into minute wave i price territory above 52.14.
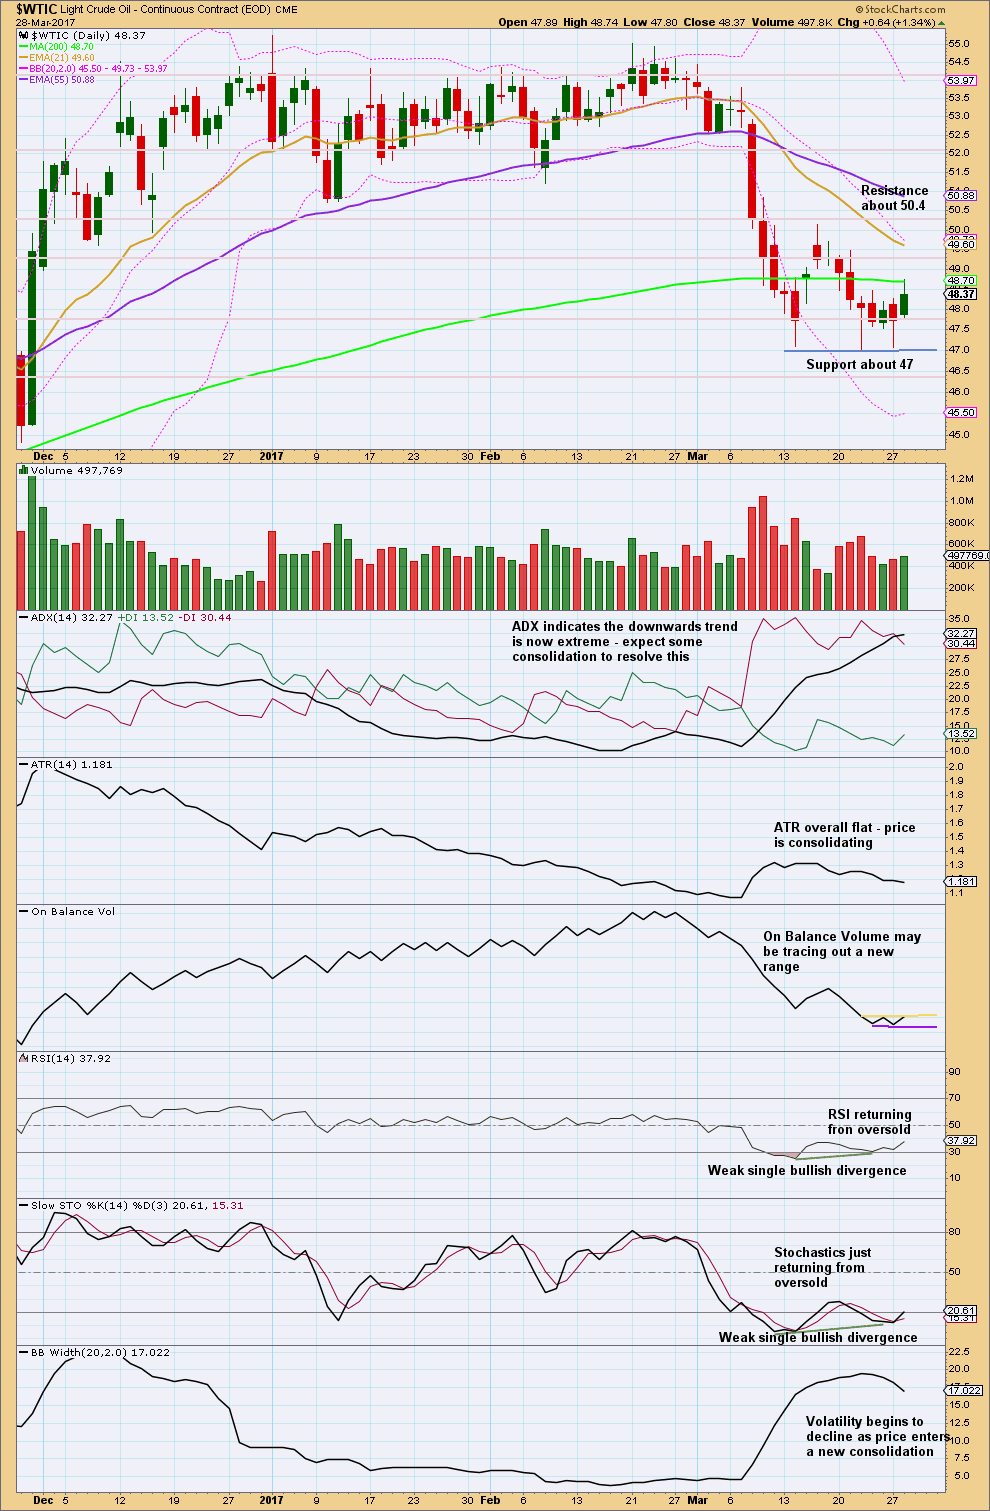
TECHNICAL ANALYSIS
DAILY CHART
Click chart to enlarge. Chart courtesy of StockCharts.com.
Volume is overall declining and price is moving sideways within a range of about 50.4 to 47.
ADX has reached extreme today. This supports the daily Elliott wave count.
The trend lines on On Balance Volume will probably be redrawn as the consolidation continues sideways. They are only drawn tentatively today; these lines do not offer good technical significance yet.
There are a few strategies to trading this market at this time:
1. Wait patiently for the consolidation to continue. Look for a breakout and enter in the direction of the breakout.
2. Open a hedge with a stop for each direction just beyond support and resistance. The losing position should be automatically closed upon a breakout and the winning position held. This risks one side of the hedge being whipsawed out if the range expanded but price does not break out.
3. Wait for the consolidation to continue for a few days yet. When On Balance Volume gives a signal, then enter a position in the direction which is expected for the eventual breakout.
4. Use a range bound approach (only for more experienced traders). Using a lower time frame, expect price to swing from support to resistance and back again and use Stochastics to indicate when one swing ends and the next begins. Warning: Price does not move in straight lines when it consolidates, so this approach is very risky.
My advice to most members would be to wait patiently at this stage. It is the trades you don’t take which often make the difference between profit and loss. Exerting patience and discipline can be well rewarded.
VOLATILITY INDEX
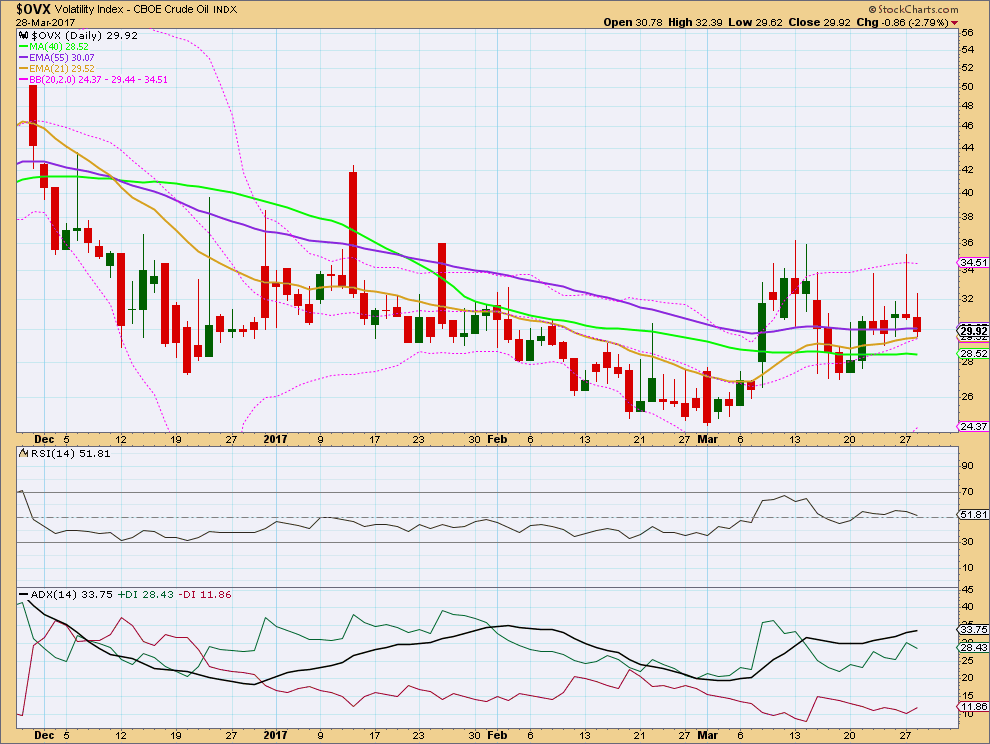
Click chart to enlarge. Chart courtesy of StockCharts.com.
Normally, volatility should decline as price rises and volatility should increase as price falls. Divergence from this normal can provide a bullish or bearish signal for Oil.
Volatility is increasing, but the trend is now extreme. Expect some consolidation here. This supports the Elliott wave count.
This analysis is published @ 10:10 p.m. EST.
Lara, any way to see the low of 47 as end of minute i and now we’re in a minute ii upwards correction?
If we’re still in an overall downwards movement, today presents a good opportunity to re-enter short positions as we are very close to upper bollinger bands and are overbought on slow stochastic…
Currently at crucial level – EMA 50 and c = 2.618*a
I will be a bit concerned if price continues higher through this zone, but actually expect we maybe topping around here.
So far so good…
I’ve exited my shorts. I will go back in at a lower level once downtrend confirmed.
Lara,
Is Minute Wave iv over at 50.47? It appears to have completed Wave(c) of Minute iv?
Any thoughts as it lasted just 6 days so far?
I cannot see any weakness in this upwards movement for Oil. Volume supports it, rising for three days in a row. Although volume for these last three upwards days is still lighter than for prior downwards days.
The candlesticks are bullish, Three Advancing White Soldiers.
On Balance Volume gives a very weak bullish signal.
RSI and Stochastics are neutral, they’re not yet overbought, so there’s room for upwards movement to continue.
Right now I’m actually quite concerned that my wave count may be wrong. I’m sitting on the sidelines for Oil, rightly or wrongly, until the situation is clearer.
If price breaks above 52.14 then minor wave C may be an ending diagonal. That would be my alternate idea.
Lara,
Thanks and agree momentum is still to the upside with three strong candles.