
A classic upwards breakout has unfolded as expected. In last analysis members were advised to enter a hedge or just enter long. With stops for long positions just below 1,240.24 or 1,221 (depending on trading strategy), members should now have profitable long positions. Short hedges, if entered, should have been automatically closed just above 1,269.72.
Trading advice for profit taking and managing long positions is given today.
It is time to step back and look at the bigger picture. Today’s analysis updates monthly and weekly charts.
Summary: The strongest move is still most likely ahead. In the very short term, a small correction may unfold and find support at the upper edge of the pink base channel on the hourly chart.
New updates to this analysis are in bold.
Grand SuperCycle analysis is here.
MAIN ELLIOTT WAVE COUNT
MONTHLY CHART
Click chart to enlarge.
Elliott wave is fractal, so it is important if members have not already done so that they review the Grand Super Cycle analysis linked to above at the start of each daily report.
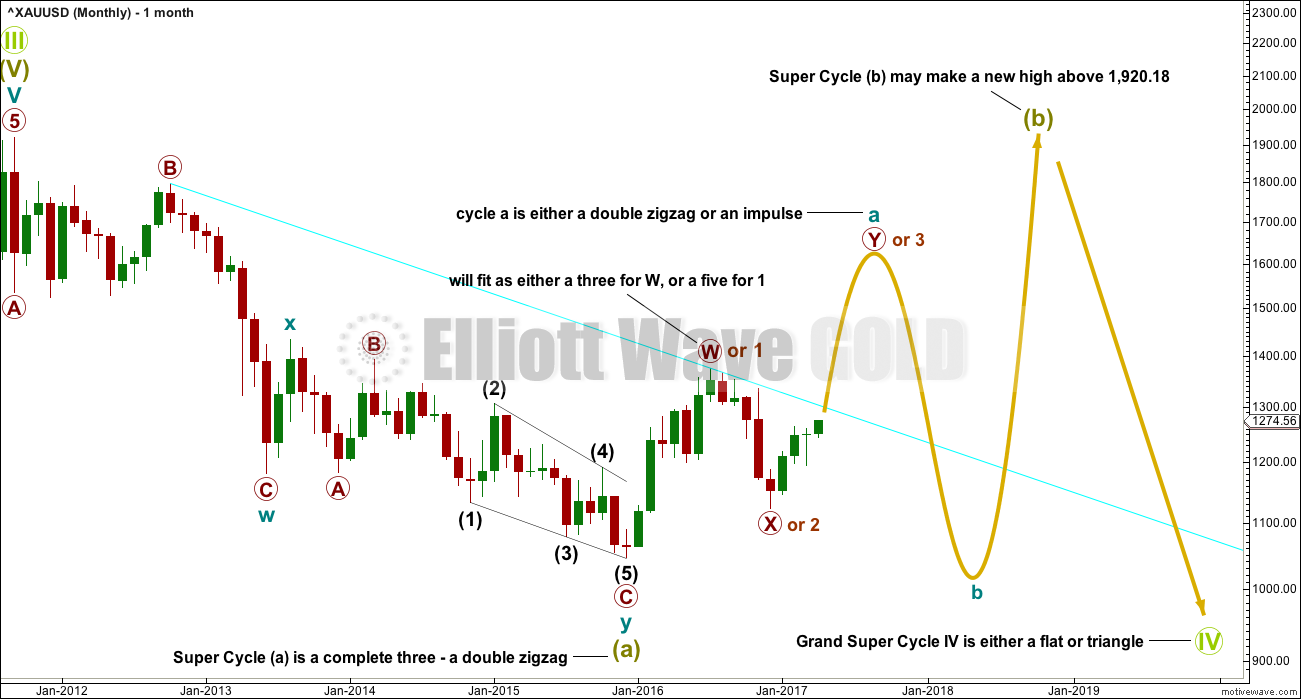
Downwards movement from the all time high to the low of December 2015 fits best as a double zigzag. It may also fit as an impulse and this possibility is covered in the alternate monthly chart below.
The new wave beginning at the all time high in September 2011 is expected to be at Grand Super Cycle degree. It would be highly unlikely to be over at the low on December 2015 because that would be too brief. This would more likely be only wave A of a larger correction for Grand Super Cycle wave IV.
If the first wave down within Grand Super Cycle wave IV is a three (double zigzags are classified as threes), then Grand Super Cycle wave IV may be a flat or triangle. It may not be a combination if Super Cycle wave (a) is a multiple, because the maximum limit to multiples is three. To label multiples within multiples increases the maximum beyond three, violating the Elliott wave rule.
If Grand Super Cycle wave IV is either a running triangle or expanded flat, then within it Super Cycle wave (b) may make a new all time high above 1,920.18.
If Grand Super Cycle wave IV is a flat correction, then within it Super Cycle wave (b) must retrace a minimum 0.9 length of Super Cycle wave (a) at 1,832.79.
If Grand Super Cycle wave IV is a triangle, there is no minimum requirement for Super Cycle wave (b) to retrace. A common range for subwaves of triangles is about 0.8 to 0.9 of the prior wave (triangle subwaves are usually deep). This range would be about 1,745 to 1,833. So far Super Cycle wave (b) does not look complete; it is not nearly deep enough for the right look.
A cyan trend line is added today to all charts. Draw it from the high in October 2012 to the high in July 2016. This line has been tested five times. When price gets back up to this line, it is likely to offer strong resistance.
Super Cycle wave (b) may be any corrective structure. In order to achieve the depth required for the bigger picture here it would most likely be a single or multiple zigzag. It may also be an expanded flat.
FIRST WEEKLY CHART
Click chart to enlarge.
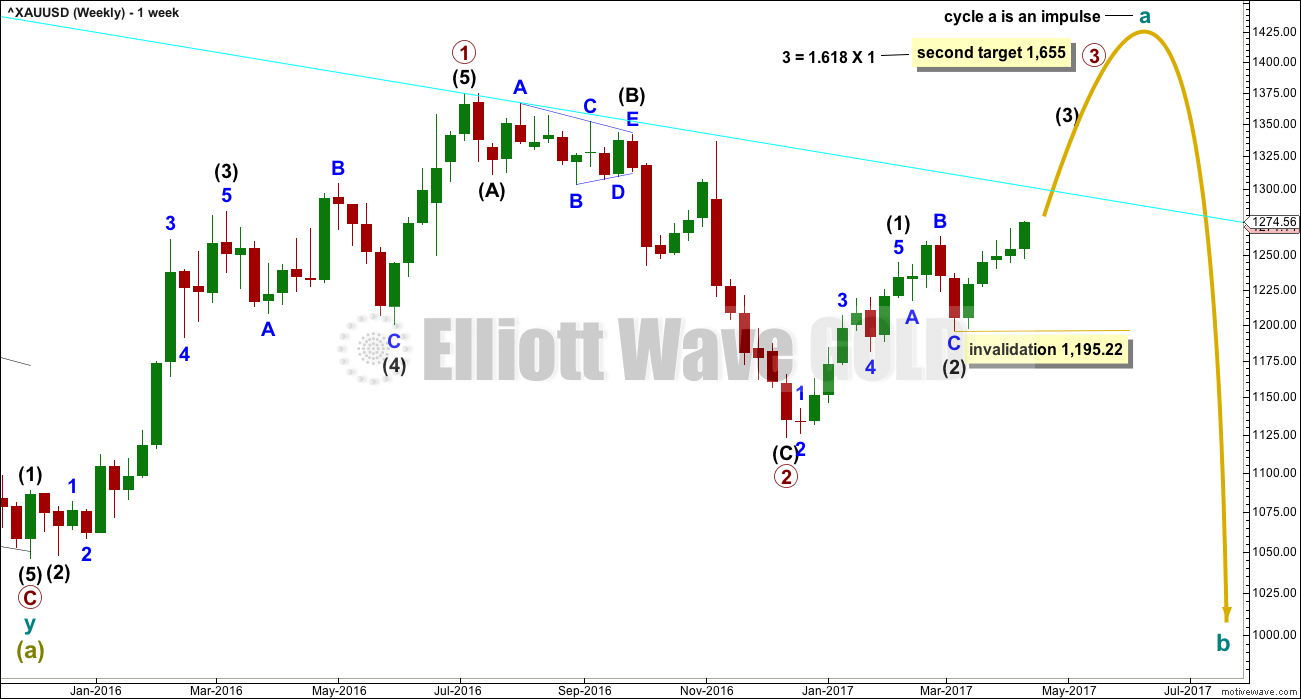
If Super Cycle wave (b) is unfolding as the most likely zigzag, then within it cycle wave a would unfold as a five wave structure.
This wave count does have the best fit in terms of subdivisions for the upwards movement labelled primary wave 1. This wave up fits best as a five wave impulse.
The next wave down for primary wave 2 fits best as a deep 0.77 zigzag.
Now within primary wave 3, intermediate waves (1) and (2) look complete. This wave count now expects to see a strong increase in upwards momentum as a big third wave unfolds. Intermediate wave (3) may only subdivide as an impulse.
Within intermediate wave (3), no second wave correction may move beyond the start of its first wave below 1,195.22.
SECOND WEEKLY CHART
Click chart to enlarge.
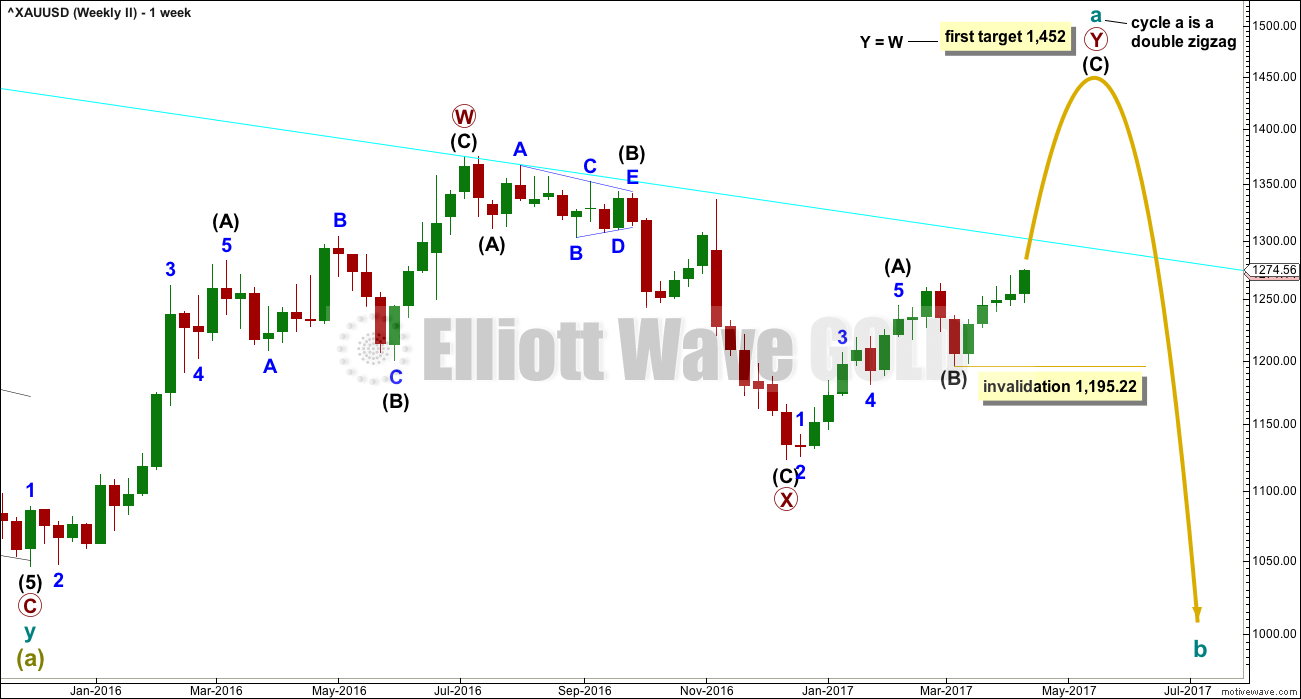
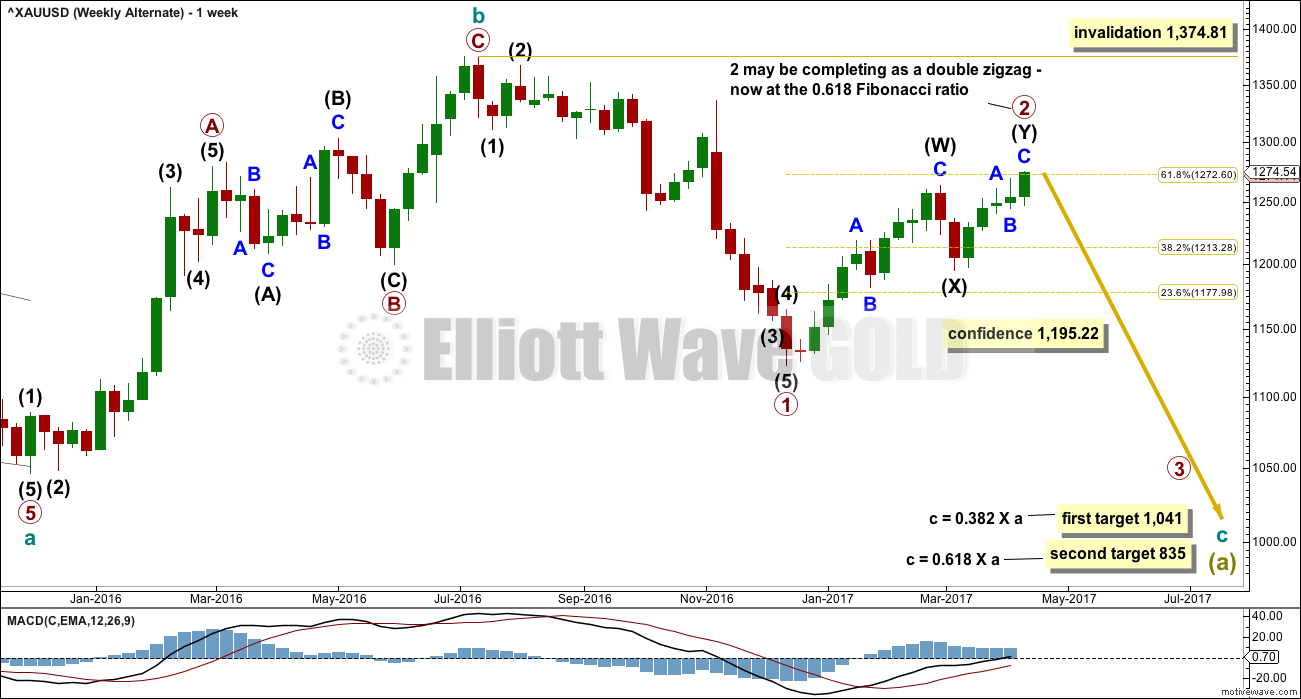
It is also possible that Super Cycle wave (b) may be unfolding as a flat correction. If it is, then within it cycle wave a should unfold as a “three”. It may be completing as a double zigzag.
The upwards wave labelled here primary wave W will fit as a completed zigzag. It does have a fairly strong three wave look to it.
The target for primary wave Y expects the most common Fibonacci ratio to primary wave W.
This wave count now expects some increase in upwards momentum as the middle of intermediate wave (C) moves higher. Intermediate wave (C) must subdivide as a five wave structure, either an impulse (more likely) or an ending diagonal (less likely).
The daily chart below will suffice for both weekly wave counts.
DAILY CHART
Click chart to enlarge.
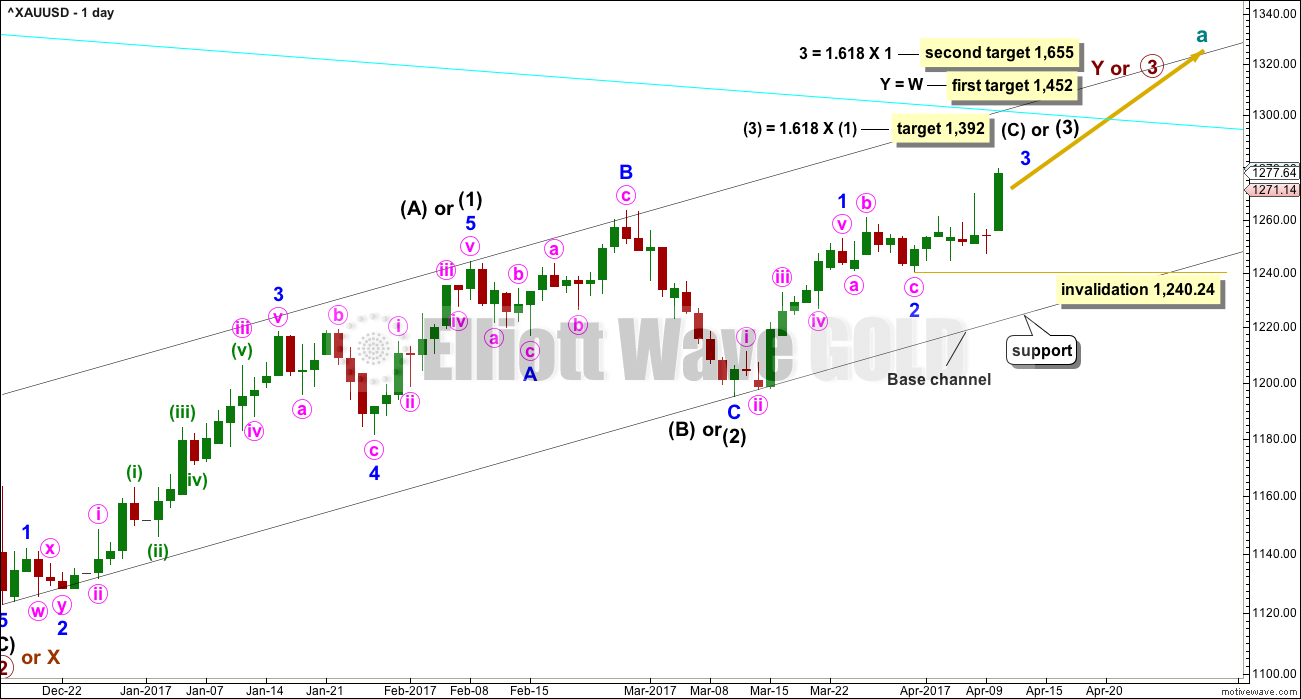
This daily chart will suffice for both weekly charts.
Upwards movement at primary degree is either a third wave (first weekly chart) to unfold as an impulse, or a Y wave (second weekly chart) to unfold as a zigzag. If upwards movement is a zigzag for primary wave Y, then it would be labelled intermediate waves (A) – (B) and now (C) to unfold.
Intermediate wave (1) or (A) is a complete five wave impulse lasting 39 days. Intermediate wave (2) or (B) looks like an expanded flat, which is a very common structure.
So far, within intermediate wave (3) or (C), minor waves 1 and 2 are now complete. Minor wave 3 looks to have begun. Within minor wave 3, no second wave correction may move beyond its start below 1,240.24.
The cyan trend line is still some distance away. This may be where minor wave 3 ends, or it may be only where minute wave iii within minor wave 3 ends.
HOURLY CHART
Click chart to enlarge.
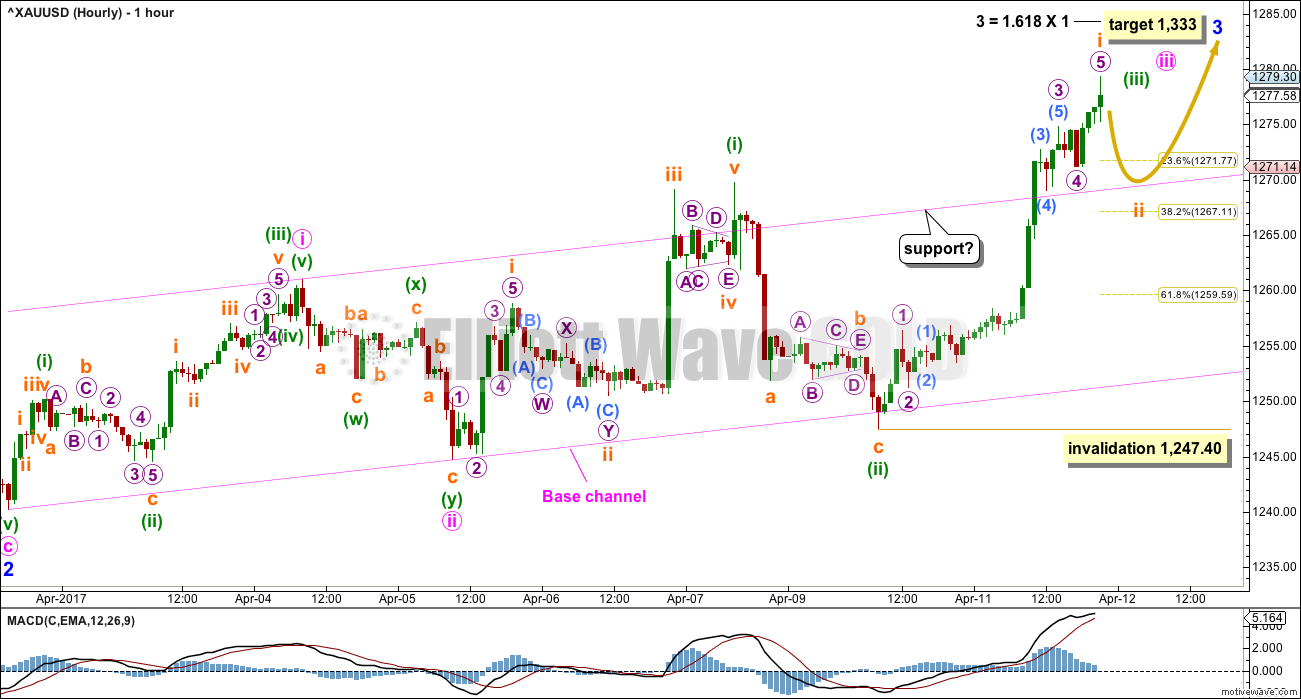
The middle of minor wave 3 may not yet have passed. I would not want to label minuette wave (iii) over at today’s high because that would not allow enough room for minuette wave (iv) to unfold and remain above minuette wave (i) price territory.
For this reason I am labelling only subminuette wave i complete.
Now subminuette wave ii may move price a little lower. It may not move beyond the start of subminuette wave i below 1,247.40.
Now that this third wave has shown enough power to break above the upper edge of the pink base channel, the upper edge may now provide support. It does not have to do this, but it usually does.
Now that the middle of a strong third wave may have begun corrections may begin to be a little less deep and time consuming. Subminuette wave ii may be forced to be shallow because of the upper edge of the base channel that provides support. If it moves back into the channel, then the 0.382 Fibonacci ratio may be a reasonable target.
Gold often exhibits strong extended third waves, and even stronger fifth waves. One or more of minor wave 3, intermediate wave (3) or primary wave 3 may end with blow off tops. The strongest upwards movement for this wave count is still ahead.
As price moves past the middle of the third wave the following corrections for fourth waves may be very brief and shallow indeed.
ALTERNATE ELLIOTT WAVE COUNT
MONTHLY CHART

Click chart to enlarge.
What if Super Cycle wave (a) is incomplete? It may be an incomplete zigzag.
This alternate sees the large wave down from the all time high to the low of December 2015 as a five wave impulse. If this is correct, then the larger correction for Super Cycle wave (a) would be incomplete and would be unfolding as a very common zigzag.
The bigger picture for Grand Super Cycle wave IV would be as either a flat, triangle or combination.
If Super Cycle wave (a) is a zigzag, then within it cycle wave b would most likely be a completed zigzag. Cycle wave c may now have begun as an impulse.
Within cycle wave b, the correction of primary wave 2 may not move beyond the start of primary wave 1 above 1,374.91.
WEEKLY CHART
Click chart to enlarge.
Primary wave 2 may be completing as a double zigzag.
This wave count now would expect an imminent end to primary wave 2, just above the 0.618 Fibonacci ratio of primary wave 1 at 1,272.60.
If price makes a new low below 1,195.22, then this alternate would become the main wave count. Prior to that point this alternate is judged to have a relatively low probability.
TECHNICAL ANALYSIS
WEEKLY CHART
Click chart to enlarge. Chart courtesy of StockCharts.com.
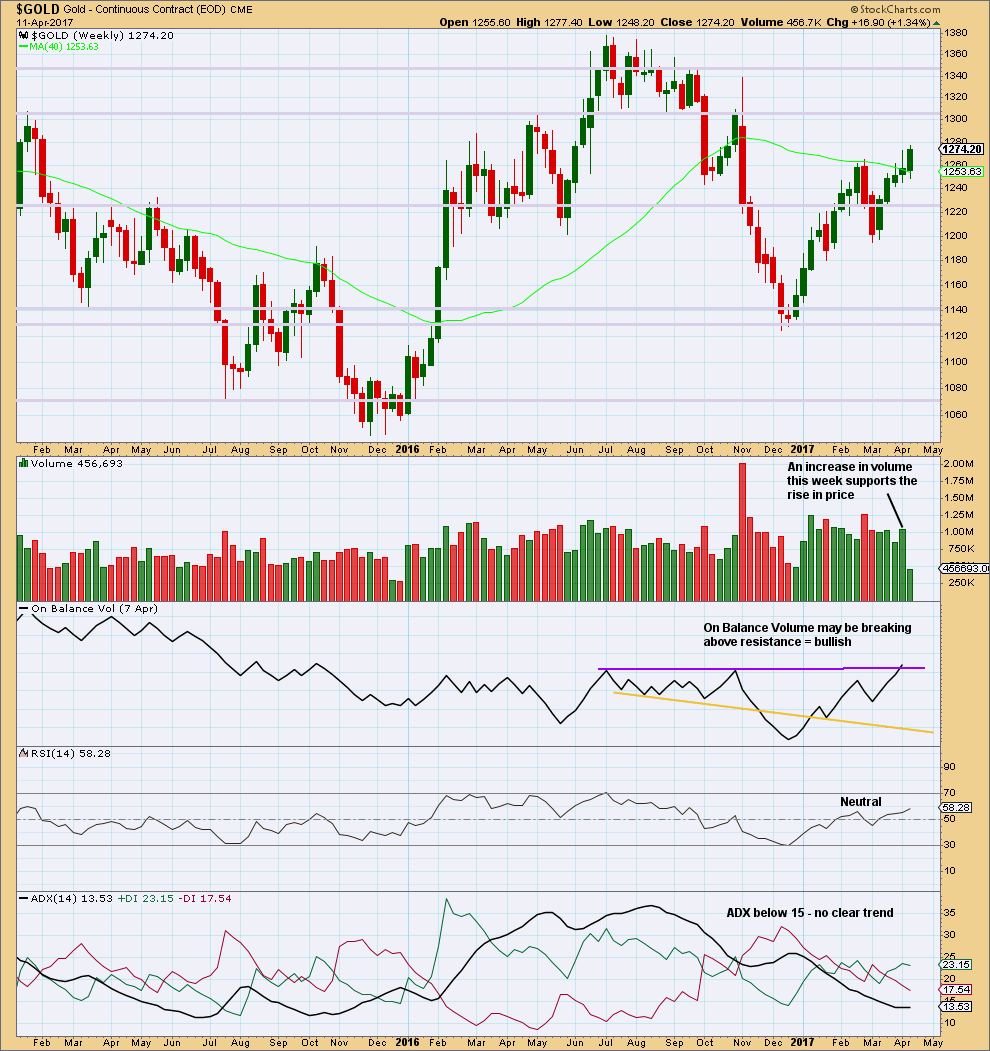
The relatively long upper wicks of the last two weekly candlesticks are a little bearish. The increase in volume last week is bullish.
The purple trend line on On Balance Volume has been carefully drawn to be as conservative as possible, sitting along the prior two highs. This trend line has a very shallow slope and is reasonably long held. It has only been tested twice before. It has some reasonable technical significance. Last week it is slightly breached offering a reasonable bullish signal. However, for the signal to have more weight it needs a clearer breach.
DAILY CHART
Click chart to enlarge. Chart courtesy of StockCharts.com.
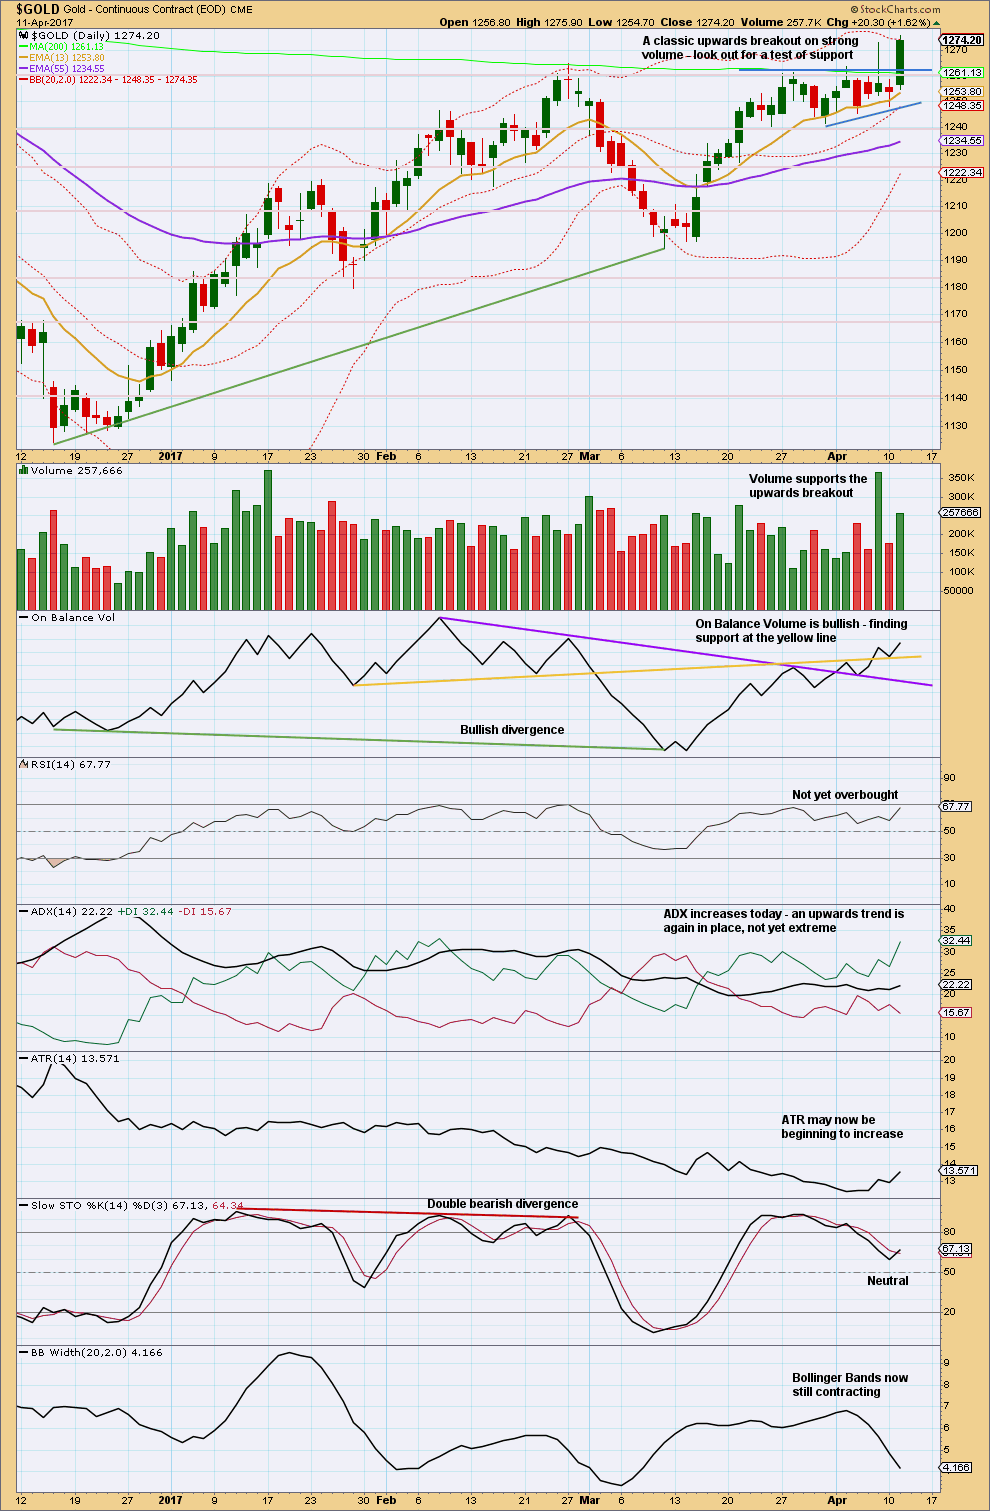
Today completes a classic upwards breakout from a consolidation. The breakout has support today from volume. Some confidence may be now had in an upwards trend.
Sometimes (not always) after a breakout price curves around to test support at prior resistance. It is possible here that a small pullback may unfold over a few days to end about prior resistance, about 1,263.
Both the short and mid term moving averages have a positive slope and price is above both of them. This looks like the trend is up for the short and mid term. The longer term 200 day moving average may now offer some support. It may be in the process of rolling over but for now still has a very slight negative slope.
On Balance Volume remains bullish. ADX is bullish. ATR today looks a little bullish.
The only concern here today is Bollinger Bands contracting as price moved strongly. This upwards movement today comes with some decline in volatility.
TRADING ADVICE
Technically, to avoid long positions being whipsawed out, stops should be set now just below 1,247.40. More cautious members may like to now move stops on long positions up to breakeven to eliminate risk. Positions opened close to the close of yesterday’s session look very likely now to remain positive.
Profit targets may be set at 1,333 in the first instance.
Any members who are not yet long may like to wait for a pullback to the upper edge of the pink base channel to provide an entry opportunity. Members holding profitable long positions may like to add to their positions at that point, but only if the first position has a stop at either breakeven or at where some profit would be protected.
As always, risk management is the single most important aspect of trading. Take it seriously. My two Golden Rules are:
1. Always use a stop.
2. Invest only 1-5% of equity on any one trade.
GDX
DAILY CHART
Click chart to enlarge. Chart courtesy of StockCharts.com.
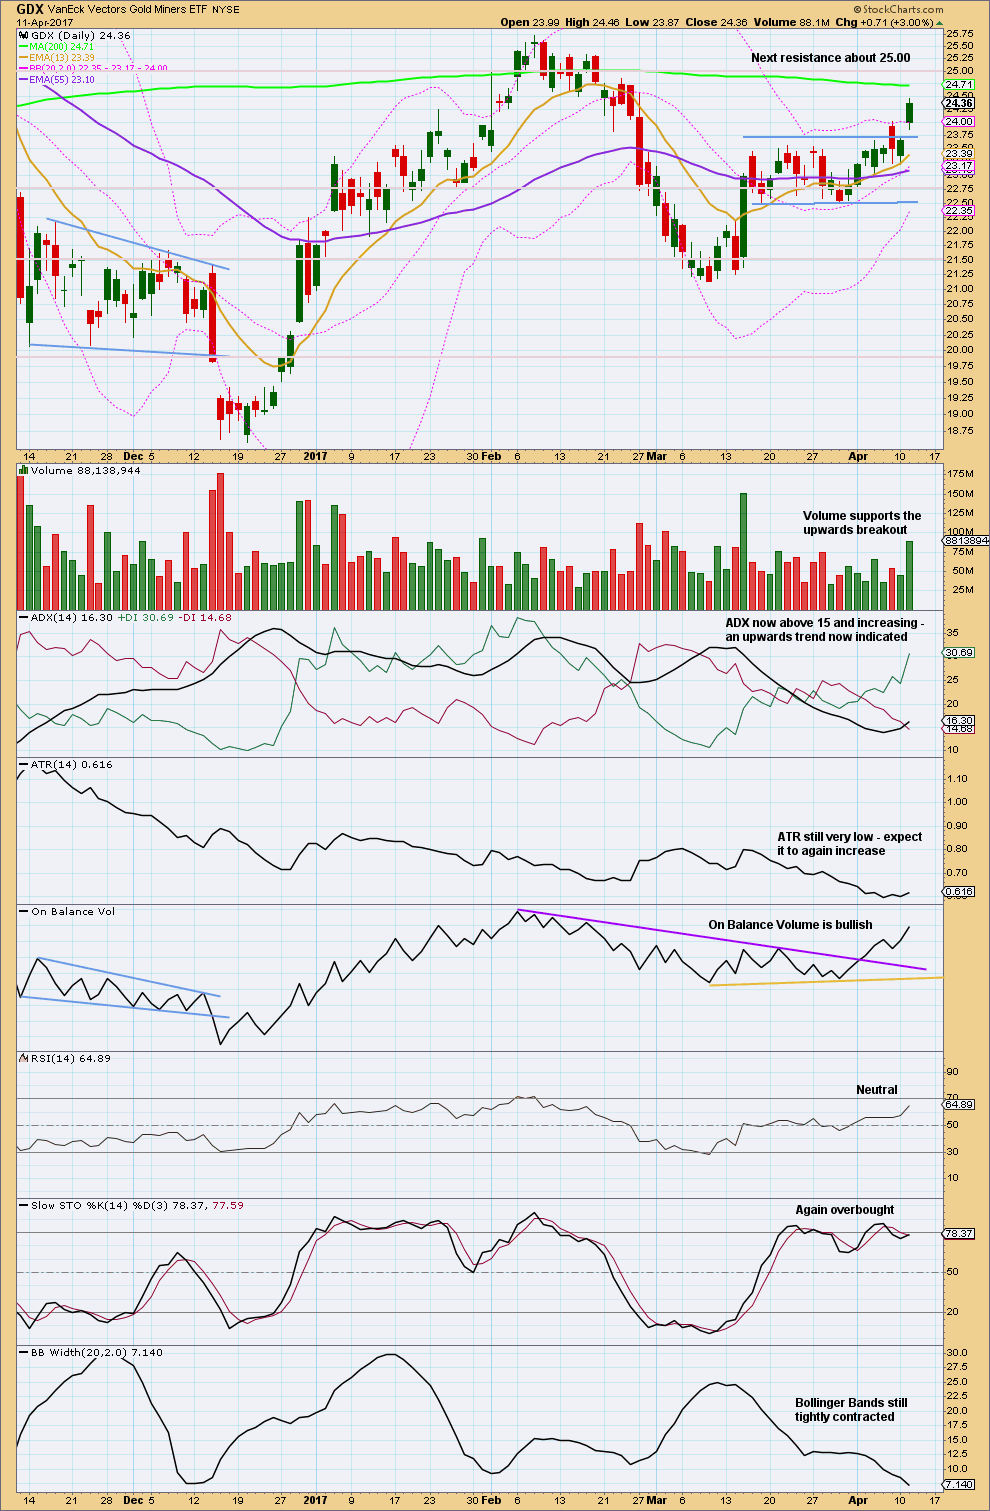
GDX also has broken upwards out of a consolidation zone. The breakout has support from volume.
Next resistance is at the 200 day moving average, then about 25.00.
Look for price to possibly curve down to test support at prior resistance, about 23.75. This does not always happen, but it happens often enough for it to be a tendency to look out for.
Although Stochastics is overbought, this oscillator may remain extreme for long periods of time during a strong trend.
This analysis is published @ 11:09 p.m. EST.
Money management question: if you have multiple entries, all green, at various levels… 1218, 1245, 1251, 1263 and all have Stop Loss at Break Even, I want to protect gains. Is it best to move all or most of the SL up to one place or leave and just close as they hit targets? My main objective is to hold longer term.
I like to manage profit taking differently in different trading accounts. I have found it helpful to have a short term (1 week or less) a medium term (at least 1 month) and a long term (6 months or more). In addition to a stop loss, I find it helpful to have a profit target as well for each trade, and to exit as soon as that target is reached. Profits can then be rolled back into another short term trade, moved to a mid or long term trade, or remain in cash. The current situation in Gold is interesting. There are a good reasons to expect a pullback of some kind. Considering the size of the short positions in could be sharp. I am taking profits just about daily in my short term accounts but will ingore the gyrations in my medium and long term precious metals an miners positions. The trend is clearly up imho. Hope that helps a bit.
This is very helpful indeed. I tend to let my JNUG sit medium term too then my 500:1 spot metals daily.
I took profits from higher entries today in case it dips below them but am still holding quite a few positions. Maybe in Asian trading look for exits and newer, lower entries.
Thanks for the input. Great trading week so far!
Hi ROBERT. I use a brokerage firm for my trades and their Trading Room is closed on Good Friday here in Karachi-Pakistan. The weekly upper band at 1291-92 does not look too far away now lol. GL and have a safe & profitable trade!
Playing possum…of course…! 🙂
Managing Trading Room trades:
Copper is looking very nice today. Stops at least at breakeven now. Hold on, lets see how it behaves when it gets to the lower trend line.
GBPUSD: I took a punt on the short side but exited for a very small loss, it wasn’t behaving correctly. Now it’s rocketed up, the base channel is well breached. That wave count is likely wrong. GBPUSD is off the table for Trading Room for the present.
So only Copper short now, and of course Gold long.
Easter is here and NYSE is closed Good Friday. Gold may be quiet for that session.
Yes, copper has been a great short trade. Thanks for the update on that… the lower trend line currently stands at around 2.50, good place to lighten short position, specially if it comes down to it in the next 24 hours, which would be its second day under the bollinger band and at the lower trend line…
I was going to request if you end up updating the trading room, maybe to add US oil to its analysis since it seems to be at an important cross road…
We all say “thank you Lara” many times, but that’s not really enough I think sometimes 🙂
It looks like subminuette ii is over as a very brief zigzag. Now Gold should be moving into the middle of a big third wave.
If this wave count is right hold onto your hats folks 🙂
Move stops up now to protect profit.
If there’s something wrong in this chart it may be the invalidation point is too high. But with the current strong upwards wave it looks like the last correction is over, so that’s why I’m moving the invalidation point up.
Just wondering how much longer Gold price can remain above the upper band with 4-hourly/daily RSI continually tapping 70+; perhaps 1278-79 (spot) is inflection (turning point) level if overcome will likely lead on to 1292-95-98 with 1306-07 in extension else a dip for 1260 and below? Better off taking money off the table here imo lol…. 🙂
Look at February 2016 for your answer Syed.
That was a strong third wave, ending in a blowoff top on the 11th of February 2016.
Gold sat along the upper edge of BBs from the start of that movement to the end, RSI moved above 85.
When Gold has a big third wave things can get really extreme. I remember members at that time complaining that it didn’t let them in. I think when it does that you have to either be well positioned before the move (as we are today) or just jump in and hold on.
Lara, many thanks! I took money off the table at 1278; now will probably have to wait for dip if this does dip below 1279 lol… Oh well cant win them all; not chasing this… Very nice analysis. Bravo
Thanks 🙂 Good Friday may give you another entry, Gold may go into another shallow correction.
Hi Syed,
Is the market open where you trade on good Friday?
Yep. I would not be surprised to see a tag of the 200 dma but that would be a bit deep. The slow miners are giving ample opportunity to get positioned in a leveraged PM trade….
US markets are closed for Good Friday.
I will be playing the part of Barrabas in a church skit. 🙂
(Who told them I had any acting talent I wonder?)
Will your contribution transform it into a comedy Verne? 🙂 Wish I could see it…
Also plausible that we are still in submicro (B) of micro Ycrc of subminuette ii.
If its a W-X-Y… their purpose is to take up time, yes?
If this does not go up very shortly, it is likely going down in a miniscule 3, but that pattern is not perfect. Otherwise its in miniscule 4 of submicro (i) up of micro icrc…
Sub minuettte ii at 9:15 may have been over at a shallow FLAT 23.6% retrace? Going over 8:15 AM high confirms it. Or we are in a Wave x now and another Flat to follow lower? Still over all shallow, in front of iii of (iii) of Minute iii etc.
Looks like a micro w-x-y, now in submicro (c) of micro Y crc. Looks like we are in wave miniscule (iii).
Otherwise, I agree…it ended 9:15-20am as a-b-c. Now into a 1-2 pattern…
agree..market’s job is to confuse everyone during corrections and suddenly explode as it did yesterday at 8:00 AM
Which is exactly what it’s done. This may come across as odd, but I don’t want to focus too much on each little move within a correction. I want to see, is it over? As soon as it may be over then look for the next impulse. I think that’s where the focus is best, it’s less stress and keeps the focus on when to enter / add to positions and making money.
Lara,
agree, thanks for excellent analysis.
Thoughts on where we are in subminuette ii of minuette (iii)?
Looks like an expanded flat, possibly near end of submicro (2) [@0.786 now] of micro C crc?
Alt may be that micro B is not complete, but at moment the move up is a little weak.
you’ve certainly got a poetry talent there John!
GBPUSD is breaking above it’s resistance line now. I’m out, taking a very small loss now waiting to see what happens next.
I should have no problems, but just in case, if my internet connection goes down AND the mobile network isn’t working, it may be due to Cyclone Cook about to hit New Zealand.
I’m in a good spot on a hill, so pretty sure I’ll be fine.
Just in case I don’t show up to post a chart before the NY close, you’ll know why.
Gotta say wow. You (and other members here) have really been “on” lately, answering gold’s moves with charted possibilities. Trading advice, and a trading room? Really awesome.
Thanks for the monthly/weekly update too. It helps me to see it to plan the “what ifs”. Left you a get well note yesterday while I think everone had already migrated to today’s analysis.
Keep up the good work!
Thank you 🙂
GDX hourly
https://www.tradingview.com/x/ww6JaDDm/
Nice wave count Dreamer.
I’m assuming that minuette (ii) is an expanded flat, not a running flat?
If your count is correct then stops may now be moved up to just below the high of minuette (i). Minuette (iv) may not move into minuette (i) price territory.
Yes, expanded flat. Actually, Minuette 2 should be moved over to the right as shown. Thanks,
https://www.tradingview.com/x/8Yq7hfAf/
I know that some of you (john for one), are frustrated with or questioning the lackluster performance lately of the miners vs Gold, especially GDXJ.
This chart shows the performance of Gold, Silver, GDX, & GDXJ since the lows in late December 2016.
You will note that GDXJ is leading, followed closely by GDX, then Silver, and Gold is bring up the rear in % gains. This is the order that we should expect in a healthy bull market.
So, the recent lag in miners, especially GDXJ, is nothing to worry about. I expect some big moves in GDX and even bigger moves in GDXJ in the coming days / weeks. History shows that the miners can move big at slightly different times than gold. They are separate markets with unique Elliott wave counts, although they are highly correlated.
https://www.tradingview.com/x/ww6JaDDm/
I just checked the correlation of $GOLD and GDX. While they usually are positively correlated, it’s not persistent.
Occasionally they disassociate.
While Gold and Silver moves up look good, we still need to see full daily candles above the symmetrical triangles to confirm the breakouts.
That said, look at GDX. The gap above symmetrical triangle resistance is fully above the trend line and is likely a “breakaway gap” that will not be filled anytime soon.
https://www.tradingview.com/x/Ia3vZrzW/
Looking very good for the bulls!
Very thorough analysis Lara, Thank you! Definitely worthy of ” Gold Historical” placement…
Thanks Dreamer, I’ve added it to the “historical” category.