
Yesterday’s analysis expected another shallow correction to continue sideways. This is mostly what has happened. Price bounced up almost exactly at the lower edge of the channel on the hourly chart, where support was expected as fairly likely.
Summary: The fourth wave correction may continue sideways for another day. When it is done, then upwards momentum is expected to increase strongly. The target for long positions remains at this stage at 1,333. If this is wrong, it may not be high enough.
New updates to this analysis are in bold.
Grand SuperCycle analysis is here.
Last monthly and weekly charts are here.
MAIN ELLIOTT WAVE COUNT
DAILY CHART
Click chart to enlarge.
This daily chart will suffice for both weekly charts.
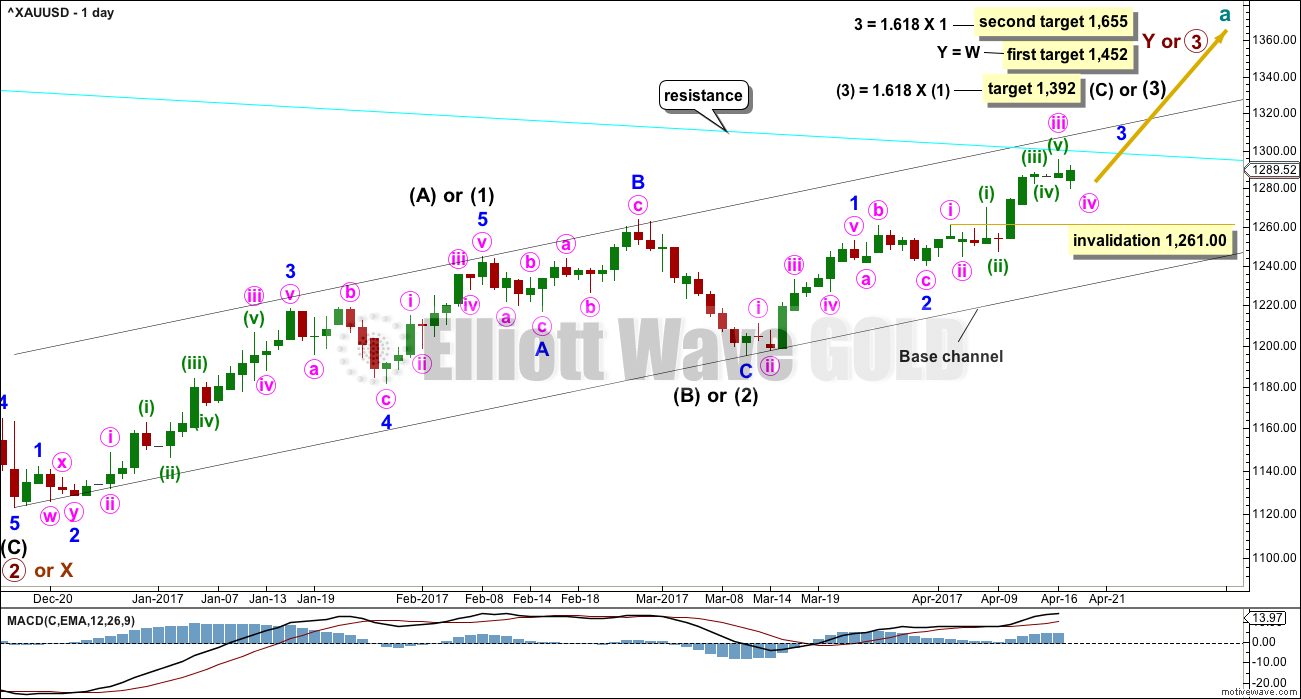
Upwards movement at primary degree is either a third wave (first weekly chart) to unfold as an impulse, or a Y wave (second weekly chart) to unfold as a zigzag. If upwards movement is a zigzag for primary wave Y, then it would be labelled intermediate waves (A) – (B) and now (C) to unfold. It is most likely a third wave because cycle wave a is most likely to subdivide as an impulse.
Intermediate wave (1) or (A) is a complete five wave impulse lasting 39 days. Intermediate wave (2) or (B) looks like an expanded flat, which is a very common structure.
So far, within intermediate wave (3) or (C), minor waves 1 and 2 are now complete. Minor wave 3 looks to have begun. Within minor wave 3, the middle portion for minute wave iii may now be complete. Minute wave iv may not move into minute wave i price territory below 1,261.00.
Minute wave v is expected to be very strong, possibly ending with a blow off top.
A cyan trend line is added to all charts. Draw it from the high in October 2012 to the high in July 2016. This line has been tested five times. Price is finding resistance at the cyan trend line now. If price can break through resistance here after some consolidation, then that may release energy to the upside for the end of minor wave 3.
DAILY CHART – DETAIL
Click chart to enlarge.
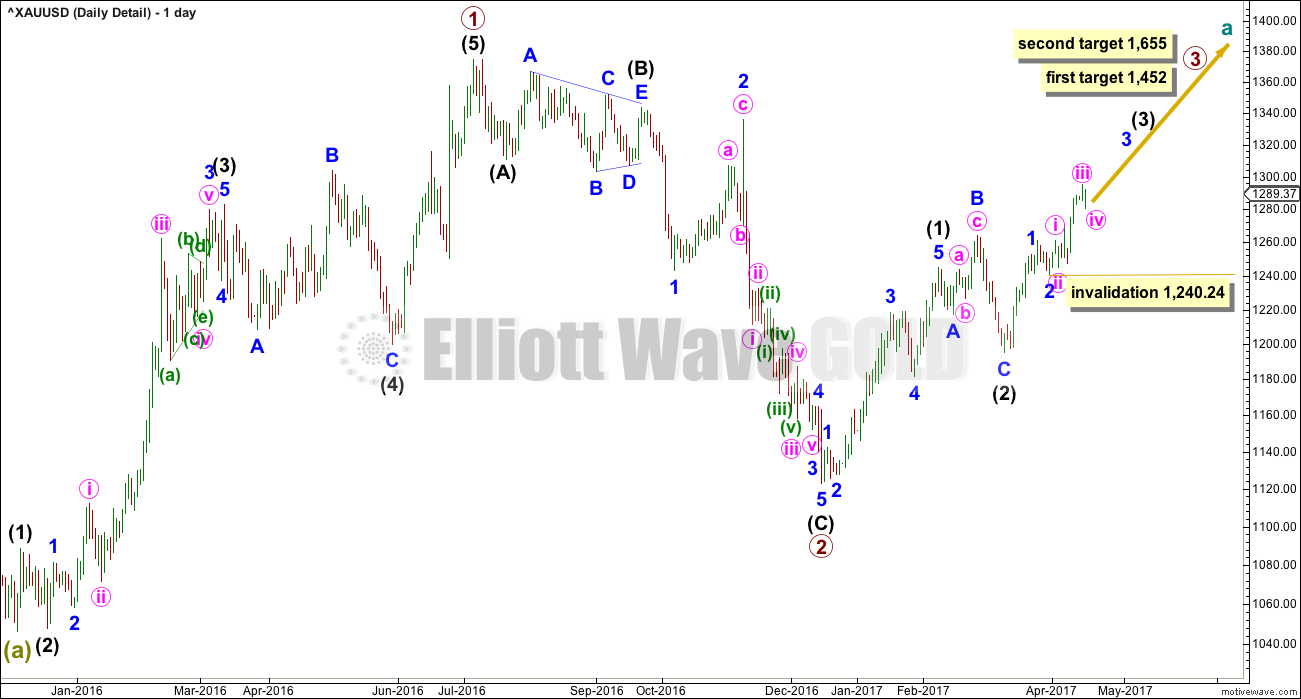
This chart steps back to see all movement since the important low on the 3rd of December, 2015.
To see how this fits into the bigger picture, please see the last historic analysis linked to at the start of this analysis.
The first upwards movement labelled primary wave 1 fits well as a five wave impulse. Primary wave 2 fits as a zigzag. It would be difficult to see the downwards wave of primary wave 2 as an impulse because that would require ignoring what looks very much like a triangle at its start (labelled intermediate wave (B) ). To see this as an impulse that movement would need to be a second wave correction, but second waves do not subdivide as triangles.
Primary wave 3 should have begun. Within it intermediate waves (1) and (2) should be complete. Intermediate wave (2) is a very common expanded flat correction.
My only concern at this stage is the labelling of minute wave iii as complete. It is possible that the middle portion of this third wave at three degrees has passed, if the next waves up for minute wave v and minor wave 5 are both very long and strong extensions.
It may also be possible that the middle of the big third wave has not passed and the degree of labelling within minor wave 3 needs to be moved down one degree. If minute wave ii is yet to unfold, it may not move beyond the start of minute wave i below 1,240.24.
HOURLY CHART
Click chart to enlarge.
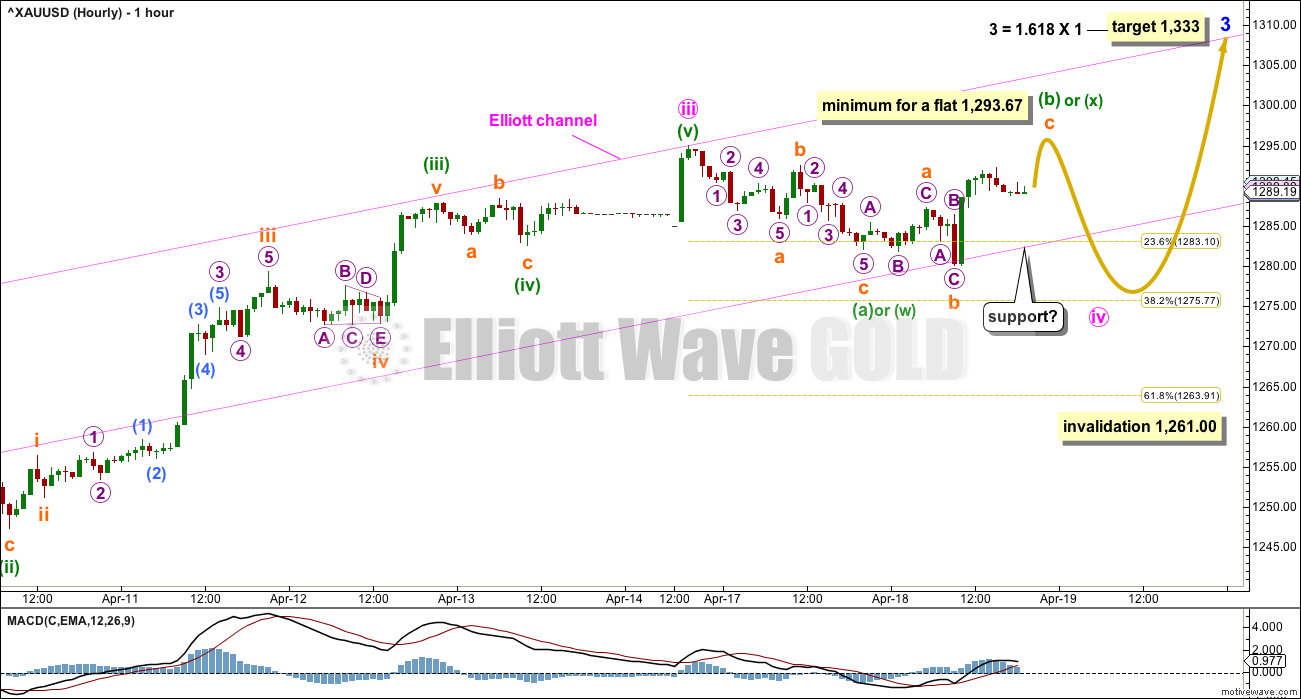
Minute wave ii was a deep 0.79 double zigzag, which lasted 25 hours, and on the daily chart it shows as only one session.
Given the guideline of alternation, minute wave iv may be expected to most likely be a flat, combination or triangle. All of these structures may include a new high above its start at 1,294.96 as part of the correction. A new high does not indicate minute wave iv is over.
So far a zigzag may have completed lower and this may be only minuette wave (a) of a flat or triangle, or minuette wave (w) of a combination.
If minute wave iv is a flat correction, then minuette wave (b) must retrace a minimum 0.9 length of minuette wave (a) at 1,293.67.
The normal range of minuette wave (b) within a flat correction would be from 1,294.96 to 1,299.88.
There is no minimum requirement for minuette wave (b) within a triangle, nor minuette wave (x) within a combination. They both only need a three wave structure upwards to complete.
Minuette wave (b) or (x) may be unfolding as an expanded flat correction. This may be continuing if it is minuette wave (b) in order to reach the minimum requirement at 1,293.67. Or if it is minuette wave (x) within a combination, it may be over already.
So far minute wave iv has lasted 49 hours. Flats, triangles and combinations are usually longer lasting structures than single and multiple zigzags. Minute wave iv may end within the next session, or it may possibly take a little longer.
It is possible that minute wave iv is over at the low labelled subminuette wave b, where price came down to find support at the lower edge of the pink channel. However, if it was over there, then the only corrective structure which would fit would be a double zigzag. This is possible, but the probability is low because it would see no alternation with the double zigzag of minute wave ii. Because of the lack of alternation I would hesitate to publish this idea.
The Elliott channel is drawn using Elliott’s first technique: the first trend line is drawn from the ends of minute waves i to iii, then a parallel copy is placed upon the end of minute wave ii. This channel does not perfectly contain the start of minute wave iii, but it may still assist to show where minute wave iv finds support.
Fourth waves are not always contained within these channels though. If minute wave iv moves below the lower pink trend line, then the channel must be redrawn using the second technique when minute wave iv is complete.
TECHNICAL ANALYSIS
WEEKLY CHART
Click chart to enlarge. Chart courtesy of StockCharts.com.
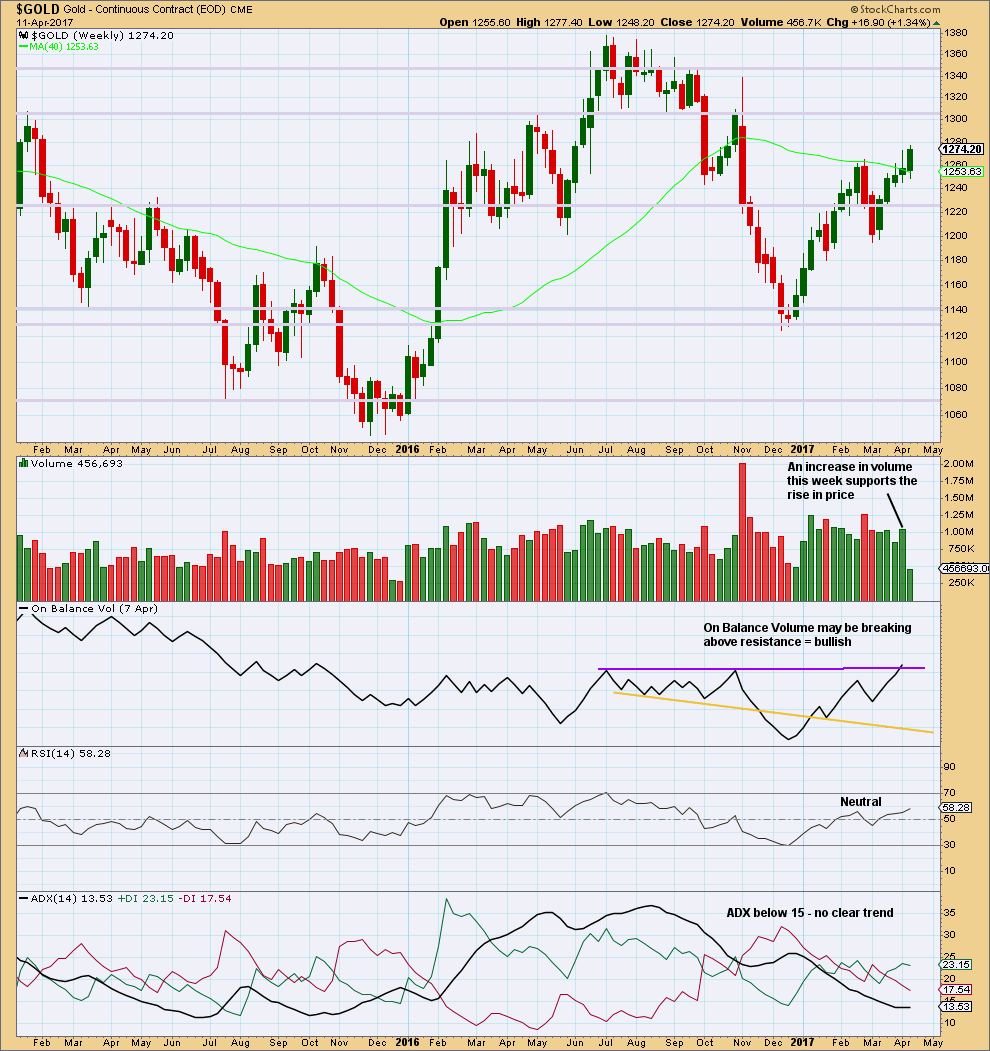
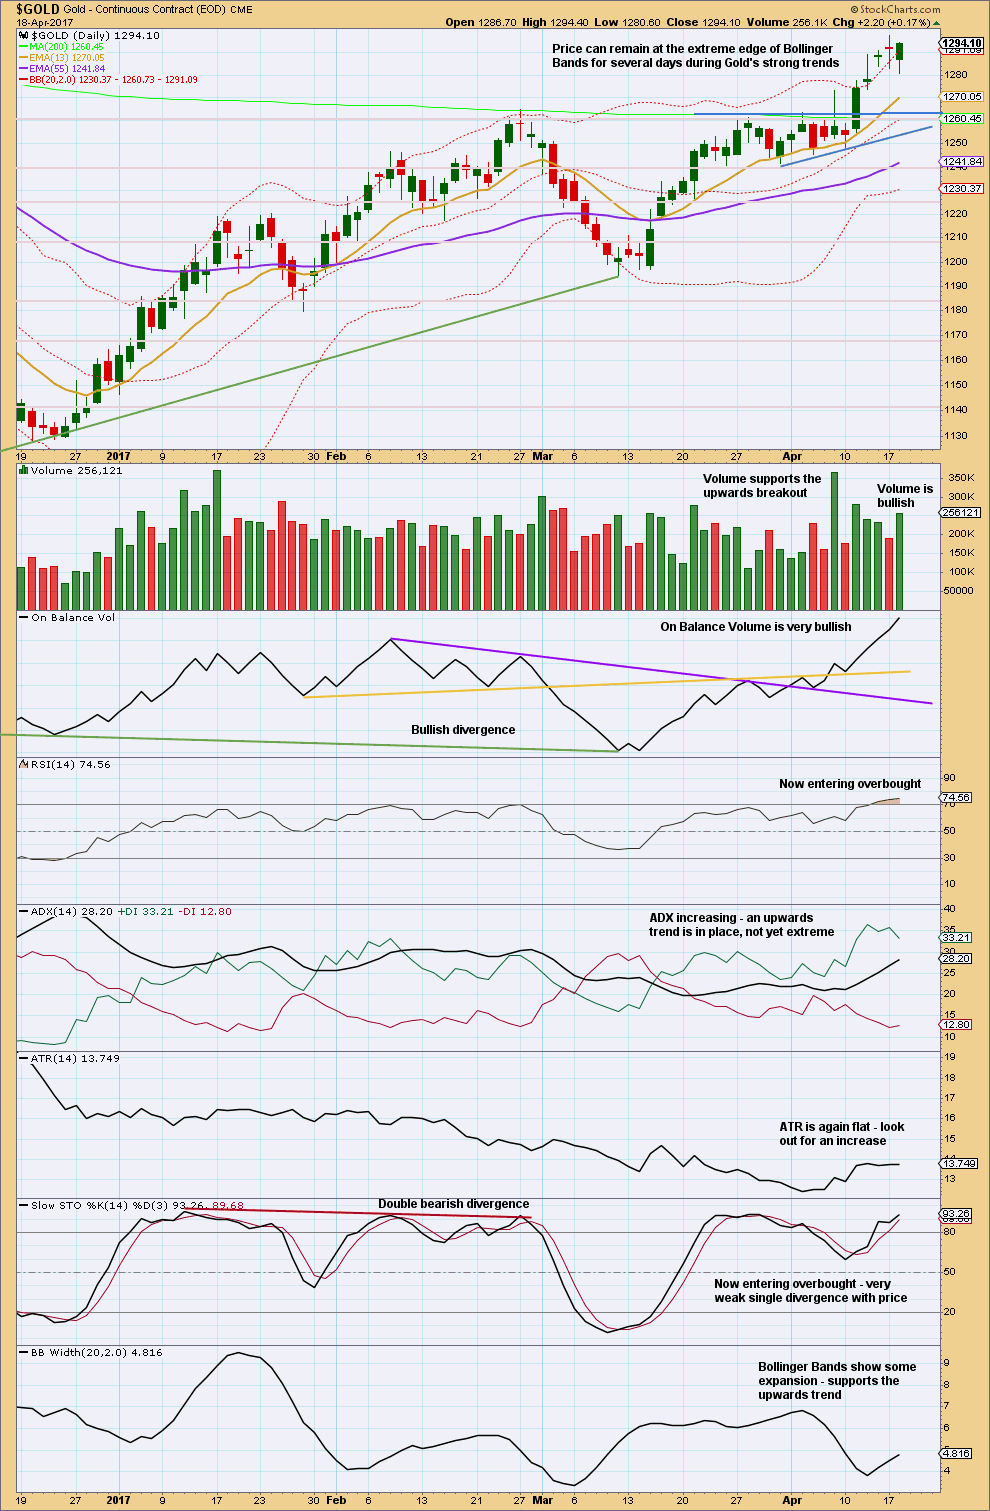
The relatively long upper wicks of the last two weekly candlesticks are a little bearish. The increase in volume last week is bullish.
The purple trend line on On Balance Volume has been carefully drawn to be as conservative as possible, sitting along the prior two highs. This trend line has a very shallow slope and is reasonably long held. It has only been tested twice before. It has some reasonable technical significance. Last week it is slightly breached offering a reasonable bullish signal. However, for the signal to have more weight it needs a clearer breach.
DAILY CHART
Click chart to enlarge. Chart courtesy of StockCharts.com.
I do not have confidence in the data from StockCharts for the daily candlestick for the 12th of April. As the session ended, I did not see a spike down to 1,278, which is their close, and creates the long upper wick on their candlestick.
Tuesday completes a downwards day with a lower low and a lower high. The candlestick closed green and the balance of volume was upwards. A surge in volume for Tuesday is bullish. The long lower wick on the candlestick is bullish.
Give considerable weight to On Balance Volume: today, it looks very bullish. This is strong support for the Elliott wave count.
RSI can continue to become more extreme. It does not yet exhibit divergence with price, so there is room for price to move higher. ADX is not yet extreme.
Expect the upwards trend to continue. Corrections present an opportunity to join the trend.
TRADING ADVICE
I have left my stop on my long position at 1,270.89. If price comes down again to the lower trend line, it may present another opportunity to add to long positions. Stops for new long positions may also be set at 1,270.89, but there is a risk here that a whipsaw may close out longs only to see price move higher. Alternatively, set stops just below 1,261 for new long positions here, and reduce position size to keep risk from 1-5% of equity.
Profit targets may be set at 1,333 in the first instance.
As always, risk management is the single most important aspect of trading. Take it seriously. My two Golden Rules are:
1. Always use a stop.
2. Invest only 1-5% of equity on any one trade.
GDX
DAILY CHART
Click chart to enlarge. Chart courtesy of StockCharts.com.
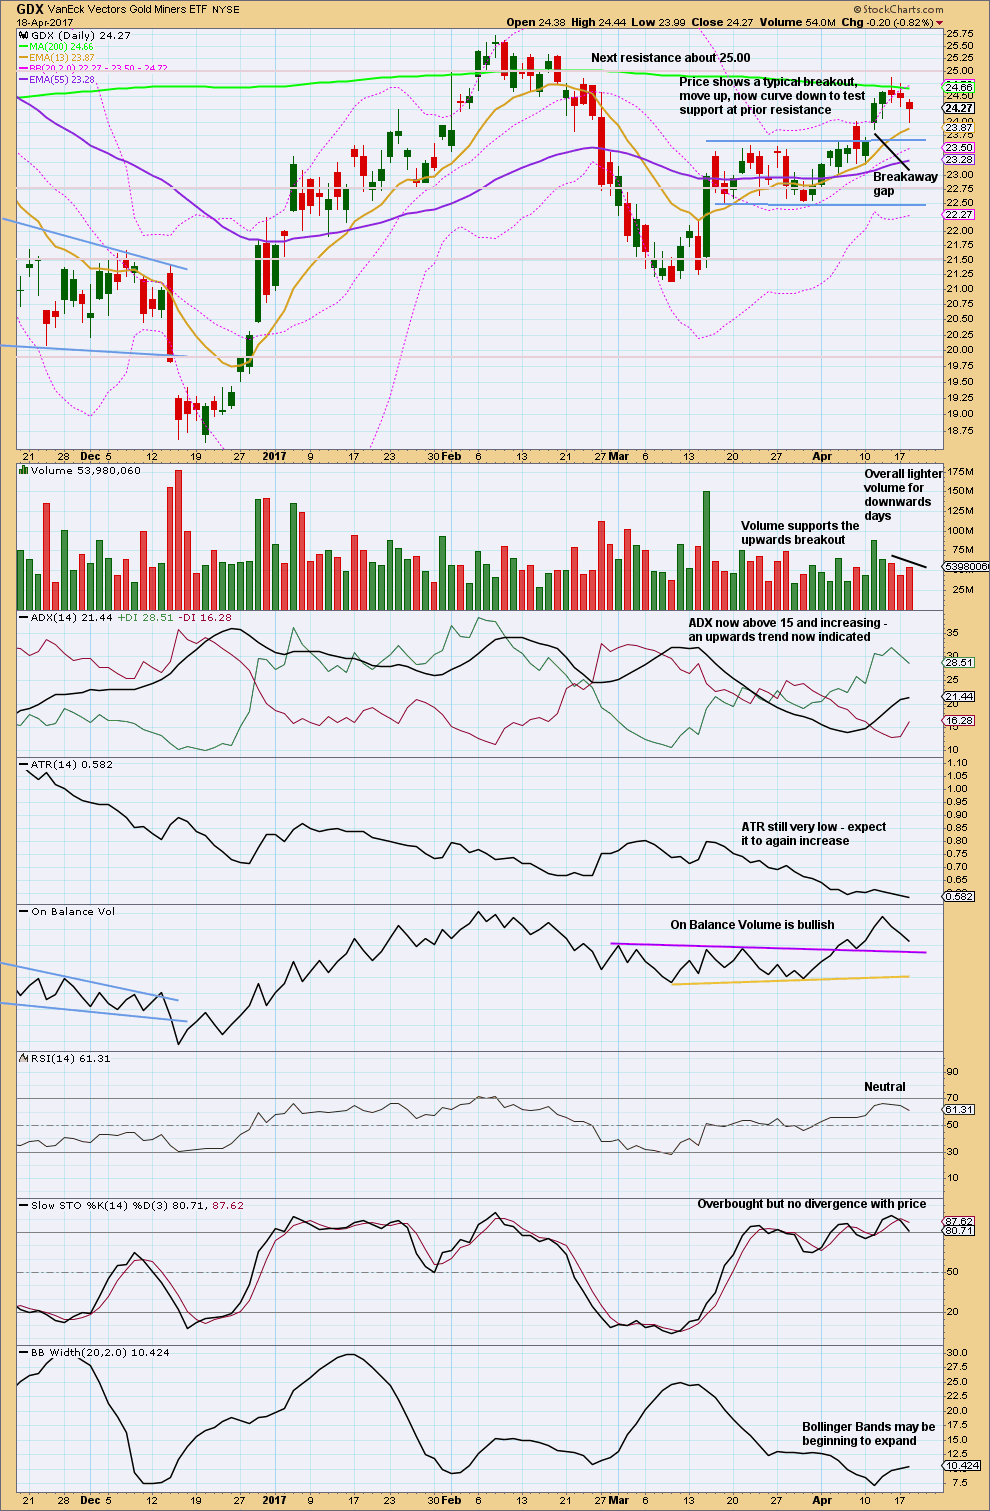
This chart remains bullish with some neutrality.
Price is behaving typically: after a breakout it often curves back to test prior support / resistance. When price does this, it offers us a gift: an entry into a trend after the breakout has given confirmation.
The breakaway gap should offer support, so set stops just below it at 23.71. If that gap is closed, then it would not be a breakaway gap and something else would be happening, so long positions should be exited.
STUDY OF A THIRD WAVE IN $GOLD
Click chart to enlarge.
This study of a third wave will be left in daily analysis until the current third wave is either proven to be wrong (invalidated) or it is complete.
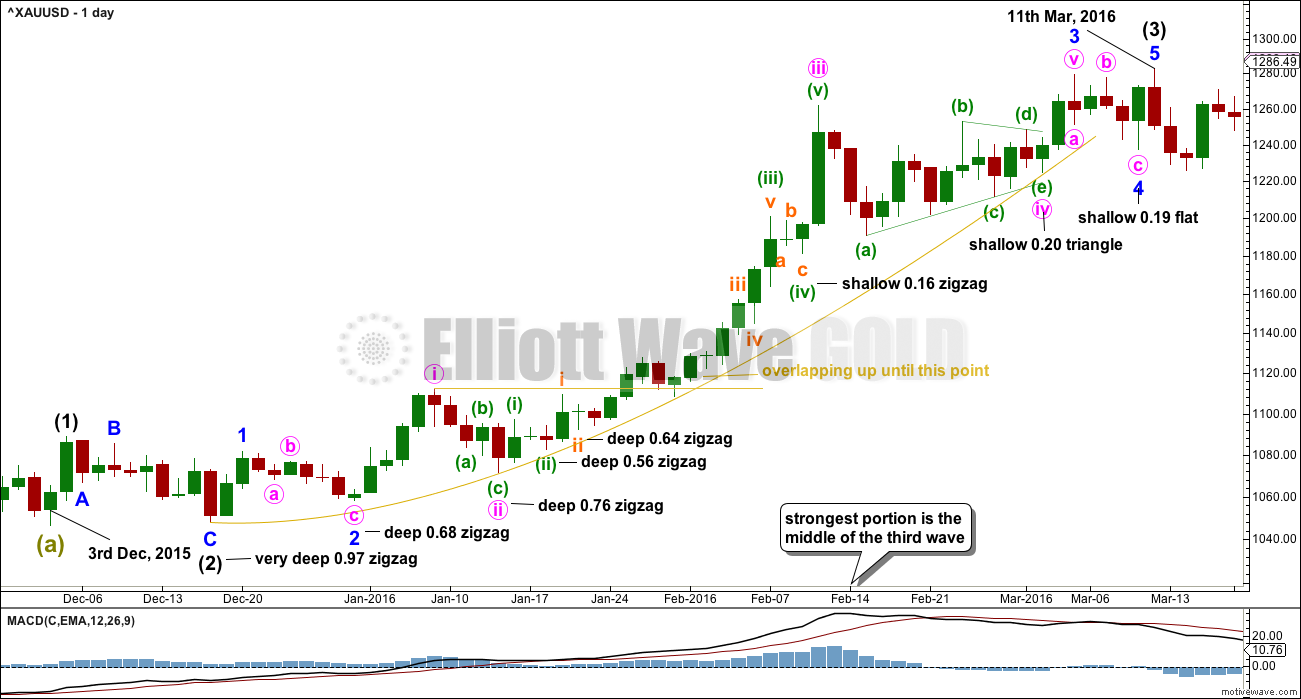
This third wave spans 59 trading days.
It was not until the 40th day that the overlapping ended and the third wave took off strongly.
The middle of the third wave is the end of minute wave iii, which ended in a blow off top.
There is excellent alternation between second and fourth wave corrections.
This third wave began with a series of five overlapping first and second waves (if the hourly chart were to be added, it would be seven) before momentum really builds and the overlapping ends.
The fifth wave of minuette wave (v) is the strongest portion.
This third wave curves upwards. This is typical of Gold’s strong impulses. They begin slowly, accelerate towards the middle, and explode at the end. They do not fit neatly into channels. In this instance, the gold coloured curve was used.
Click chart to enlarge. Chart courtesy of StockCharts.com.
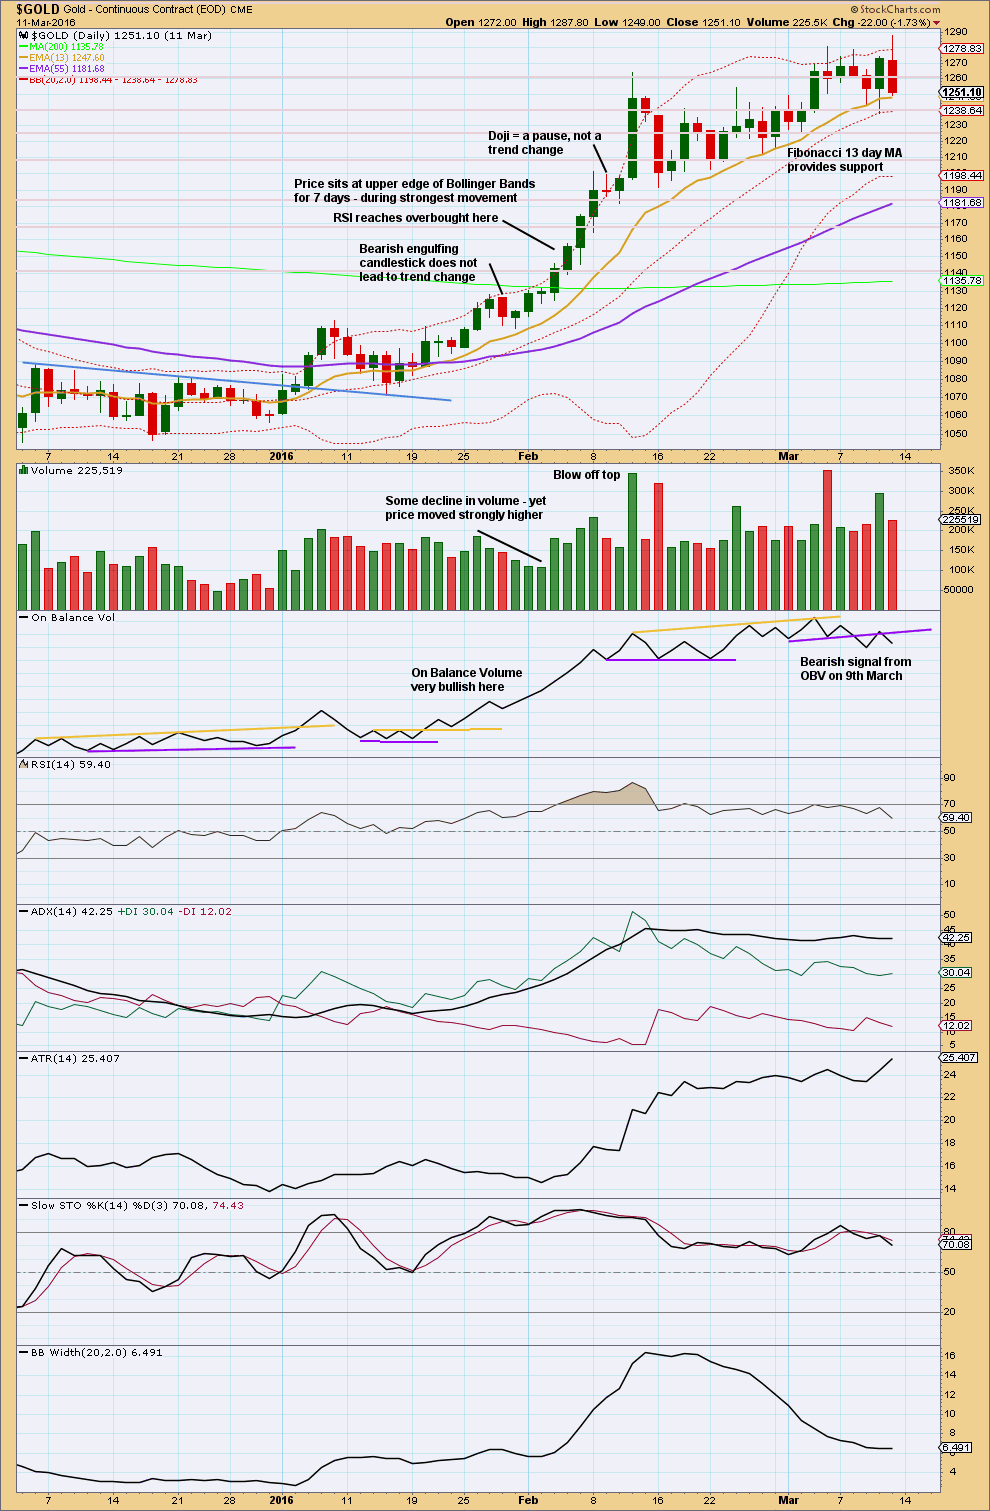
This trend began after a long consolidation period of which the upper edge is bound by the blue trend line. After the breakout above the blue trend line, price curved back down to test support at the line before moving up and away.
RSI reaches overbought while price continues higher for another five days and RSI reaches above 85. The point in time where RSI reaches overbought is prior to the strongest upwards movement.
ADX reached above 35 on the 9th of February, but price continued higher for another two days.
The lesson to be learned here: look for RSI to be extreme and ADX to be extreme at the same time, then look for a blow off top. Only then expect that the middle of a big third wave is most likely over.
The end of this big third wave only came after the blow off top was followed by shallow consolidation, and more highs. At its end RSI exhibited strong divergence with price and On Balance Volume gave a bearish signal.
Third waves require patience at their start and patience at their ends.
This analysis is published @ 09:05 p.m. EST.
hi lara
But i missed this oppurtunity, why dont u post these recommendations all at one place? as far as i know copper sell call is running from 10th april stop was 2.70, but i cant see where did u post trailing stop. That means for every recommendation i have to see all comments?
I wanted to post recommendations all in one place, in comments on Trading Room.
But it appears many member cannot access comments on Trading Room posts, and so posting recommendations there really didn’t seem like a very good idea once I knew that.
No one (apart from me) has made any comments there. I have made one, asking a question, and no one has replied. My conclusion is no one can.
I make a comment almost every afternoon NY time with a chart. This is part of the service I provide. And so I expect that members are at least scrolling through comments on Gold posts and will see mine.
So yes, until I have resolved the problem with Trading Room comments you are going to have to scroll through Gold posts comments to see mine. Search for “Lara” and you’ll only have to read a very few.
And the opportunity is right here in today’s comments with a big chart.
And just to add Mahesh, you’ve joined a community of traders here some of whom are extremely experienced, very clever and kind enough to share tips and knowledge.
Not reading the comments posted each day means you miss a lot of that knowledge. My advice would be to not do that. Read the comments and learn from these people.
Anyway, regarding Copper, you haven’t missed an opportunity. Wait patiently another day before entering. The long lower wick for 20th April looks bullish, the bounce probably isn’t done. My short may be underwater for another day or so, you may get a better entry. Stops just above 17th April high at 2.611 (FXCM data). Target 1.937.
Hi Lara,
in echoing Melanie’s request is there any chance of providing an hourly for oil?
Nope.
When I’m trading I do it on the daily chart. I don’t always analyse the little subdivisions on the hourly chart.
I think it puts too much focus on minutae, and not on the bigger picture. The trend is down, and this is a third wave that needs to move below the end of the first wave. By the time it’s done that we can draw a trend line for resistance, and exit if that is breached before the target is hit.
Keep it simple.
Everybody should now have profits on US Oil and positive positions on Copper again. And positive longs on Gold.
Unless of course as I notice some of you are trading other related instruments… which unfortunately aren’t currently correlated with Gold 🙁
Yes we do!! 🙂
Okay, minute could be a complete double zigzag.
But… let’s expect alternation. It could also still be a triangle or a combination (which is how I’ve labelled it).
We can rule out a flat now because as Alan rightly points out below, what would be minuette (b) is < 0.9 X minuette (a). I've created a parallel copy on the lower edge of the Elliott channel and pulled it down to enclose all movement. I would now expect this trend line to offer support. It doesn't have to, but it is very likely to. I've zoomed out so you can see all of minute waves i, ii, iii and now iv.
Minute iv could continue sideways in an ever decreasing range for a few days to complete triangle. Lets fervently hope it doesn’t do that, because that would point to a very short and brief minute v.
Or minute iv could continue sideways as a combination. Minuette (y) may be either a flat or a triangle.
Then we could see a long strong extended minute v
Looking on the bright side of things today, Lara oil short is looking pretty good.
IKR! Go Oil!
For those of you who are trading NUGT on the Minute 5 wave up, I have analysed the ETF for the short-term trend.
The count equivalent to Minor 3 of gold is:
7.40 – 10.00 – 8.69 – 11.62 – 9.71 – ?
My target is 12.74 where Minute 5 = Minute 3 for NUGT.
(I expect the same for gold).
NUGT has bottomed at 9.71 a while ago, somewhat slower than gold. On a long term basis, the correlation between gold and NUGT has been relatively good.
Alan,
If Minute Wave was i at 10 and iv low 9.71 of Minor 3, an overlap?
Or do you have it different marks or an alt. count?
Unless you have Minute i at 8.52 and Minute ii at 7.47?
Ssandsysc. Thanks for pointing it out. You are absolutely right. I noticed the overlap whilst doing a quick analysis. I might have to rework at smaller timeframes. The problem is all these reverse splits creating problems with the count.
If the overlap is correct, then that means the wave 5 is an ending diagonal. The target would then be closer to 12. Alternatively, your suggestion of Minutes 1 and 2 is a wonderful insight.
Alan…so are you thinking a new bottom, or pretty confident that this 9.64 is close?
GDXJ broke invalidation… remeasuring.
Targets at 4 degrees:
(1) Minute 4 = 0.382 * Minute 3 @ 1275.77.
(2) Subminuette C = 1.236 * Subminuette A @ 1276.22.
(3) micro 5 = micro c @ 1276.63.
(4) Submicro 5 = 0.618 * submicro 1 @ 1276.46.
Daily chart Ichimoku kijun-sen support is at 1273.
Wow. What a quick development.
Minuette B was a quick expanded flat ending in the high of 1292.23. Since it was less than 1293.67, a flat for Minute 4 was voided. Instead Minute 4 turned out to be a double zigzag. Currently in the fifth subwave of minuette c down, the down move ought to end pretty soon.
If correct, then Minute 5 will be taking off pretty soon.
“If this count is correct, there will be a last big drop in the C wave targeting 1274 – 1276.”
Good call by you and Lara from yesterday for a Minute iv low. Thx.
thanks a lot Alan, so spot on with the counting!
clearly not!
think we might be seeing the completion of wave 2 in a 5th wave here
Copper stopped out shorts with stops set at 2.604.
The last two upwards days have long upper wicks, and were followed by a strong downwards day to a new low. Another good downwards break.
Today Copper is bouncing a little, so this may be another opportunity to join the downwards trend.
Entering short here at 2.5451, stop just above the last swing high of the 17th of April at 2.611. Target still 1.937.
hi lara,
Entering short here at 2.5451, stop just above the last swing high of the 17th of April at 2.611. Target still 1.937. why are you posting this recommendation in comment section and not in trading room?
Because several members have recently told me they’re having problems accessing Trading Room comments.
So I didn’t want anyone to miss it.
Lara
Thank you so much for your great work here! I am not posting a lot, but I am following daily.
Concerning the trading room: highly appreciated! Used already your copper suggestions.
Keep on looking for goods waves 🙂
Cheers from Europe
Frank
Thank you very much Frank 🙂
Lara, I think your Trading room concept is solid, although I tend to focus my energy on trading the miners using much larger positions than you recommend.
I would be much more likely to trade something recommended in the Trading Room when the miners and gold are not trending. I like the idea of always having a trending option to invest in that you are analyzing on a regular basis.
Selfishly I would like to see you analyze GDX weekly, but I know that you don’t believe that you can do that accurately. I still think it would be very helpful for those of us trading miners. I find my own GDX EW analysis very useful and I know that if you were doing it, it would be more accurate.
I do hope oil hits your bottom target… going long oil below 30 is a trade I definitely want to be in.
Thanks for all your work! 😍
PS. I tried reading the 1 comment showing on the latest Trading Room post and It won’t show the comment when I click on it 🤔
Yeah, I think that you’re not the only one there Dreamer exceeding my 1-5% of equity rule 🙂
Finding a trend in it’s early stages just isn’t as easy as it looks.
Last year I had a spectacular trade on NZDUSD, but it took six attempts before the trade “stuck”. A couple of small losses, and a few closed at breakeven. The sixth stuck and I rode it down until a trend line was breached.
So patience is the key. To have one market trending is great, my goal is to keep an eye on a few markets so we shall mostly have at least one trending we can trade.
Hi Lara,
About feed back on the Trading Room….
I am following the US Dollar and Copper when you post. I am in US Doll. now and have been in/out of Copper. Watching both closely. I do not think there is anything wrong w/how you present. {Selfishly, I’d love to see hourly counts here/there when you can.} I think many traders are so busy and gold is so popular [I have not quite figured, besides liquidity.], traders don’ take the time to comment in the room.
I would like to look more closely at oil and nat gas. I am attempting other endeavors in the trading world before I attempt one of these, but I do read and learn from your posts.
I think that Dreamer made a fair suggestion to watch Cocoa. You mentioned that the bottom was not likely in, but this would be an interesting one to trade to the upside when the trend does reverse. [Guess we all love Chocolate!]
I for one find the Trading Room helpful. One only learns more from it.
Thank you…
Thanks very much for the feedback Ursula. That’s helpful to know I’m on the right track.
Looking for another entry to Copper today….
Oops, that was Melanie you replied to… 😳
Oops! Sorry Melanie and Ursula