
A small inside day completes and fits expectations for a correction to continue.
Summary: The correction is still most likely incomplete. It may continue further for yet another one to few days. Thereafter, the upwards trend should resume. The target for long positions remains at this stage at 1,333. If this is wrong, it may not be high enough.
New updates to this analysis are in bold.
Grand SuperCycle analysis is here.
Last monthly and weekly charts are here.
MAIN ELLIOTT WAVE COUNT
DAILY CHART
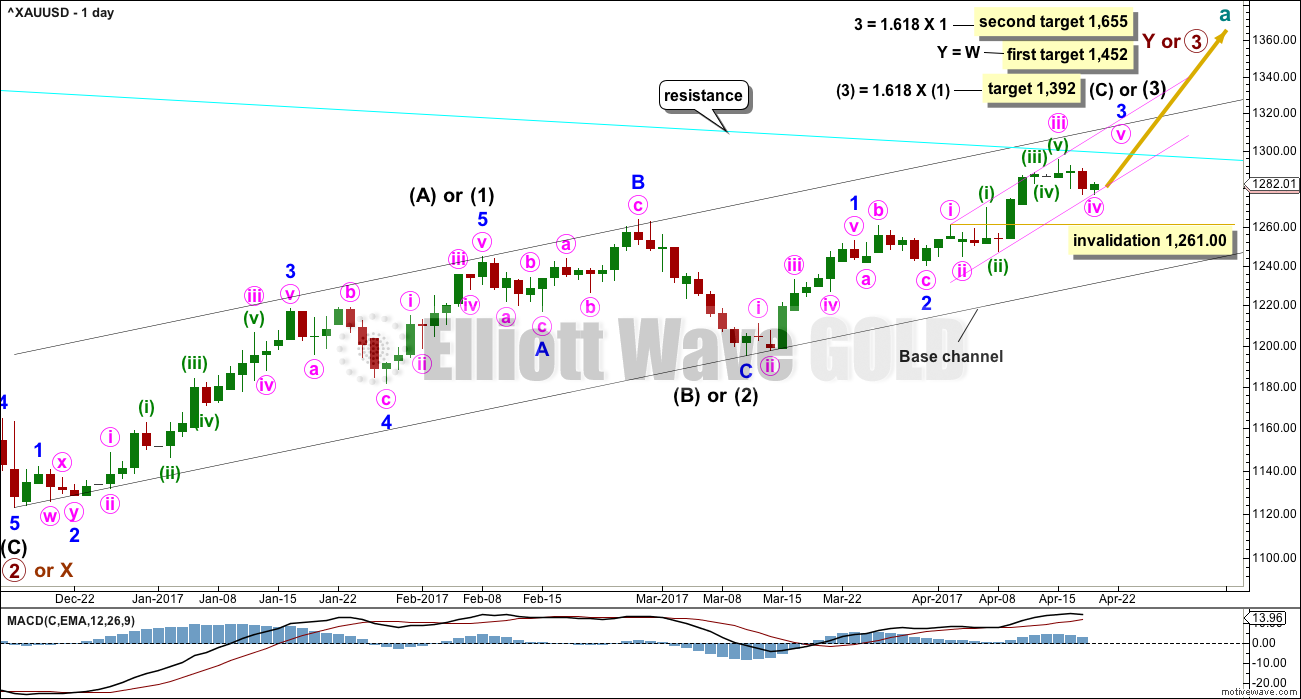
Click chart to enlarge.
This daily chart will suffice for both weekly charts.
Upwards movement at primary degree is either a third wave (first weekly chart) to unfold as an impulse, or a Y wave (second weekly chart) to unfold as a zigzag. If upwards movement is a zigzag for primary wave Y, then it would be labelled intermediate waves (A) – (B) and now (C) to unfold. It is most likely a third wave because cycle wave a is most likely to subdivide as an impulse.
Intermediate wave (1) or (A) is a complete five wave impulse lasting 39 days. Intermediate wave (2) or (B) looks like an expanded flat, which is a very common structure.
So far, within intermediate wave (3) or (C), minor waves 1 and 2 are now complete. Minor wave 3 looks to have begun. Within minor wave 3, the middle portion for minute wave iii may now be complete. Minute wave iv may not move into minute wave i price territory below 1,261.00.
Minute wave v is expected to be very strong, possibly ending with a blow off top.
A cyan trend line is added to all charts. Draw it from the high in October 2012 to the high in July 2016. This line has been tested five times. Price is finding resistance at the cyan trend line now. If price can break through resistance here after some consolidation, then that may release energy to the upside for the end of minor wave 3.
DAILY CHART – DETAIL
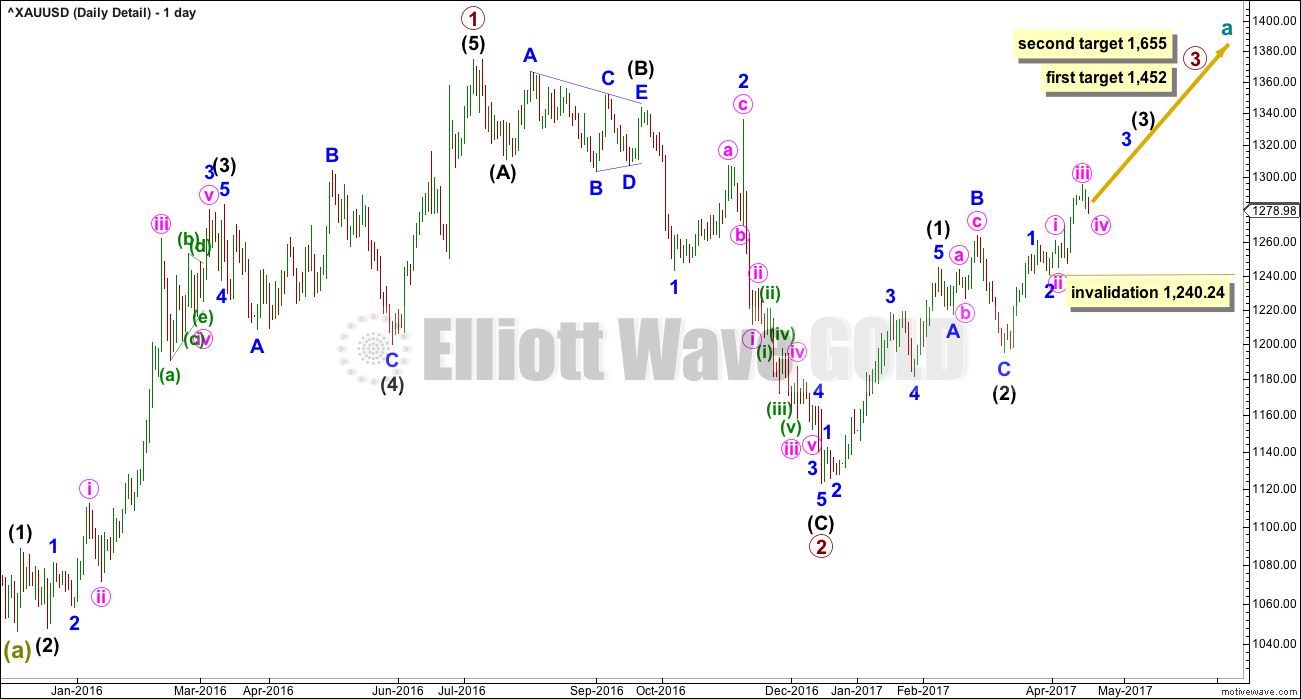
Click chart to enlarge.
This chart steps back to see all movement since the important low on the 3rd of December, 2015.
To see how this fits into the bigger picture, please see the last historic analysis linked to at the start of this analysis.
The first upwards movement labelled primary wave 1 fits well as a five wave impulse. Primary wave 2 fits as a zigzag. It would be difficult to see the downwards wave of primary wave 2 as an impulse because that would require ignoring what looks very much like a triangle at its start (labelled intermediate wave (B) ). To see this as an impulse that movement would need to be a second wave correction, but second waves do not subdivide as triangles.
Primary wave 3 should have begun. Within it intermediate waves (1) and (2) should be complete. Intermediate wave (2) is a very common expanded flat correction.
My only concern at this stage is the labelling of minute wave iii as complete. It is possible that the middle portion of this third wave at three degrees has passed, if the next waves up for minute wave v and minor wave 5 are both very long and strong extensions.
It may also be possible that the middle of the big third wave has not passed and the degree of labelling within minor wave 3 needs to be moved down one degree. If minute wave ii is yet to unfold, it may not move beyond the start of minute wave i below 1,240.24.
HOURLY CHART
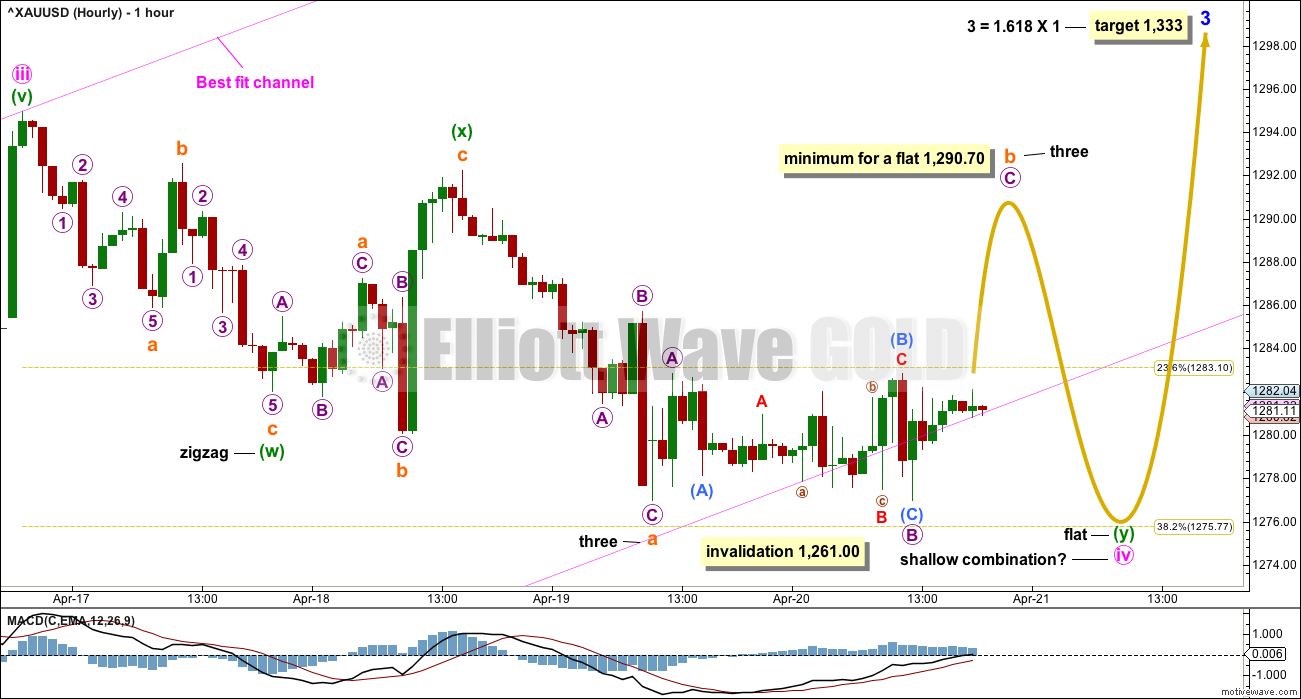
Click chart to enlarge.
Minute wave ii was a deep 0.79 double zigzag, which lasted 25 hours, and on the daily chart it shows as only one session.
Given the guideline of alternation, minute wave iv may be expected to most likely be a flat, combination or triangle. All of these structures may include a new high above its start at 1,294.96 as part of the correction. A new high does not indicate minute wave iv is over.
Combinations, flats and triangles are all usually more longer lasting structures than zigzags.
At this stage, a flat correction for minute wave iv may be ruled out because there is no upwards wave within it that has retraced a minimum 0.9 length of any downwards wave within it. The minimum length for minuette wave (b) within a flat correction for minute wave iv has not been met.
That leaves two possibilities. This first hourly chart looks at a possible combination for minute wave iv. The second possibility, that of a triangle, was published yesterday but will no longer be published because it does not have the right look. Although it could technically be said to be possible, the probability is way too low at this time.
If minute wave iv is a combination, then the first structure within it labelled minuette wave (w) may be a complete zigzag.
The two structures in the double may be joined by a complete three in the opposite direction labelled minuette wave (x), which subdivides as an expanded flat correction.
Minuette wave (y) may have begun. It may be either a flat or a triangle.
At this stage, it looks like it may be continuing further as a flat correction. Within the flat correction, subminuette wave b must retrace a minimum 0.9 length of subminuette wave a. Subminuette wave c would then be very likely to end at least slightly below the end of subminuette wave a at 1,276.96 to avoid a truncation and a very rare running flat.
If minuette wave (y) is a flat correction, then at its end it will have to break below the parallel copy of the best fit channel, copied over from the daily chart. Fourth waves are not always neatly contained within channels.
It is also possible that minuette wave (y) may yet unfold sideways as a triangle and remain all or almost all within the best fit channel.
Minute wave iv may not move into minute wave i price territory below 1,261.00.
TECHNICAL ANALYSIS
WEEKLY CHART
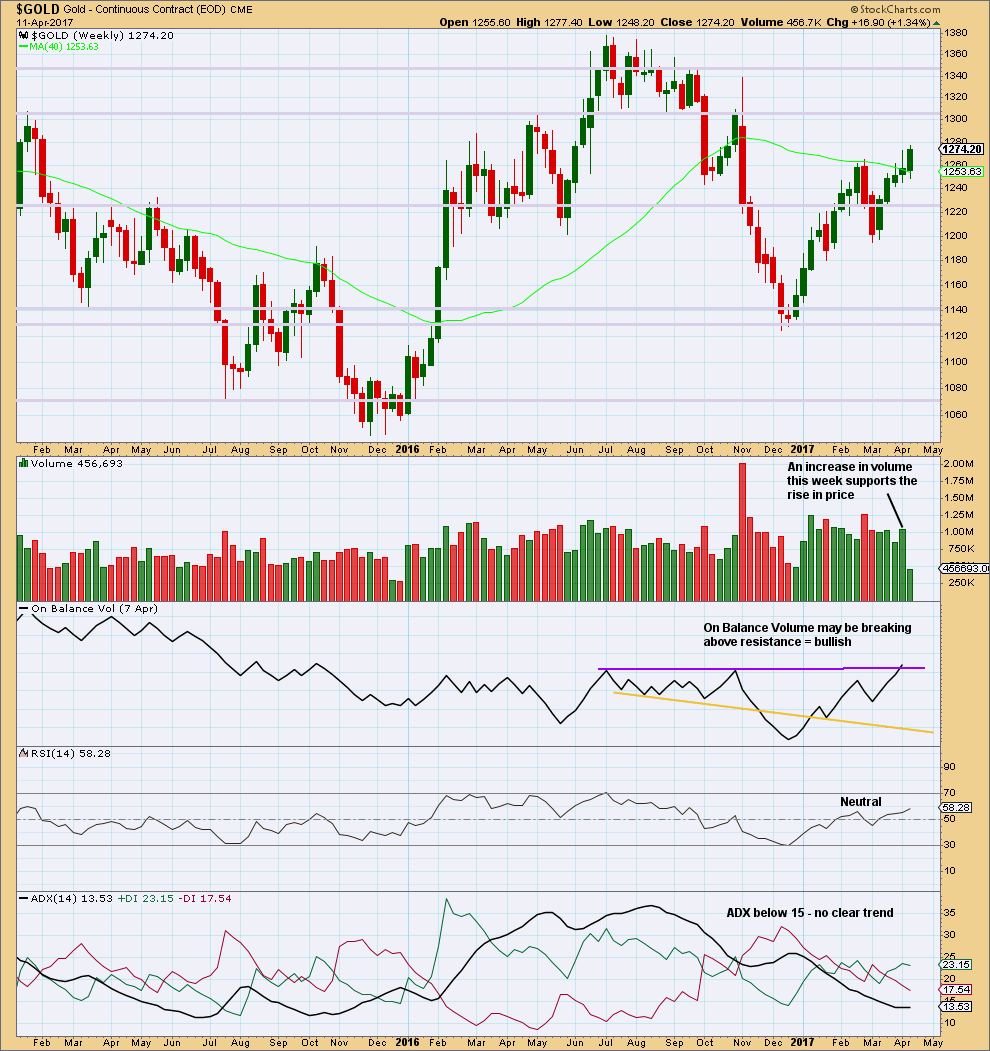
Click chart to enlarge. Chart courtesy of StockCharts.com.
The relatively long upper wicks of the last two weekly candlesticks are a little bearish. The increase in volume last week is bullish.
The purple trend line on On Balance Volume has been carefully drawn to be as conservative as possible, sitting along the prior two highs. This trend line has a very shallow slope and is reasonably long held. It has only been tested twice before. It has some reasonable technical significance. Last week it is slightly breached offering a reasonable bullish signal. However, for the signal to have more weight it needs a clearer breach.
DAILY CHART
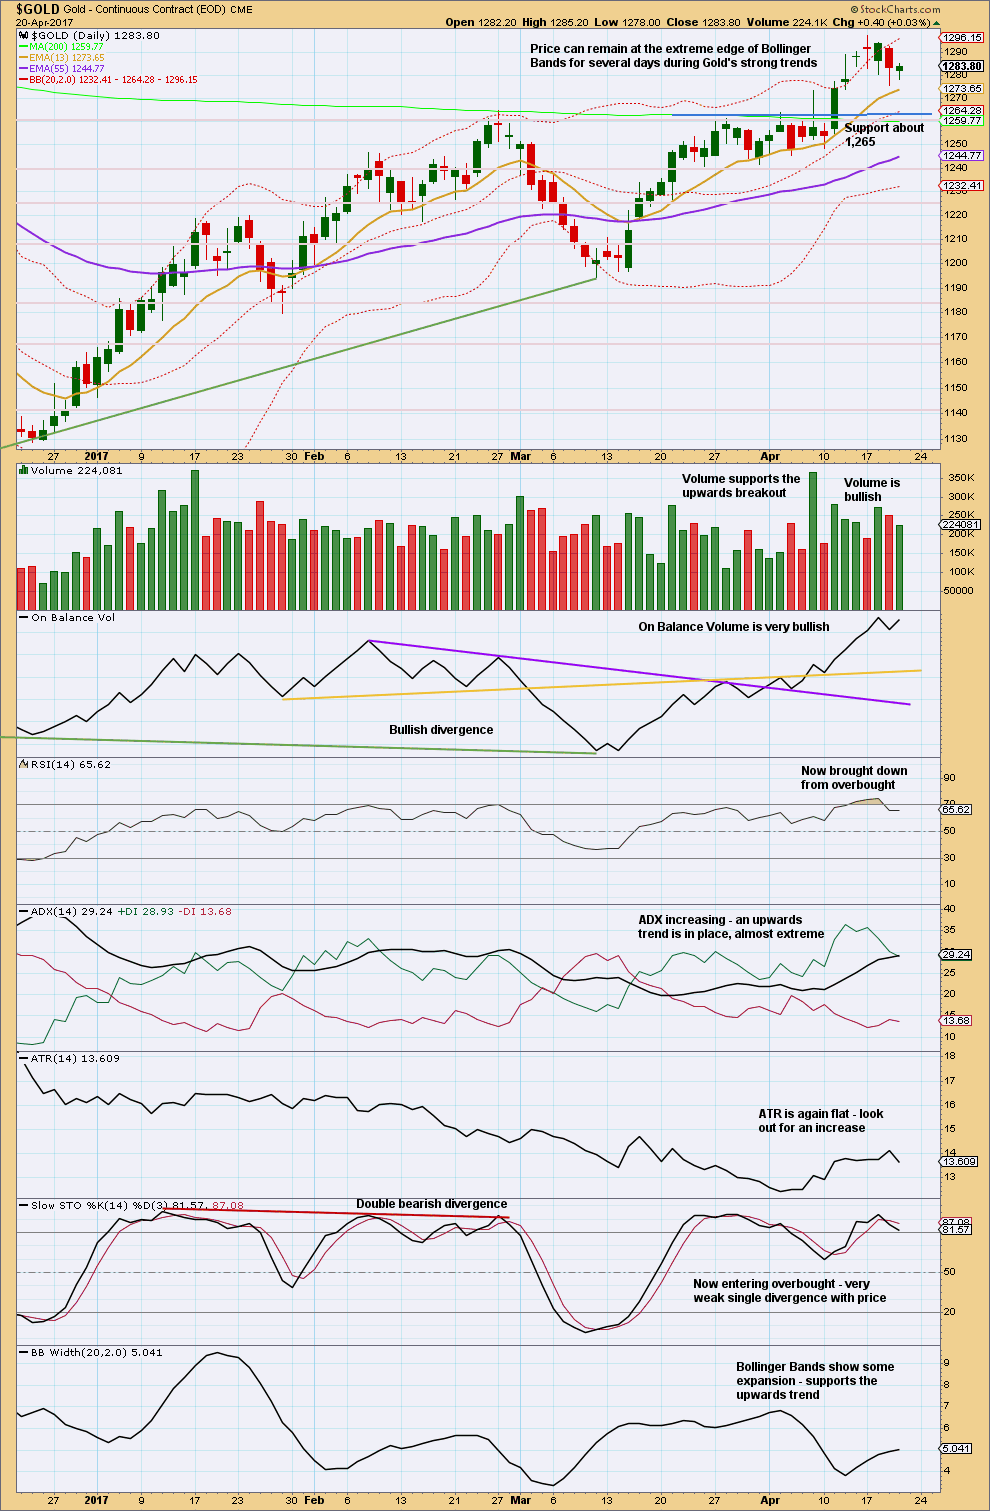
Click chart to enlarge. Chart courtesy of StockCharts.com.
I do not have confidence in the data from StockCharts for the daily candlestick for the 12th of April. As the session ended, I did not see a spike down to 1,278, which is their close, and creates the long upper wick on their candlestick.
It is very typical to see price curve around and test prior support or resistance after a breakout from a consolidation. This small pullback looks so far like a typical retest.
This does work more often than it doesn’t, but sometimes it does not work: price can return back into the consolidation area, as seen yesterday with GDX. Nothing in technical analysis is 100% certain, which is why risk management is so important. This is an exercise based upon probability, not certainty.
The long lower wicks of the last three daily candlesticks are bullish.
The decline in volume for the last two days looks like these candlesticks are part of a pullback and not necessarily a new trend.
On Balance Volume should be given reasonable weight in this analysis.
It is of slight concern today that ADX is nearing extreme. But it is not there yet.
It is not a concern that Stochastics is still overbought. This oscillator may remain extreme for long periods of time during Gold’s trends.
TRADING ADVICE
I have left my stop on my long position at 1,270.89. If price comes down again to the lower trend line, it may present another opportunity to add to long positions. Stops for new long positions may also be set at 1,270.89, but there is a risk here that a whipsaw may close out longs only to see price move higher. Alternatively, set stops just below 1,261 for new long positions here, and reduce position size to keep risk from 1-5% of equity.
Profit targets may be set at 1,333 in the first instance.
As always, risk management is the single most important aspect of trading. Take it seriously. My two Golden Rules are:
1. Always use a stop.
2. Invest only 1-5% of equity on any one trade.
GDX
DAILY CHART
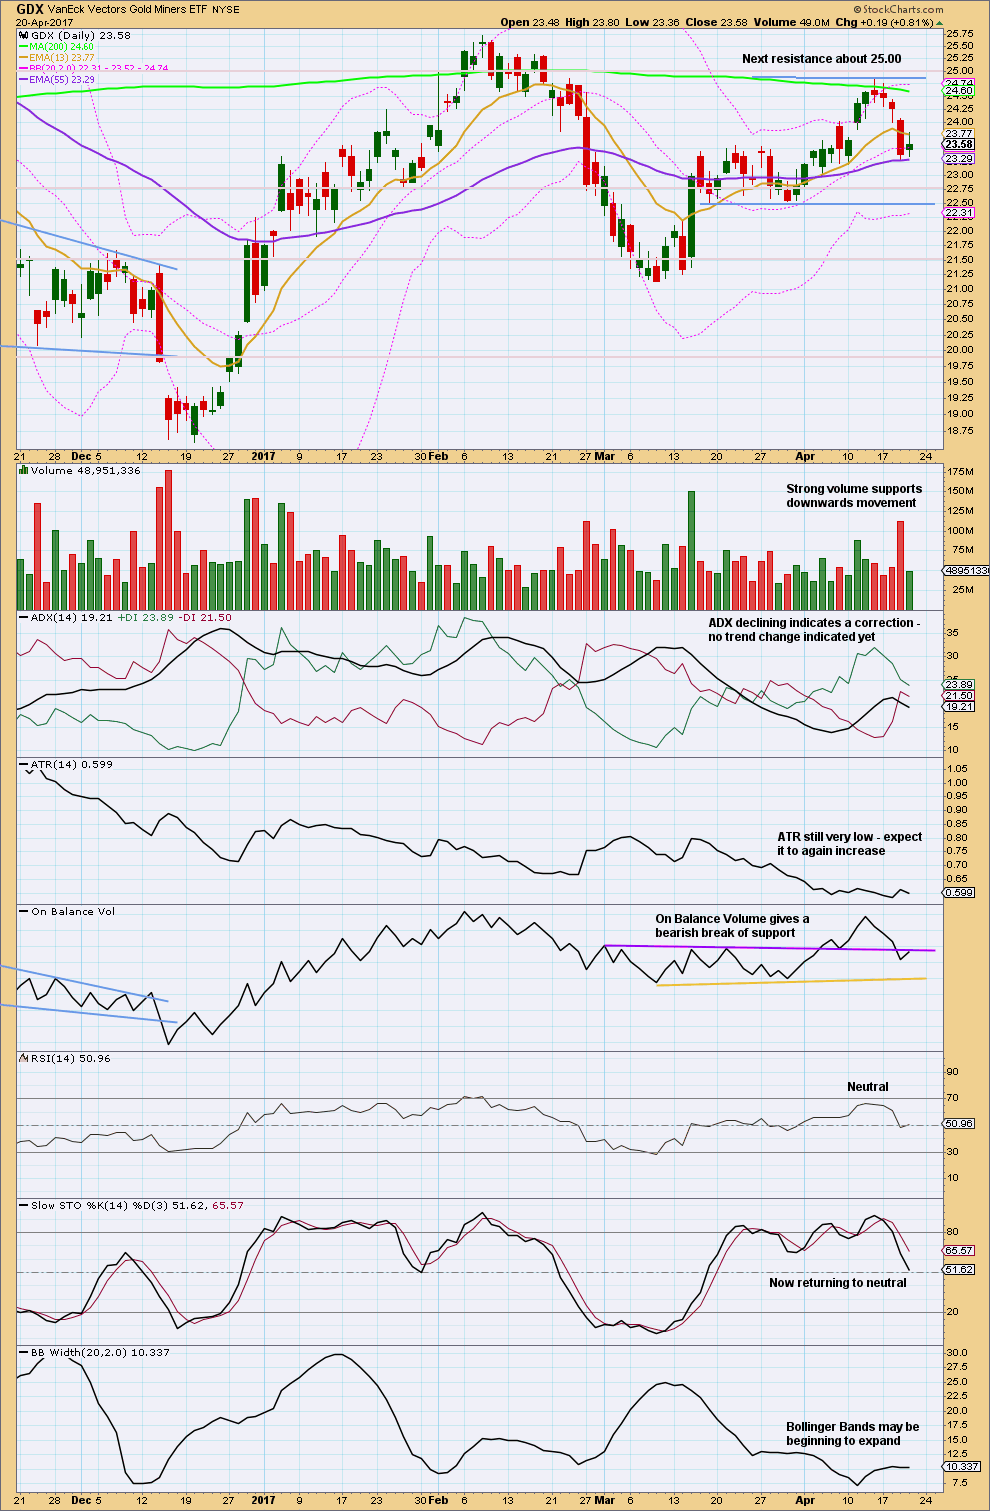
Click chart to enlarge. Chart courtesy of StockCharts.com.
Price is back within the prior consolidation zone. This zone is now widened. There is some distance to go before price may find support about 22.50.
On Balance Volume may halt a rise in price here by providing resistance. If OBV breaks back above the purple line, then the prior bearish signal will be negated.
Overall, this chart is now neutral to slightly bearish.
STUDY OF A THIRD WAVE IN $GOLD
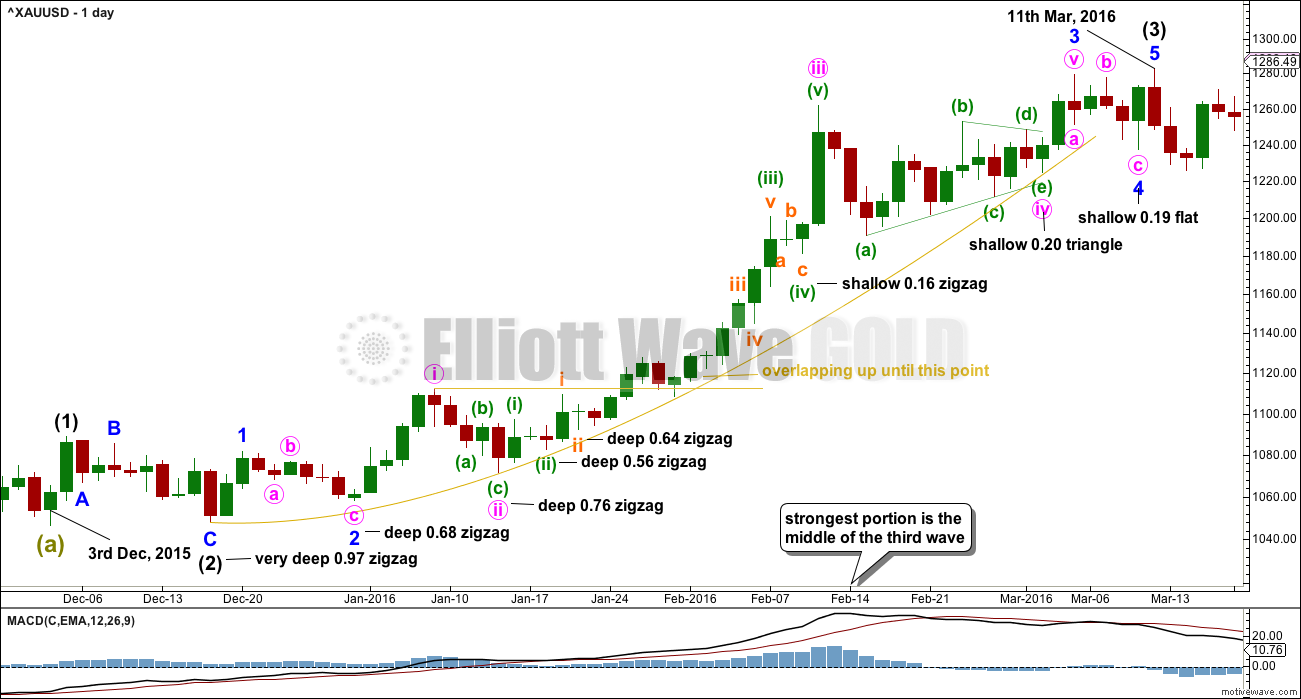
Click chart to enlarge.
This study of a third wave will be left in daily analysis until the current third wave is either proven to be wrong (invalidated) or it is complete.
This third wave spans 59 trading days.
It was not until the 40th day that the overlapping ended and the third wave took off strongly.
The middle of the third wave is the end of minute wave iii, which ended in a blow off top.
There is excellent alternation between second and fourth wave corrections.
This third wave began with a series of five overlapping first and second waves (if the hourly chart were to be added, it would be seven) before momentum really builds and the overlapping ends.
The fifth wave of minuette wave (v) is the strongest portion.
This third wave curves upwards. This is typical of Gold’s strong impulses. They begin slowly, accelerate towards the middle, and explode at the end. They do not fit neatly into channels. In this instance, the gold coloured curve was used.
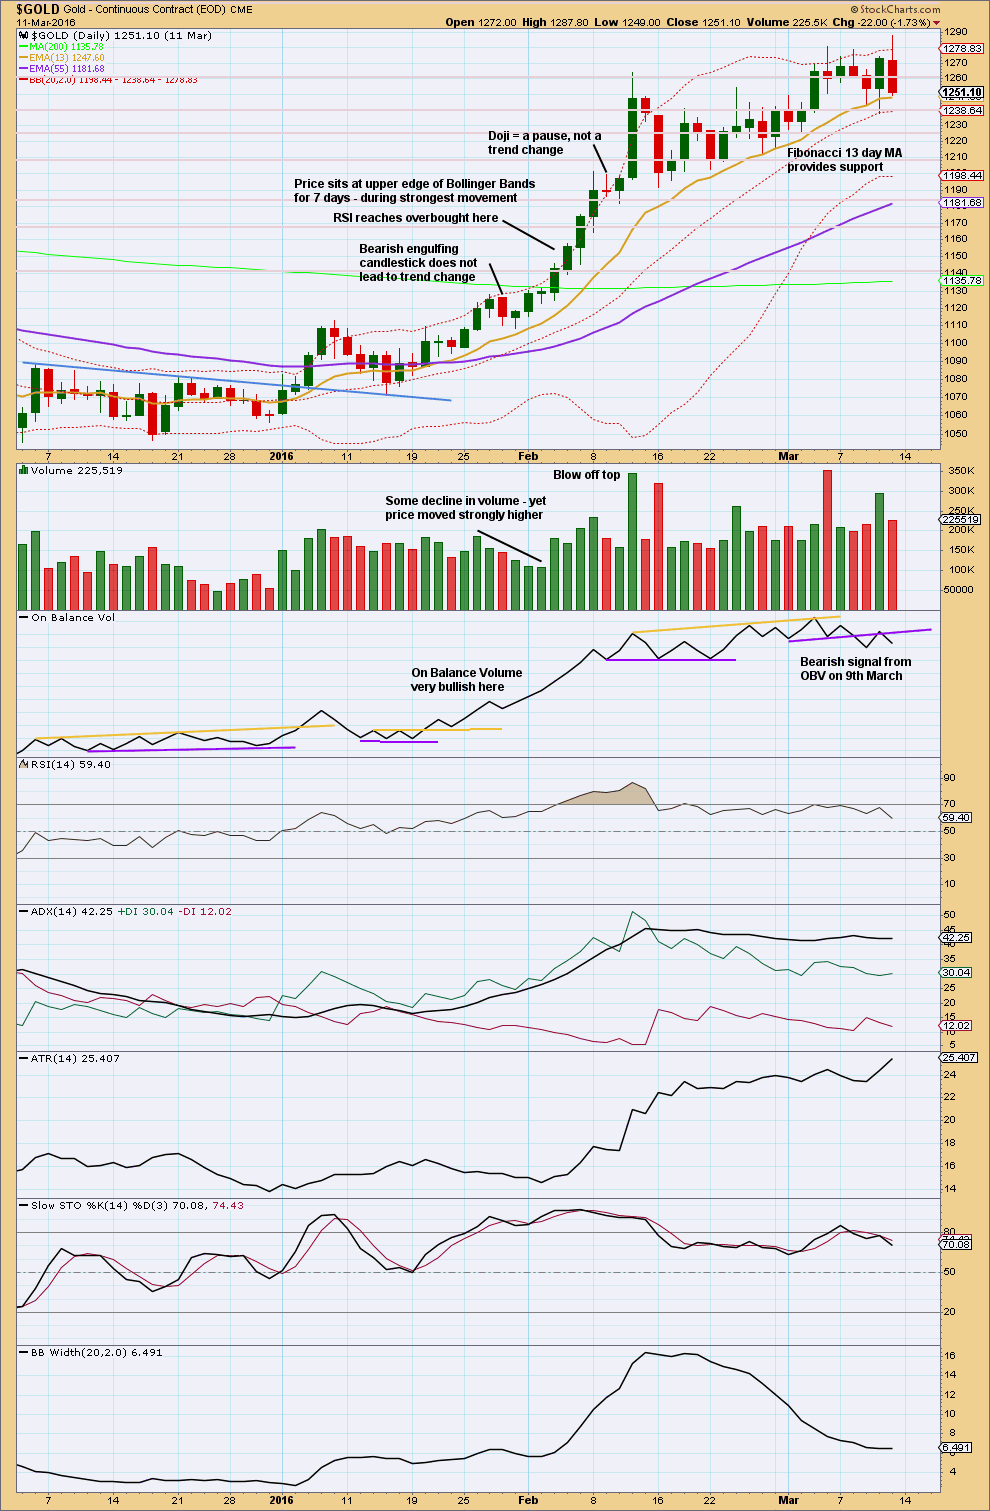
Click chart to enlarge. Chart courtesy of StockCharts.com.
This trend began after a long consolidation period of which the upper edge is bound by the blue trend line. After the breakout above the blue trend line, price curved back down to test support at the line before moving up and away.
RSI reaches overbought while price continues higher for another five days and RSI reaches above 85. The point in time where RSI reaches overbought is prior to the strongest upwards movement.
ADX reached above 35 on the 9th of February, but price continued higher for another two days.
The lesson to be learned here: look for RSI to be extreme and ADX to be extreme at the same time, then look for a blow off top. Only then expect that the middle of a big third wave is most likely over.
The end of this big third wave only came after the blow off top was followed by shallow consolidation, and more highs. At its end RSI exhibited strong divergence with price and On Balance Volume gave a bearish signal.
Third waves require patience at their start and patience at their ends.
This analysis is published @ 07:54 p.m. EST.
So, this was really awesome so I’ll share with you.
Out surfing the other day and a pod of dolphins came to play. They were the larger kind, not the small common variety (which are more energetic). The large ones seem to move more slowly… and they’re BIG! A bit scary at first.
They hung around… underneath, beside… waiting with us for the next wave. They’ll drop in on you too, they pay no attention to surfer etiquette 🙂
And this was the one day that I didn’t put my GoPro on my board 🙁 If I had got footage I would have shown you all.
Mega Cool!
Oh for some pics! 🙂
IKR! It’ll be another year before I see them like that again….
Must take GoPro on every surf session.
That is awesome!
I bet you were looking closely for shark fins….scary and cool!
Silver may be finding support at 50 day SMA.
I can see another wave count for Silver that may fit better with what I expect Gold to do. Silver may be completing an expanded flat (!) for minor 2 🙁
However, the long lower wicks on the last two daily candlesticks do look a bit bullish. I’d be expecting this pullback for Silver to be ending sooner rather than later, so this idea is definitely an alternate.
If that is what Silver is doing, that is going to be one sweet entry for a third to the upside! (For those still on the sidelines)
How I love to get up in the morning, open my trading account, and see lots of green. With profit protected 🙂
Everybody should have very nice profitable positions on US Oil today. Copper’s not doing too badly now.
For Copper: the last green daily candlestick had a long lower wick. Now this session looks like it may close as a red doji. It looks like the bounce might be over here and Copper may be ready for the next move down.
Stops for shorts still should be just above the last swing high for the 17th of April which FXCM data has it at 2.611.
If entering short here for Copper be prepared to have an underwater position for one to three days. I don’t think that’s highly likely, but it’s possible. The doji puts the trend from up to neutral (this is very short term). The candlesticks look like the small bounce is over, but it could move a bit higher.
For US Oil:
Move stops down to protect some profit. I’m going to expect that the high of 20th April at 51.39 (FXCM data) isn’t going to be taken out for a while IF my wave count is right.
So that looks like a good spot to protect a decent profit.
Updated hourly chart before the close:
The expectation is the same. If I’m right then minute iv is going to have to substantially break out of the channel.
Sometimes fourth waves do that. They just have no respect for channels. Most annoying, and they can come to nail biting ends. But that’s their tendency.
OR…
I’m wrong and minute iv is over already as a double zigzag. I’ve not published a chart for this because it would mean minute ii and iv are exactly the same corrective structures, double zigzags. This is possible because alternation is a guideline not a rule, but it has a very low probability. I think it may be too low for a reasonable consideration.
If the cyan trend line is breached and upwards momentum gets stronger early next week then I will consider the possibility that minute iv was over.
Oops! I meant to post this on the SPX site! Sorry about the mis-post…. 🙁
A move below 2338.17 fills open gap from yesterday and probably means wave E down of triangle underway…it usually falls short of the A-C trend-line and considering all the bankster pumping we have been seeing this is quite likely.
Lara’s count working well so far.
Rolling my USO bear credit spreads lower and taking profits. Opening 9.50/11.00, closing 10.00/11.00
What if, for gold, subminuette b has completed at today’s high of 1285.17 (nice-looking 3 waves), and is now on the way down to complete subminuette c, minuette y, and Minute 4?
Possible targets are:
(1) 1275.77, where Minute 4 = 0.382 * Minute 3;
(2) 1275.76, where minuette y = 1.272 * minuette w; and
(3) 1274.33, where minuette y = 1.382 * minuette w.
This ties in well with the Ichimoku support of 1272.80.
This idea is invalidated with a new high.
Silver falling below its 50 day sma. A close below means Gold will probably follow…
Finally, for gold.
On a daily basis, the trend is still healthy bullish.
First support is at 1272.80 (tenkan-sen), followed by 1259.95 (top of the cloud). The next support at 1247.10 (kijun-sen) is too low to be of consideration.
Resistance is at 1283.80 (chikou-sen).
For those who trade NUGT, do note that prices have lately entered into the red cloud. The change in colour in the cloud from green to red is the first warning of a trend change. That prices are still within the cloud indicates the trend is still neutral. Moreover, tenkan-sen (blue) is still above kijun-sen (red) meaning no bearish crossover has occurred yet.
Price lies between the tenkan and kijun lines, meaning that it is consolidating.
For today, resistance is at 10.54 (tenkan-sen) and the top of the cloud boundary at 10.55. If price could break these with a full daily candlestick, then the bullish trend may try to assert itself.
Support is at 9.84, cloud lower boundary, followed by 9.61 (kijun-sen).
All is not well with GDXJ at the moment.
Prices are way below the cloud, and the cloud is turning red. Prices are also below the tenkan and kijun lines. It would indicate a strong bearish trend.
There is also a negative crossover of the tenkan and kijun lines. This is similar to the negative crossover in the moving averages, in this case, the 9-day crossed below the 26-day.
Rambus is a gold and miner BEAR
https://rambus1.com/2017/04/19/wednesday-report-163/
Just a solid breach of longer term trend line is required. I feel that the breach will be massive and solid. This line has been tested frequently in last six months now and its tend to be breached. Atleast my experience force me to assume that. Once its breached than gold will enter in a bull market for which it was waiting since many years now.😊
Another look at correlations:
It is often assumed that Gold has a correlation to other markets. There is an incredibly quick and accurate measure of whether or not this is true. Use “correlation” from indicators on StockCharts to see the correlation coefficient.
For any market to have a reliable correlation with another the correlation coefficient must be reliably either above 0.5 (showing a positive correlation) or below -0.5 (showing a negative correlation).
Any markets which have a correlation coefficient that fluctuates between 0.5 and -0.5 from time to time does not have a reliable correlation. If this is the case it would be dangerous to assume that any correlation which may present from time to time will persist. Assume it won’t, because it has not before.
As you can see here Gold does not have a correlation to USDJPY. It often does, and this can be strong for periods of time, but it is quite simply not reliable enough to base any analysis on.
Nor rather surprisingly does Gold have a reliable correlation to the USD index. In fact, this may be less reliable even than the relationship to USDJPY.
Thanks for that important reminder Lara. I cannot tell you how many analysts are insisting that Gold is going to do this or that because the Dollar or the Yen is doing so and so, and which conflation can often lead to wrong decisions by their readers. I find that I have to constantly remind myself that it ain’t necessarily so! 🙂
You’re welcome.
The math is pretty simple. And more accurate than assumptions 🙂
Silver dipped below its 200 day sma today. Gold still above. The miners and related instruments remain below or were rejected at this pivot recently. Looks like more consolidation ahead…
Members please note:
Comments on Trading Room appear to be not working.
Until Cesar has fixed this issue I will make comments on Trading Room trades here in Gold daily analysis. You will have to read these comments daily.