
A weak upwards day exactly fits the expectation from last analysis.
Summary: The correction is still most likely incomplete. It may continue further for yet another one to few days. Thereafter, the upwards trend should resume. The target for long positions remains at this stage at 1,333. If this is wrong, it may not be high enough.
New updates to this analysis are in bold.
Grand SuperCycle analysis is here.
Last monthly and weekly charts are here.
MAIN ELLIOTT WAVE COUNT
DAILY CHART – DETAIL
Click chart to enlarge.
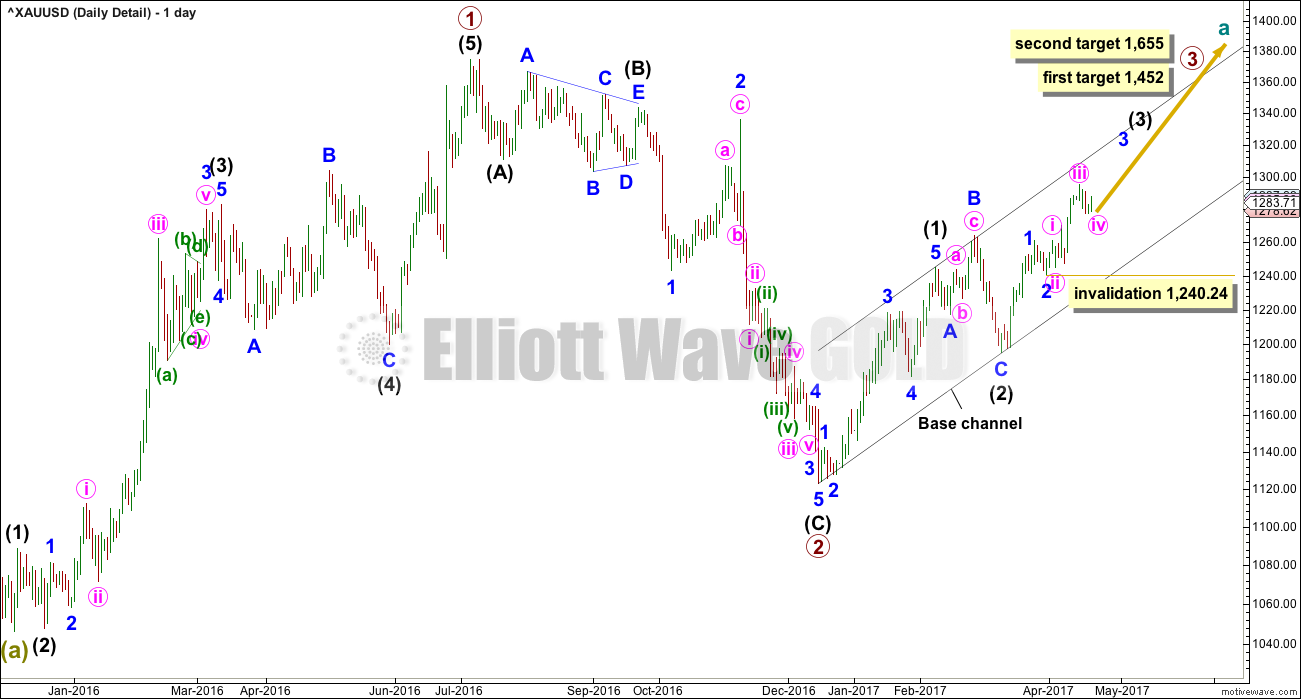
This chart steps back to see all movement since the important low on the 3rd of December, 2015.
To see how this fits into the bigger picture, please see the last historic analysis linked to at the start of this analysis.
The first upwards movement labelled primary wave 1 fits well as a five wave impulse. Primary wave 2 fits as a zigzag. It would be difficult to see the downwards wave of primary wave 2 as an impulse because that would require ignoring what looks very much like a triangle at its start (labelled intermediate wave (B) ). To see this as an impulse that movement would need to be a second wave correction, but second waves do not subdivide as triangles.
Primary wave 3 should have begun. Within it intermediate waves (1) and (2) should be complete. Intermediate wave (2) is a very common expanded flat correction.
My only concern at this stage is the labelling of minute wave iii as complete. It is possible that the middle portion of this third wave at three degrees has passed, if the next waves up for minute wave v and minor wave 5 are both very long and strong extensions.
It may also be possible that the middle of the big third wave has not passed and the degree of labelling within minor wave 3 needs to be moved down one degree. If minute wave ii is yet to unfold, it may not move beyond the start of minute wave i below 1,240.24.
DAILY CHART

Click chart to enlarge.
This daily chart will suffice for both weekly charts, which can be seen in the last published historic analysis.
Upwards movement at primary degree is either a third wave (first weekly chart) to unfold as an impulse, or a Y wave (second weekly chart) to unfold as a zigzag. If upwards movement is a zigzag for primary wave Y, then it would be labelled intermediate waves (A) – (B) and now (C) to unfold. It is most likely a third wave because cycle wave a is most likely to subdivide as an impulse.
Intermediate wave (1) or (A) is a complete five wave impulse lasting 39 days. Intermediate wave (2) or (B) looks like an expanded flat, which is a very common structure.
So far, within intermediate wave (3) or (C), minor waves 1 and 2 are now complete. Minor wave 3 looks to have begun. Within minor wave 3, the middle portion for minute wave iii may now be complete. Minute wave iv may not move into minute wave i price territory below 1,261.00.
Minute wave v is expected to be very strong, possibly ending with a blow off top.
A cyan trend line is added to all charts. Draw it from the high in October 2012 to the high in July 2016. This line has been tested five times. Price is finding resistance at the cyan trend line now. If price can break through resistance here after some consolidation, then that may release energy to the upside for the end of minor wave 3.
HOURLY CHART
Click chart to enlarge.
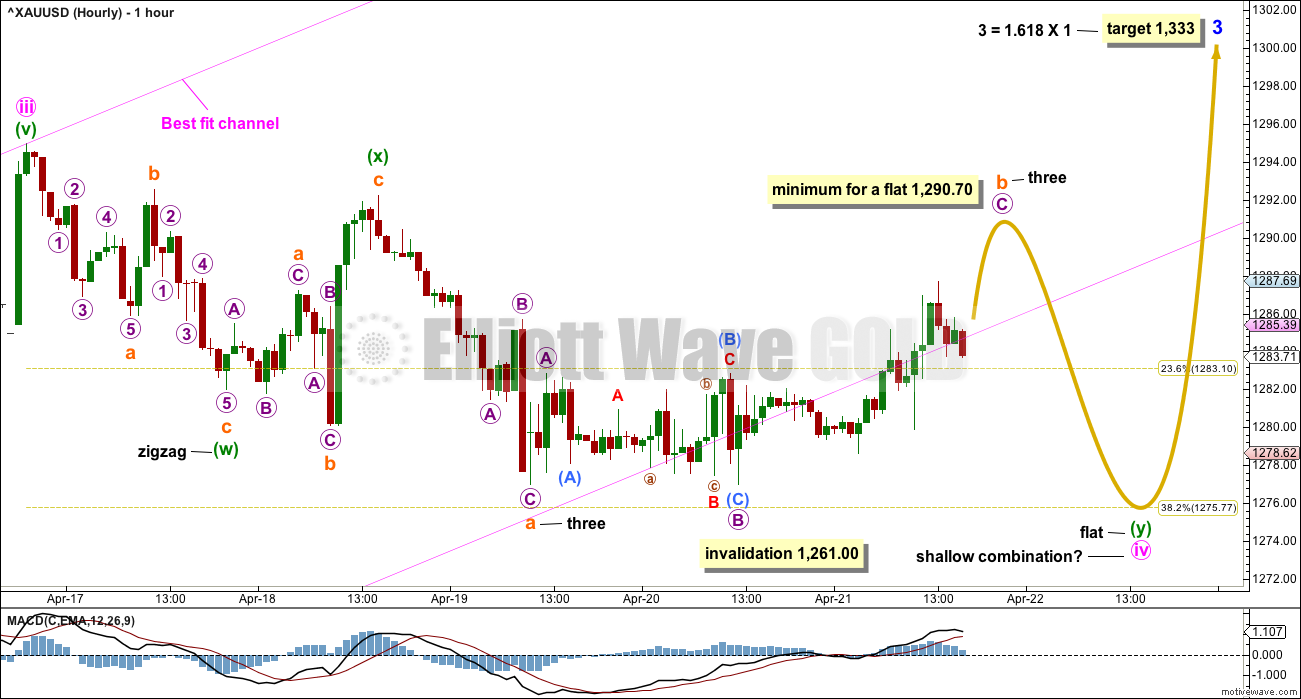
Minute wave ii was a deep 0.79 double zigzag, which lasted 25 hours, and on the daily chart it shows as only one session.
Given the guideline of alternation, minute wave iv may be expected to most likely be a flat, combination or triangle. All of these structures may include a new high above its start at 1,294.96 as part of the correction. A new high does not indicate minute wave iv is over.
Combinations, flats and triangles are all usually more longer lasting structures than zigzags.
At this stage, a flat correction for minute wave iv may be ruled out because there is no upwards wave within it that has retraced a minimum 0.9 length of any downwards wave within it. The minimum length for minuette wave (b) within a flat correction for minute wave iv has not been met.
A triangle does not look likely at this stage. Often MACD hovers about the zero line while a triangle unfolds. If it starts to do that and price just meanders sideways, then a triangle would be indicated and published again.
A combination looks most likely at this stage.
If minute wave iv is a combination, then the first structure within it labelled minuette wave (w) may be a complete zigzag.
The two structures in the double may be joined by a complete three in the opposite direction labelled minuette wave (x), which subdivides as an expanded flat correction.
Minuette wave (y) may have begun. It may be either a flat or a triangle.
At this stage, minuette wave (y) looks like it may be continuing further as a flat correction. Within the flat correction, subminuette wave b must retrace a minimum 0.9 length of subminuette wave a. Subminuette wave c would then be very likely to end at least slightly below the end of subminuette wave a at 1,276.96 to avoid a truncation and a very rare running flat.
If minuette wave (y) is a flat correction, then at its end it will have to break below the parallel copy of the best fit channel, copied over from the daily chart. Fourth waves are not always neatly contained within channels.
It is also possible that minuette wave (y) may yet unfold sideways as a triangle and remain all or almost all within the best fit channel.
Minute wave iv may not move into minute wave i price territory below 1,261.00.
ALTERNATE HOURLY CHART

Click chart to enlarge.
What if minute wave iv is over, finding support close to the lower edge of the best fit channel?
This is only possible if it is seen as a complete double zigzag. Minute wave ii fits as a double zigzag.
Alternation is a guideline and not a rule; it does not have to be seen. Very occasionally second and fourth waves do take the same structural form. Because this is not common, the probability of this wave count is low.
There would be alternation in depth: minute wave ii was a very deep 0.79 correction while minute wave iv is a shallow 0.36 correction.
If price can break above the cyan trend line early next week, then this wave count would increase in probability to be the main wave count. At that stage, expect a strong increase in upwards momentum and look out for a blow off top.
Within minute wave v, the upcoming correction for minuette wave (ii) may not move beyond the start of minuette wave (i) below 1,276.96.
TECHNICAL ANALYSIS
WEEKLY CHART
Click chart to enlarge. Chart courtesy of StockCharts.com.
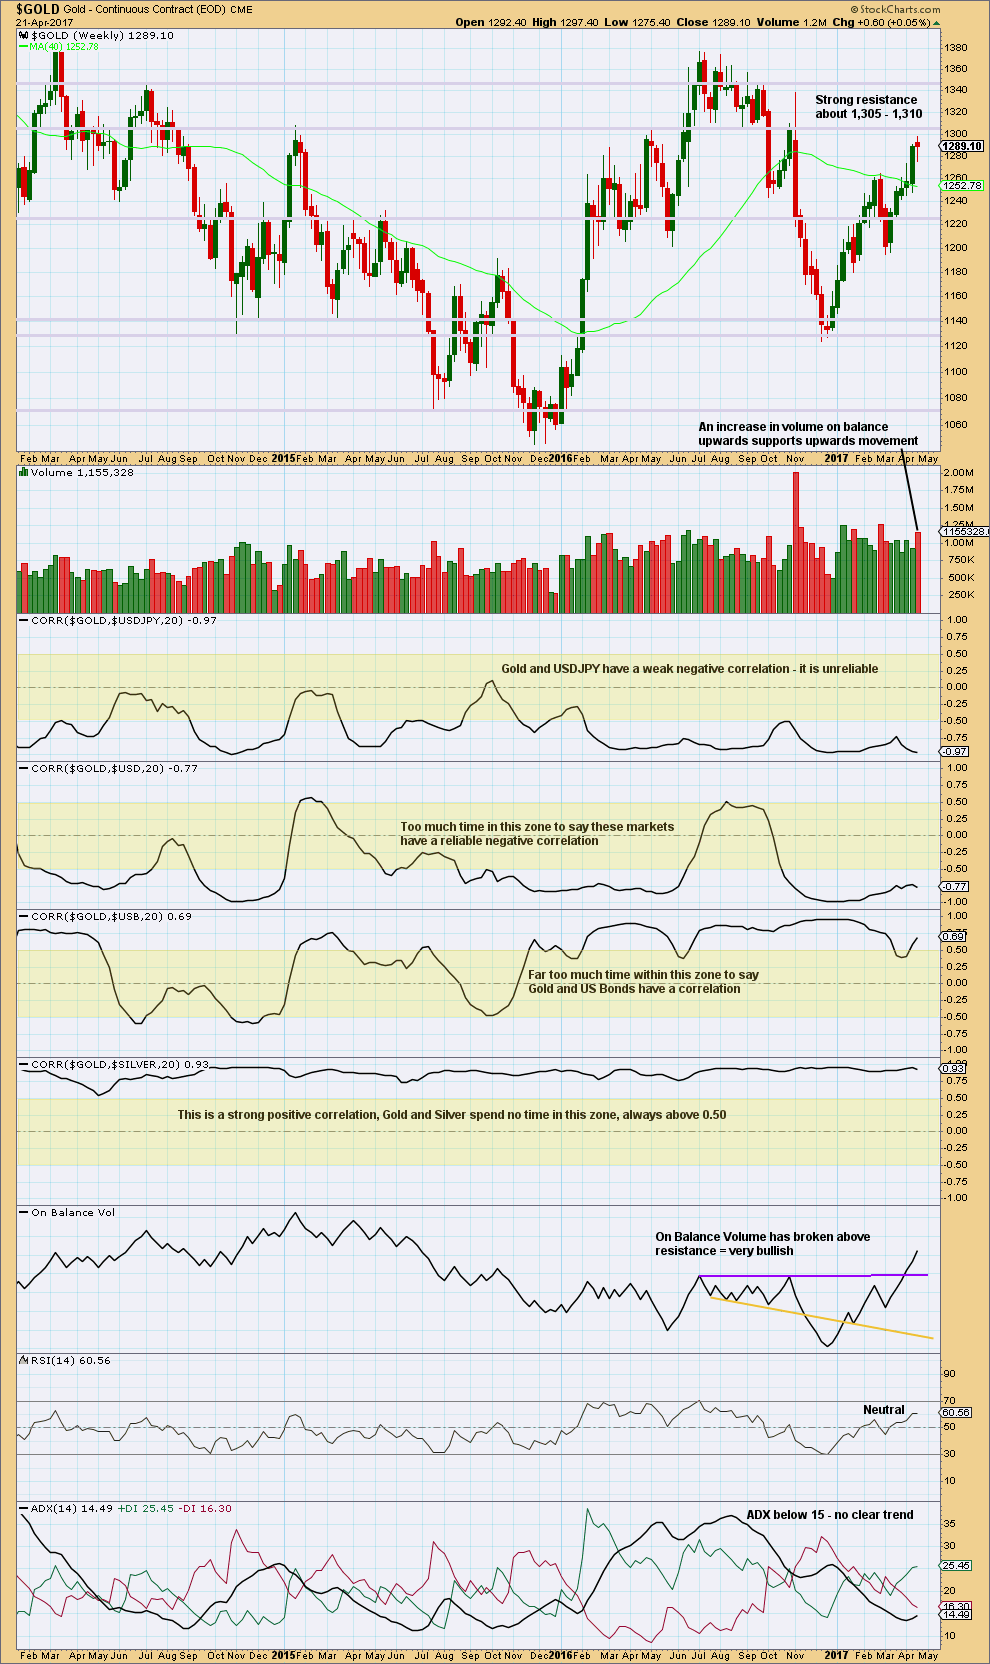
There are a lot of assumptions out there about Gold and its relationships to various other markets. Happily, there is a quick and easy mathematical method to determine if Gold is indeed related to any other market: StockCharts have a “correlation” option in their indicators that shows the correlation coefficient between any selected market and the one charted.
The correlation coefficient ranges from -1 to 1. A correlation coefficient of 1 is a perfect positive correlation whereas a correlation coefficient of -1 is a perfect negative correlation.
A correlation coefficient of 0.5 to 1 is a strong positive correlation. A correlation coefficient of -0.5 to -1 is a strong negative correlation.
Any two markets which have a correlation coefficient that fluctuates about zero or spends time in the 0.5 to -0.5 range (shown by highlighted areas on the chart) may not be said to have a correlation. Markets which sometimes have a positive or negative correlation, but sometimes do not, may not be assumed to continue a relationship when it does arise. The relationship is not reliable.
For illustrative purposes I have included the correlation coefficient between Gold and Silver, which is what strong and reliable correlation should look like.
Gold made a higher high and a higher low this week, although the candlestick has closed red. An increase in volume is bullish. The long lower wick on the candlestick is also bullish although the colour is bearish.
ADX does not yet indicate a trend. If it reaches 15 or above, then it would indicate an upwards trend. RSI indicates there is still plenty of room for price to rise. This chart is bullish.
DAILY CHART
Click chart to enlarge. Chart courtesy of StockCharts.com.
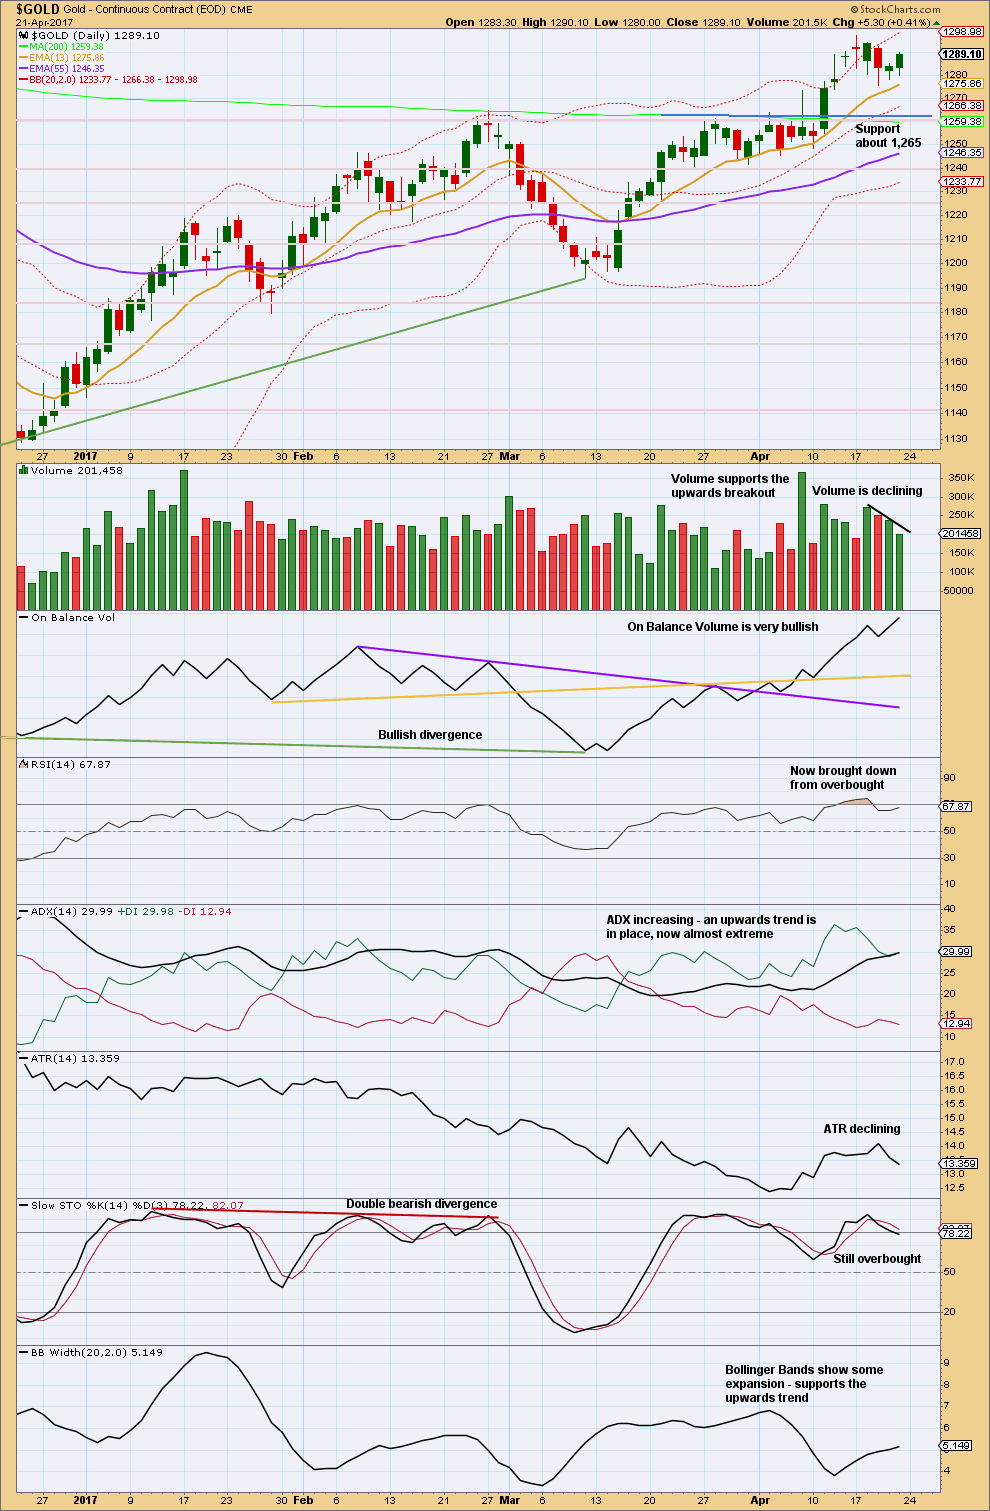
I do not have confidence in the data from StockCharts for the daily candlestick for the 12th of April. As the session ended, I did not see a spike down to 1,278, which is their close, and creates the long upper wick on their candlestick.
The long lower wicks on the last four daily candlesticks are bullish.
Volume indicates the last two upwards days may be still part of a consolidation and not yet the resumption of the upwards trend. This favours the main hourly Elliott wave count.
The only concern here for the main hourly Elliott wave count is ADX at almost extreme. Usually, when the black ADX line reaches above both directional lines the trend ends there or within a day or two. This may favour the main Elliott wave count; a couple of days of further consolidation with a slightly deeper move at the end may flatten the black ADX line allowing it to draw away from the +DX line. Alternatively, a strong upwards move may pull the +DX line back above the ADX line.
Price may find support about the Fibonacci 13 day moving average.
The short and mid term moving averages have a positive slope and price is above both. An upwards trend for the short and mid term is indicated. The long term 200 day moving average may be flattening off; it is still declining but only very slightly. If it begins to have a positive slope, it may be rolling over.
GDX
DAILY CHART
Click chart to enlarge. Chart courtesy of StockCharts.com.
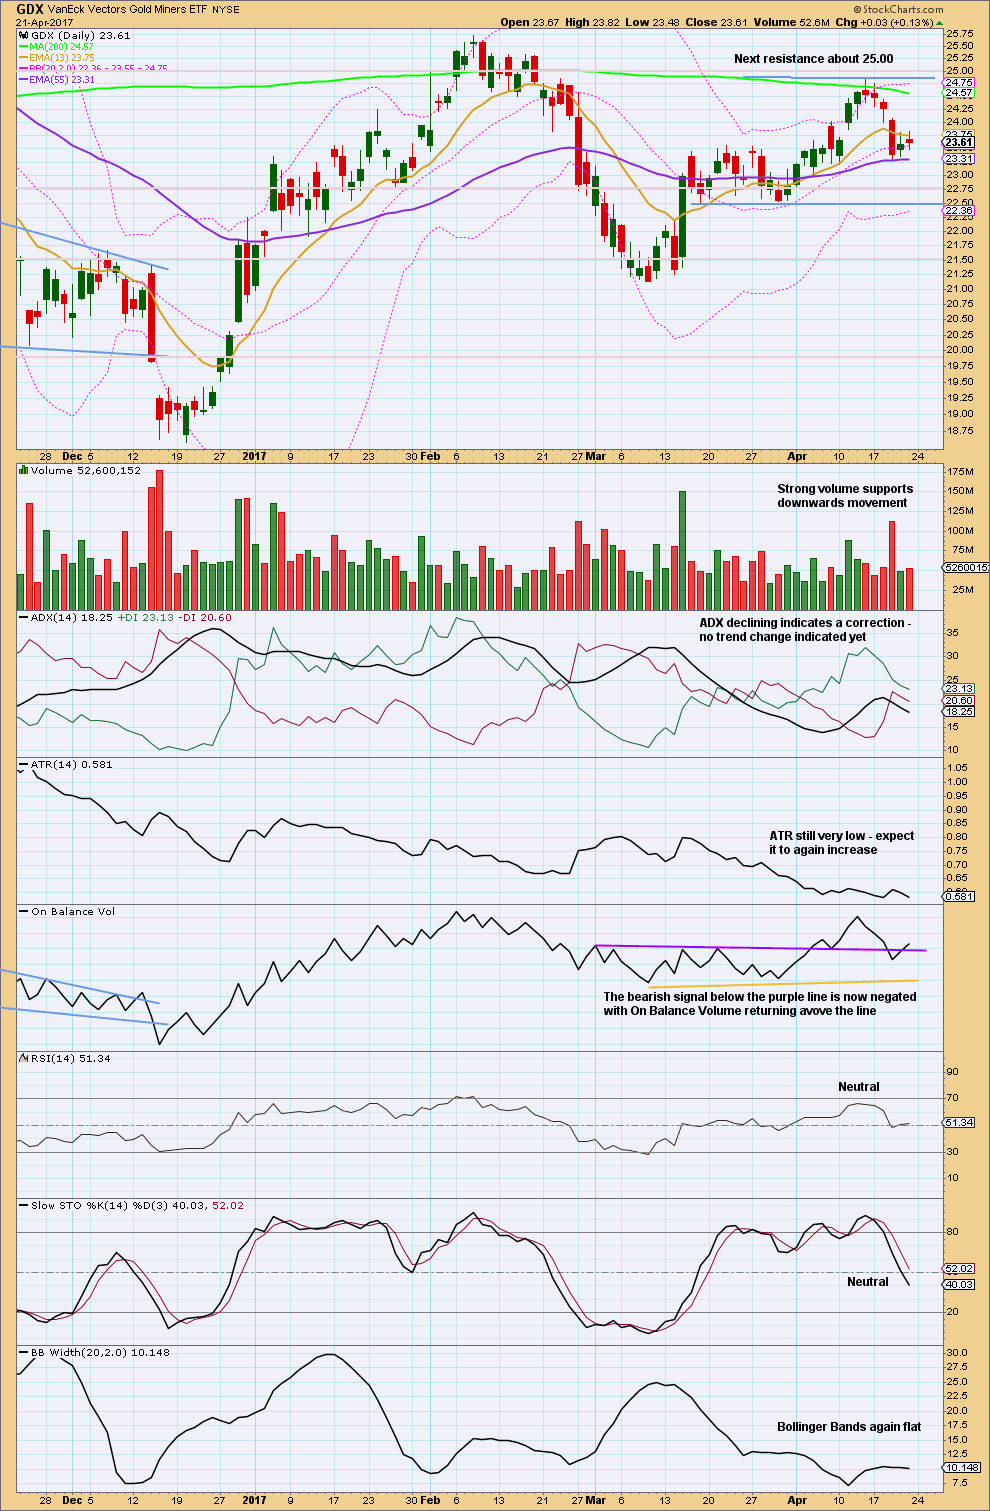
Price is back within the prior consolidation zone. This zone is now widened. There is some distance to go before price may find support about 22.50.
With ATR declining, ADX declining, and Bollinger Bands tightly contracted, this downwards movement looks like a pullback and not a new downwards trend. Support is about 22.75 and next about 22.50.
STUDY OF A THIRD WAVE IN $GOLD
Click chart to enlarge.
This study of a third wave will be left in daily analysis until the current third wave is either proven to be wrong (invalidated) or it is complete.
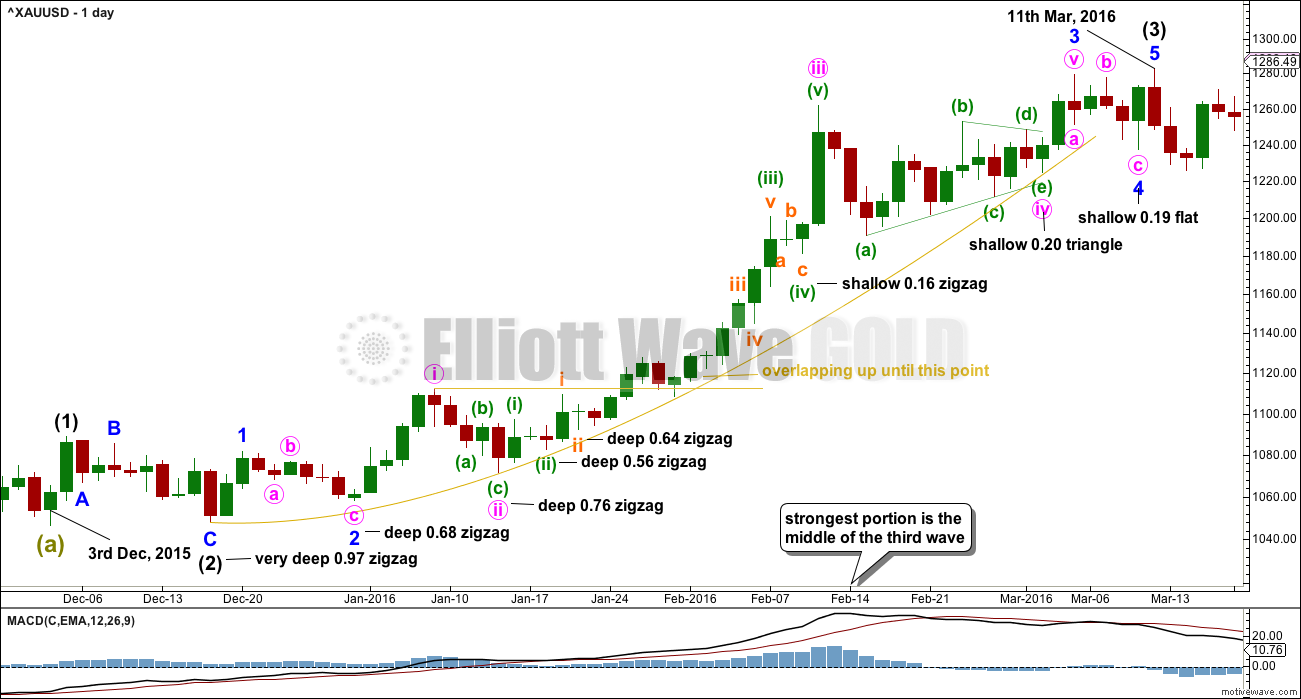
This third wave spans 59 trading days.
It was not until the 40th day that the overlapping ended and the third wave took off strongly.
The middle of the third wave is the end of minute wave iii, which ended in a blow off top.
There is excellent alternation between second and fourth wave corrections.
This third wave began with a series of five overlapping first and second waves (if the hourly chart were to be added, it would be seven) before momentum really builds and the overlapping ends.
The fifth wave of minuette wave (v) is the strongest portion.
This third wave curves upwards. This is typical of Gold’s strong impulses. They begin slowly, accelerate towards the middle, and explode at the end. They do not fit neatly into channels. In this instance, the gold coloured curve was used.
Click chart to enlarge. Chart courtesy of StockCharts.com.
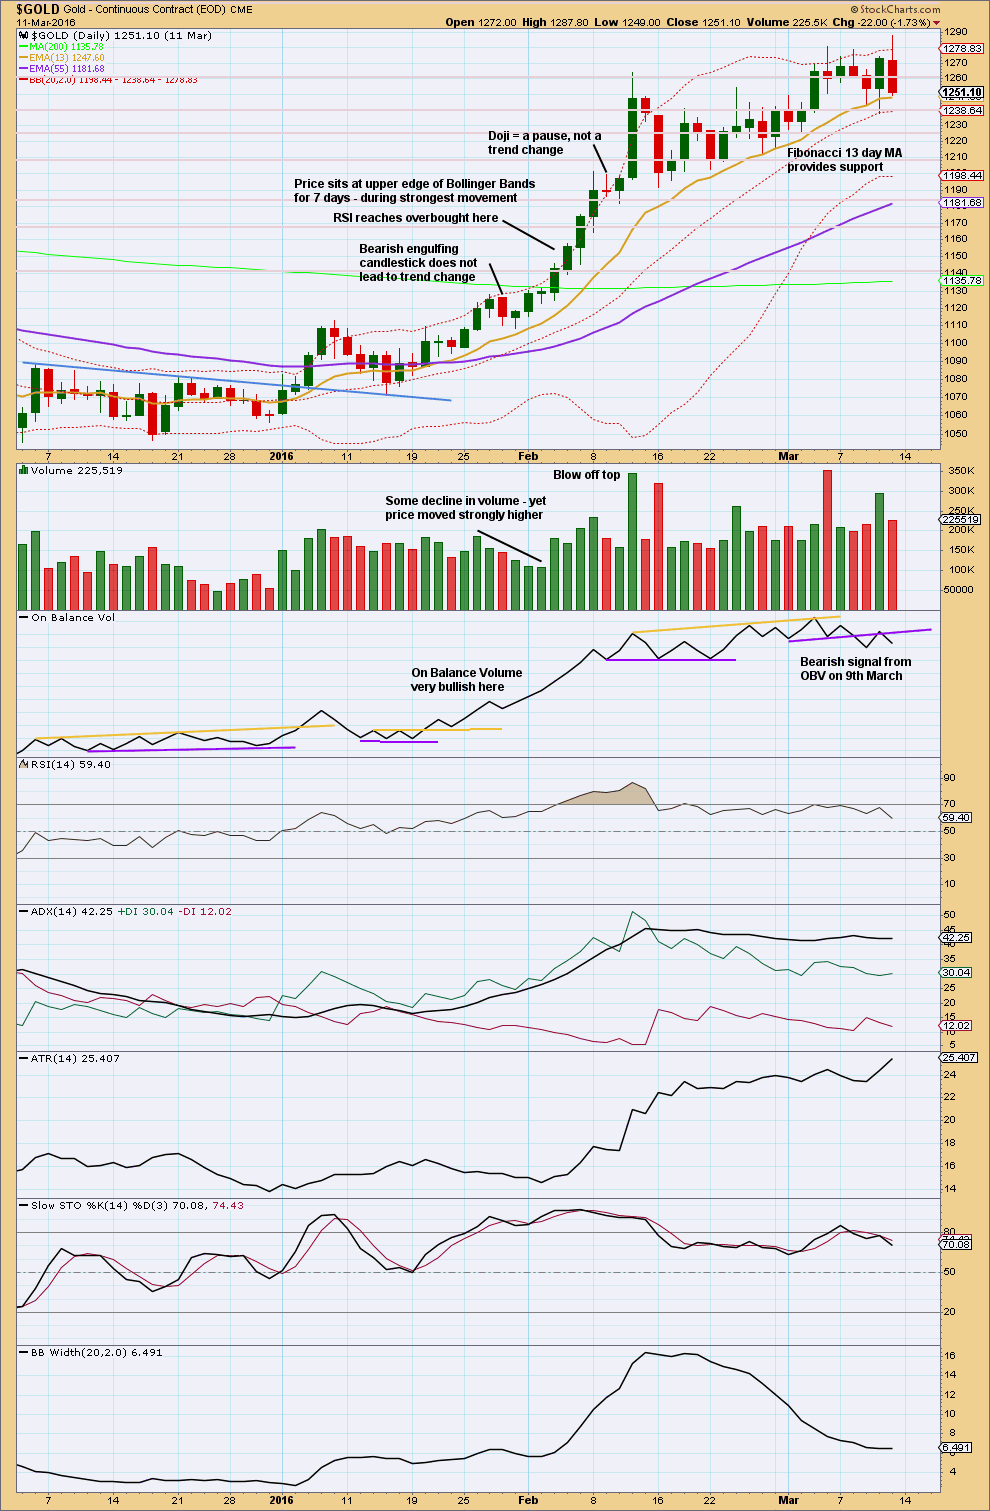
This trend began after a long consolidation period of which the upper edge is bound by the blue trend line. After the breakout above the blue trend line, price curved back down to test support at the line before moving up and away.
RSI reaches overbought while price continues higher for another five days and RSI reaches above 85. The point in time where RSI reaches overbought is prior to the strongest upwards movement.
ADX reached above 35 on the 9th of February, but price continued higher for another two days.
The lesson to be learned here: look for RSI to be extreme and ADX to be extreme at the same time, then look for a blow off top. Only then expect that the middle of a big third wave is most likely over.
The end of this big third wave only came after the blow off top was followed by shallow consolidation, and more highs. At its end RSI exhibited strong divergence with price and On Balance Volume gave a bearish signal.
Third waves require patience at their start and patience at their ends.
This analysis is published @ 09:25 p.m. EST.
[Note: Analysis is public today for promotional purposes. Trading advice and member comments and discussion will remain private.]
TRADING ADVICE
I have left my stop on my long position at 1,270.89. With price fluctuating about the lower trend line, this may be another opportunity to enter long positions. But if the main Elliott wave count is correct, they may be underwater for a couple of days. Stops for new long positions may also be set at 1,270.89, but there is a risk here that a whipsaw may close out longs only to see price move higher. Alternatively, set stops just below 1,261 for new long positions here, and reduce position size to keep risk from 1-5% of equity.
Profit targets may be set at 1,333 in the first instance.
As always, risk management is the single most important aspect of trading. Take it seriously. My two Golden Rules are:
1. Always use a stop.
2. Invest only 1-5% of equity on any one trade.
Expecting another pullback for Gold price on Tuesday; Silver though looks to be looking to rally, hmmm got to be a juggle lol…
Silver tenuously holding onto its 50 day SMA. If it it is surrendered the next 24 hours we may have some more downside ahead. I am holding my JDST hedges as they have done SQUAT during the current pullback. Maybe I’ll just grab myself some puts on the metals themselves. The miners sure are acting weird.
VIX has been behaving very strangely indeed for some weeks now. Very strange strong daily divergence with the S&P500… which then doesn’t predict anything.
It’s like it’s decoupled.
VIX is now the plaything of an army of trading bots and trigger happy short-sellers. It has lost much of its utility as a so-called “fear gauge” and I personally also have my doubts as to whether it is still actually a hard number reflecting an actual put/call ratio. The absence of any meaningful correction in the market in many months means there has been absolutely no capitulation of any kind in the VIX in months, and I wager that massive short positions remain uncovered, with a ton more being added today. At some point they will unwind and trying to figure out when is futile. I would not be surprised to see it remain under 15 during the next 10% market decline. There is no fear in the market, and has not been for quite some time. SVXY will porbably clear 200 on the next wave up.
Yes I asked for the FTSE analysis, thanks Lara
Great.
It’s had a nice strong bounce today. That main wave count so far looks correct.
Someone asked for FTSE in Trading Room. I’ve done an analysis of FTSE but I wasn’t confident enough of it’s next direction to put it in Trading Room. It’s public over at Elliott Wave Stock Market.
I’m changing the wave count. What is the main count above will now be an alternate.
This move looks too big to be a fourth wave, and I was concerned that the count saw the middle of a big third having passed also.
So another first and second wave looks better now.
The long lower wick on today’s candlestick is bullish. If volume is lighter for a downwards day that will add confidence that it’s a pullback within a larger upwards trend. If it’s heavier then we should expect the pullback isn’t done.
Detail of minute i on the hourly chart.
I’ll do a comparison of Fibonacci ratios between this and how I’ve previously had the hourly chart.
GLD, quite surprisingly, showing lower volume today than last few up days. GDX volume very low. Same with NUGT and JNUG. Interesting
I wonder what effect a North Korean nuclear or ICBM test will have if it goes ahead tomorrow (as widely speculated)
From my perspective, it appears all the tells I listed on Friday, miners and jr. miners lagging, silver lagging, USD/JPY bottoming and rising, were correct in forewarning/identifying the gold move down we are experiencing today.
When I look at the negative correlation of Gold to USD/JPY, it appears that about 80% of the time it is -.50 to -1…and the last 15 months or so, the correlation has been very strong. It is -.97 now. So most of the time it is a worth a look to help confirm or not other indicators like the miners, which have led up and down over the past year.
Gold appears headed to 1260ish for maybe a bounce but the 1251 CHVN a probable target here.
“When I look at the negative correlation of Gold to USD/JPY, it appears that about 80% of the time it is -.50 to -1…and the last 15 months or so, the correlation has been very strong. It is -.97 now. So most of the time it is a worth a look to help confirm or not other indicators like the miners, which have led up and down over the past year.”
I have a really big problem with this statement David.
You could have said exactly the same thing about Gold and USDJPY back in November 2014 or May 2015. In both cases the correlation at that point was very strong, over -0.9.
But in both cases that was the point in time at which the negative correlation broke down.
That’s why any correlation between two sets of data that spends time regularly fluctuating between 0.5 to -0.5 is not reliable.
It is not wise to base your analysis upon anything which is mathematically proven to be unreliable.
Lara, I read David’s statement earlier today, and I remember you writing up a detailed explanation on the correlation numbers a while back. Not sure what date you did that. But I have a question here. It seems to me that you and David are talking about different numbers. Is that incorrect?
David refers to (on the negative side) -.5 to -1.0
And you refer to (on the negative side) 0 to -.5
So his numbers were outside of the correlation to which you refer. Can you shed some light on this? And maybe refer me to the date you posted your prior information on correlations?
Thanks much.
There is a very nice segment on this subject within the most recent end of week video
Thanks Ben. Hadn’t viewed the video this week. (of course! lol)
We’re actually not talking about different numbers, and we both have the weekly chart above in the analysis which shows the correlation between Gold and USDJPY.
David is correct when he refers to a strong negative correlation being two sets of data with a correlation coefficient between -0.5 to -1.0.
I’m pointing out that the two sets of data, Gold and USDJPY, are not consistently between -0.5 and -1. For these two sets of data they often have a correlation coefficient which shows they are not correlated.
My point is these two sets of data are not reliably negatively correlated. So our analysis should not assume any existing correlation will continue. Because the data shows it has not in the past.
The error that is commonly made regarding correlation is thinking that the coefficient is time dependent. Two things are either correlated, or they are not, whatever the time frame, and that is what r tells you. if the coefficient falls outside the value that confirms correlation, this does not mean that there are not periods where data sets may move together. If r says there is no correlation, that is in fact the worst possible time to invoke correlation for a particular time frame – particularly to make trading decisions. Even before Lara clearly pointed that out, I learned that fact empirically. It is a hard habit to overcome when you hear it repeated so often.
Lara, I think you’ll find this interview with Robert Prechter quite enlightening. Looks like he is behind the “bending” of the ED rule…
“Until we have a statistical answer to the question of when to allow this or that variation, the best answer is a practical one, and here is mine: The only time an analyst should allow an imperfection in a wave is retrospectively when all other aspects of the wave demand it. Suppose you see a wedge-shaped fifth wave with 4-1 overlap and three-wave subdivisions, but wave 3 is longer than wave 1, or one of the waves subdivides into a five. If your next alternative is even less compatible with the model, then label the wave a diagonal.”
Would love to hear your thoughts on the interview.
http://www.safehaven.com/article/44221/robert-prechter-talks-about-elliott-waves-and-his-new-book
Wow.
While I think he’s probably right, and the rules for ending diagonals may need to be rewritten (I’ve long wondered if the third wave may be the longest) I’m really wary of doing that.
And here’s why.
First, IME there’s almost always another way to label the wave so that all rules are met. So far I’ve not come across any instance, on a reasonable time frame (daily and higher) where all EW rules cannot be met in a market with enough volume to produce Elliott waves.
But more importantly this is my opposition to that suggestion, that the rules should be flexible.
There is quite simply a lot of absolute rubbish out there online purporting to be Elliott Wave. In fact, most of the charts published online calling itself Elliott wave break multiple rules all of the time. Telling those people that they can be flexible with the rules of Elliott wave because Robert Prechter said they could, gives them a green light to do whatever they like.
And they’re complete time wasters.
I had one guy contact me, he wanted to exchange links on our sites. His work was filled with W-X-Y-X-Z, all of it subdividing W-X-Y-X-Z. I pointed out the rule that breaks (increases maximum # of corrective structures beyond three) and he just argued with me. He is sure he’s right, and I’m wrong.
If he reads that interview, he’ll be further supported in his view of Elliott wave. And that’s concerning, because people will be investing real money based upon his work.
Thanks for the reply. I agree with you. Better to stay with a strict interpretation of the rules 😀
I could handle a rewriting of the rules if it’s based upon a decent analysis of a decently large set of data.
But the problem there is there will always be more than one possible Elliott wave count for any set of data. There is an element of subjectivity to Elliott wave.
Which means a rigorous study of the data concerning Elliott wave structures is virtually impossible.
Looking for a small move down in GDX at the open before a reversal and a continuation of the move up. My preferred count sees GDX staying above 23.28 which I show as the low for Minute wave 2. The top of the symmetrical triangle should offer strong support.
https://www.tradingview.com/x/UmQRiHeR/
I think we have at least one more flush to the downside before we start back up. I decided to hold onto my JDST hedge a bit longer.
That could have been 4th wave at .50 (1264.x) and now 3 targets for 5th wave of wave 3. Unless we see 1259 (third target for wave 4 @ .618) first.
Silver might be giving clues. Nearly positive, could be a big day.
Stopped out 🙁
Still, a nice profit there 🙂
Jumping right on back in long. Stop now for new long positions should be set just below the invalidation point at 1,261, which is the high for the 4th of April.
Profit target still 1,333.
If my analysis is correct then this is a good entry point.
Lara but ifts minutte 2 than it can move below 1261 right.?
Than the invalidation will be below 1240.
Yes. And if this is a second wave correction then I don’t want to hold onto a long for that long.
The banksters are seizing the occasion of the French election to hammer the PM price. Quite a few stops are going to be run no doubt. The EU is doomed. Bullish for PMs. Somebody understands this, and stepped in, apparenly in anticipation and bought Silver’s low with authority. I will be cashing in half my hedges and rolling profits to add to long positions. Let the banksters keep shorting. Some of us will continue to snap up undervalued miners.
gapped over my stops. ouch. well, that’s part of the work. I had a short from top of channel seeking lower at 1280 so I ‘m glad that close order gapped over too. longs are hurting though.
You must have wisely used a stop with a limit. Folk who had an open stop order only could end up getting filled considerably lower than their stop. This is what banksters do to weak long hands in a PM bull market.
I didn’t think gold was pricing in a doomsday scenario for the French election. Not fun watching these price reactions! Right now gold is off 3.3% in Euros.
I have a hunch gold will partially catch back up to the Euro move…having the Euro move higher against the USD should, in theory, provide a nice backdrop to the price of gold in dollars.
AND…lot’s of uncertainty still out there.
Does anybody really think that either Le Pen or Macron is good for the Euro?! I am massively shorting that ridiculous bankster head-fake. Just how stupid do these cretins think we are??!!
looking good for gold!
Yes, currencies are moving. Sometimes we get knee jerk reactions and reversals after these election spikes. We’ll have to see if gold gets any follow through when it opens.
JUST A VIEW: Pretty interesting how Gold price is behaving with a lack of clarity and appears to have tied itself up in a knot with a two sided trade thus far staying capped more or less under 1289 with the downside appears to be straddling the 10dma quite adequately and failing to break below April 11, 2017 high seen as holding; possible downside risk 1272-70 should a break below there occur …. Expecting a likely drop / pullback on Monday but hard to see Gold price get below 1277, I wonder… Playing this close to the hip, buying every dip lol…. Sister Silver appears to be looking to pullback on weekly outlook basis, hope it does not drag Gold price to far down with it~! / Thank goodness to the fabulous E/W analysis we have here from Lara, helps keep emotions in check 🙂 Good luck all.
The banksters have a huge problem. They would like to hammer Gold even harder than they have recently but they know that if they do, big players are going to force them to make delivery of the metal at the lower prices…metals that they do not have. They have a bit more leeway with Silver. People forget that JPM is the custodian for the SLV ETF and the can see everyone’s books. They have been accumulating the physical metal ( they have about 100 million ounces) and feel they can issue more paper contracts to keep the price suppressed. This is why Silver has been weaker. The open interest last December was 160K contracts. Now it is around 230K, some fifty percent higher! Is that much more Silver available? Nope! It was just created out of thin air and in fact the amount that would be deliverable from the COMEX long contracts already far outstrip annual production. But of course you folk all know these numbers so I am preaching to the choir. The conventional wisdom says that with this level of open interest price HAS to go lower. Maybe.
It is also in my view equally possible that the divergence in price we are now seeing with Silver vs Gold could signal a short squeeze on the horizon. The naked shorts may be forced to cover. I will be watching JPM very closely as they have more physical Silver than all the other banks combined. They are not going to loose over 150 million for every dollar Silver rises for very long and when they throw in the towel, it’s Katie bar the door for the rest of the so called “smart cohort”. We could be witnessing a real paradigm shift people.
Taking another look at the paper contracts traded this past week continues to be most enlightening. On Wenesday, 19, just before the London fix, three billion dollars of notional Gold, that is billion with a “B” folk, was dumped into the market. The dump was bought! See the lower wick? Somebody is getting nervous…!
I must say your end of week video is really excellent Lara. Very clear and instructive – I have learnt a lot! Hope you are having a lovely weekend.
I agree Lara. The detail on correlations was very useful. Excellent detailed video!
Thanks guys!
Amusing and interesting observation Verne. I do enjoy your contributions.
I am also inclined to favour the alternate count as I think minute 4 looks too long now vs minute 2 and I would not be surprised if a weekend upset – viz the French elections- were to be the catalyst for a spike up.
BBs on the miners are extremely compressed, so a big move is afoot. I think one reason the short term gyrations of the metals can be so confusing is because of the futures traders. People often forget that unlike the 2X leverage permitted in stocks, these guys can leverage a whopping 30X! I have maintained a small hedge of my long positions with JDST but it seems to me the short sellers are giving traders not yet positioned quite an opportunity to join the developing trend. I’m berry bullish! 🙂
What time frame are you looking at for the BB compression on miners? Also, 20,2 settings? Thanks!
All daily charts…and yep…
BTW, I read an astute analyst this week-end that whispered the potentially seismic query: “What if the FED LOWERS, instead of raising???!!” Ai! Yi! Yi!
Despite the egg on their faces, it would be the right call…and I don’t have to tell you what Gold and Silver would do… 😀
Fed lowering rates will not help yellow metal as we are at that point staring into deflation. Deflation is not a friend of gold.
True in the intermediate term. Not necessarily so in the immediate.
The performance of the yellow metal has been nothing short of remarkable. Despite all the angst of some members about the lagging miners, you have to take into consideration what has been going on behind the scenes to grasp the magnitude of what is going on here. The attempt to beat down the Gold price with naked shorts the last several weeks has been relentless, yet the big G keeps giving ’em the proverbial finger.
What we are looking at here is potential nuclear detonation of multi-mega-tonnage. All those naked shorts are eventually going to have to be covered. I like the looks of that alternate count as it paints quite a vivid picture of what may be ahead. We have seen this movie before as Lara pointed out with that third wave study. It is really quite ironic. The word on the street is that even hedge fund algos are now programmed to automatically buy specific standard deviation declines in the major indices due to years of central bank BTFD conditioning. I always wondered why we have rarely seen triple digits declines in the indices that stuck, although we have seen quite a few to the upside. It now makes perfect sense.
BTFD swarming bots and bankster pumping notwithstanding, we are starting to put in lower highs and lows in the indices; relentless naked shorting notwithstanding the precious metals refuse to cry “Uncle!” Something’s gotta give!
Have a great weekend everybody!