
A pullback has continued lower to test support at prior resistance, which is typical price behaviour.
Volume will be used to indicate what is most likely to happen next.
Summary: A decline in volume today and price at support suggests an upwards day tomorrow. Long positions may have stops set either back within the consolidation zone, so just below 1,261, or using the Elliott Wave invalidation point at 1,240.24 to give the market more room to move. The target for now is 1,392, but a closer target may be calculated when the pullback is confirmed as over.
Always use a stop. Do not invest more than 1-5% of equity on any one trade. Risk management is the most important aspect of trading.
New updates to this analysis are in bold.
Grand SuperCycle analysis is here.
Last monthly and weekly charts are here.
MAIN ELLIOTT WAVE COUNT
DAILY CHART – DETAIL
Click chart to enlarge.
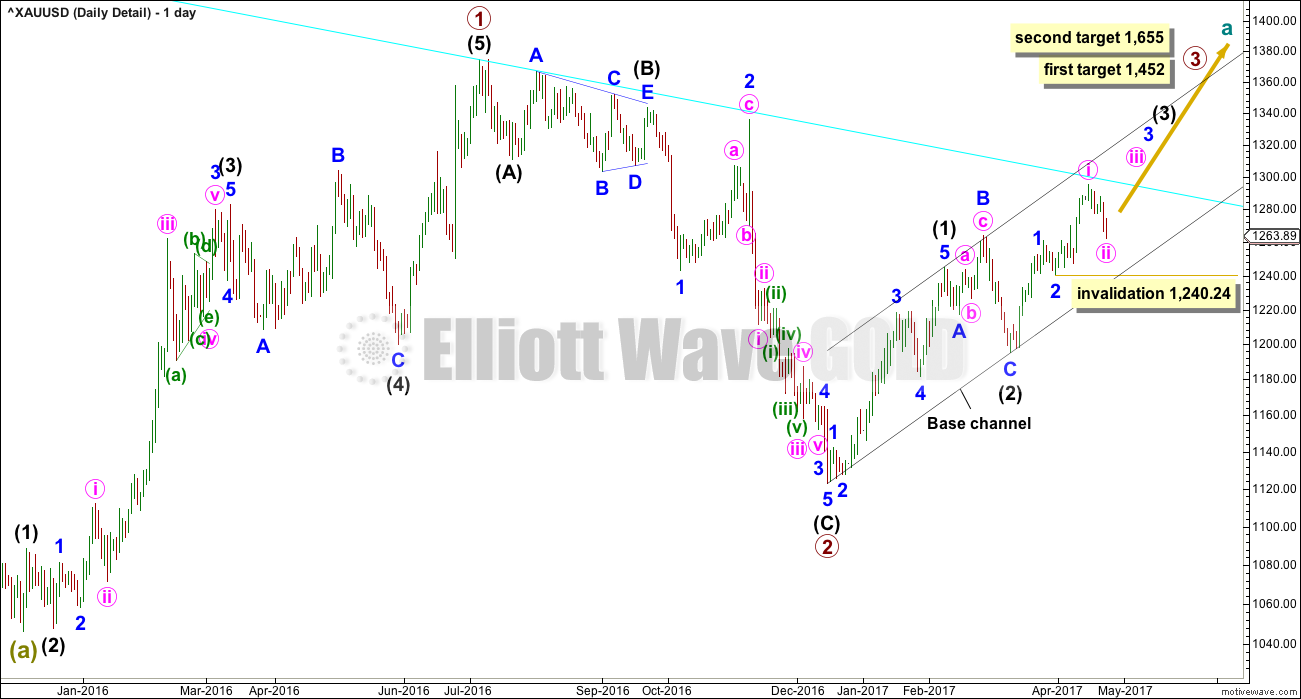
This chart steps back to see all movement since the important low on the 3rd of December, 2015.
To see how this fits into the bigger picture, please see the last historic analysis linked to at the start of this analysis.
The first upwards movement labelled primary wave 1 fits well as a five wave impulse. Primary wave 2 fits as a zigzag. It would be difficult to see the downwards wave of primary wave 2 as an impulse because that would require ignoring what looks very much like a triangle at its start (labelled intermediate wave (B) ). To see this as an impulse that movement would need to be a second wave correction, but second waves do not subdivide as triangles.
Primary wave 3 should have begun. Within it intermediate waves (1) and (2) should be complete. Intermediate wave (2) is a very common expanded flat correction.
The middle of this big third wave now looks unlikely to have passed, so it is still ahead. This has a better look on this bigger picture view.
Minute wave ii may not move beyond the start of minute wave i below 1,240.24.
DAILY CHART
Click chart to enlarge.
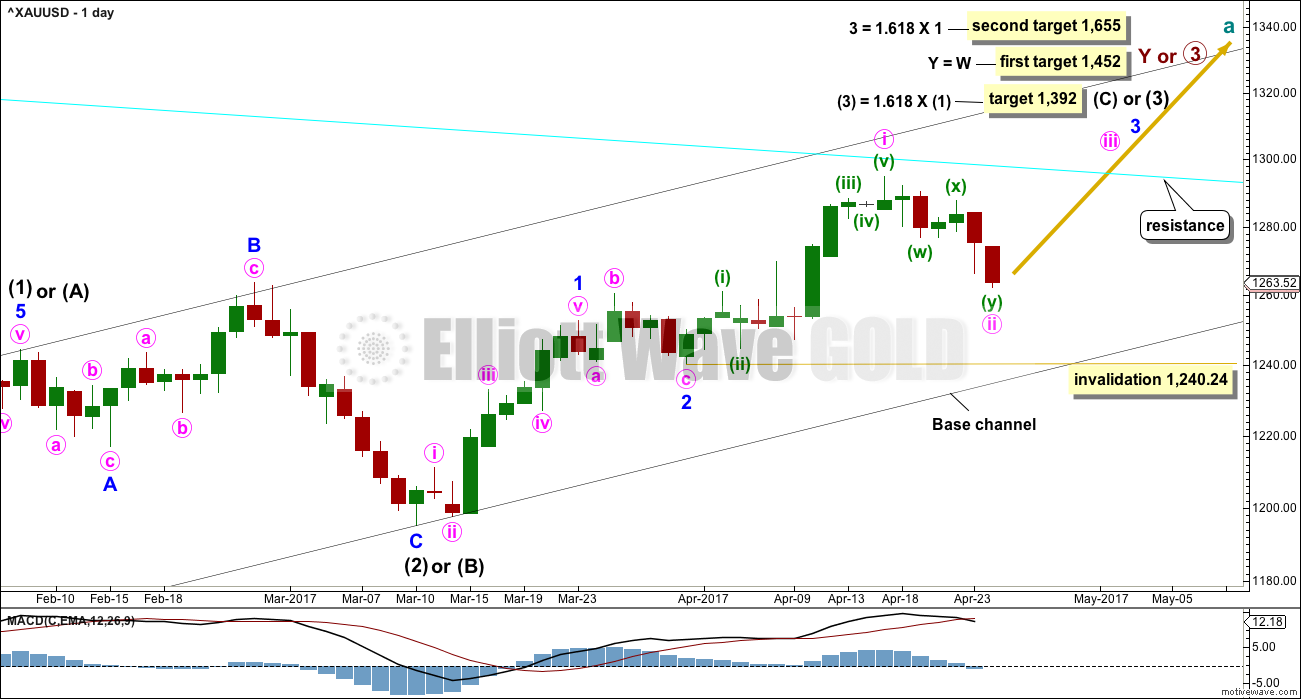
This daily chart will suffice for both weekly charts, which can be seen in the last published historic analysis.
Upwards movement at primary degree is either a third wave (first weekly chart) to unfold as an impulse, or a Y wave (second weekly chart) to unfold as a zigzag. If upwards movement is a zigzag for primary wave Y, then it would be labelled intermediate waves (A) – (B) and now (C) to unfold. It is most likely a third wave because cycle wave a is most likely to subdivide as an impulse.
Intermediate wave (1) or (A) is a complete five wave impulse lasting 39 days. Intermediate wave (2) or (B) looks like an expanded flat, which is a very common structure.
So far, within intermediate wave (3) or (C), minor waves 1 and 2 are now complete. Minor wave 3 looks to have begun. Within minor wave 3, only minute wave i may now be complete and minute wave ii may be over here, or it may move a little lower but not beyond the start of minute wave i below 1,240.24.
Minute wave iii should show an increase in upwards momentum and be supported by volume. Thereafter, minute wave iv should be shallow and may be very brief. When minute wave iv is complete, then minute wave v should show a further increase in momentum and may end with a blow off top.
A cyan trend line is added to all charts. Draw it from the high in October 2012 to the high in July 2016. This line has been tested five times. Price is finding resistance at the cyan trend line now. If price can break through resistance here after some consolidation, then that may release energy to the upside for the end of minor wave 3.
HOURLY CHART
Click chart to enlarge.
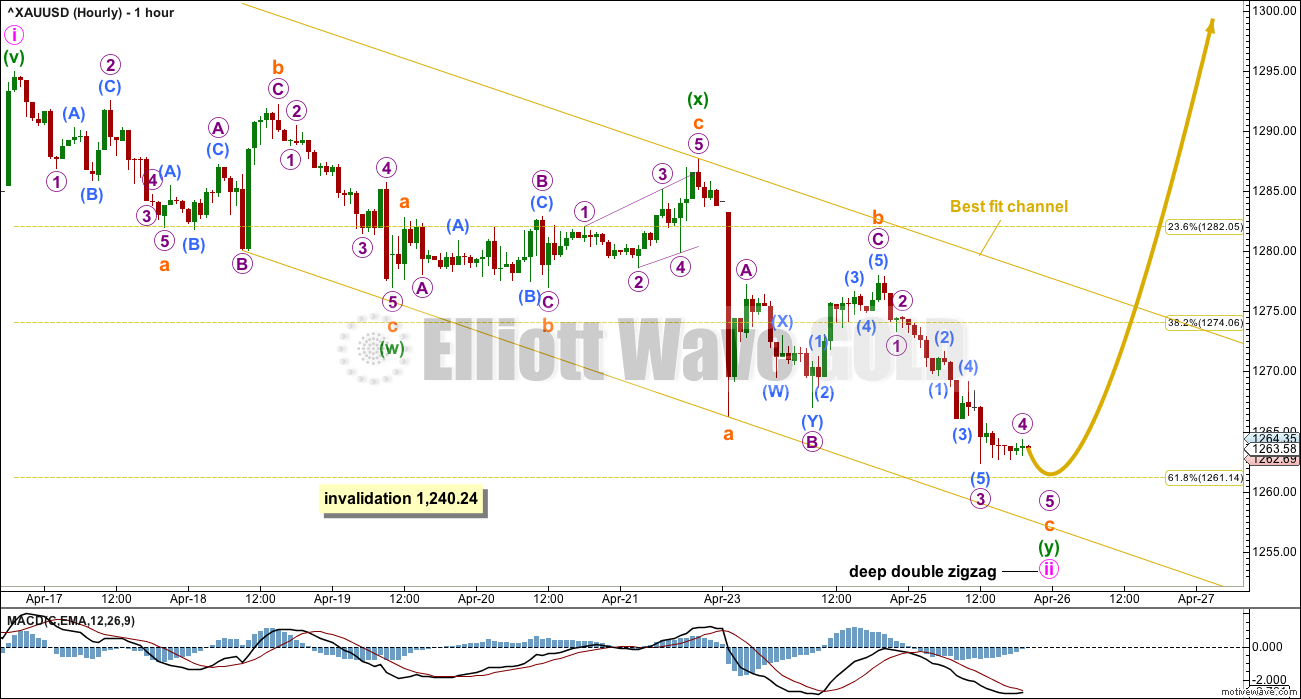
The depth and structure of this pullback looks like a second wave correction.
Minute wave ii still fits as a double zigzag. It will not fit as a single zigzag because there is too much overlapping. Within the second zigzag labelled minuette wave (y), the structure of subminuette wave c may still need a final fifth wave down for micro wave 5 to complete it. This may bring price closer to the 0.618 Fibonacci ratio of minute wave i, which is at 1,261.14.
At 1,256.57 subminuette wave c would reach equality in length with subminuette wave a. If price moves below the 0.618 Fibonacci ratio, then this would be a reasonable target.
When minute wave ii is over, then upwards movement should breach the upper edge of this best fit channel. That would provide confidence that a low is in place. At that stage, a target may be calculated for minute wave iii.
TECHNICAL ANALYSIS
WEEKLY CHART
Click chart to enlarge. Chart courtesy of StockCharts.com.
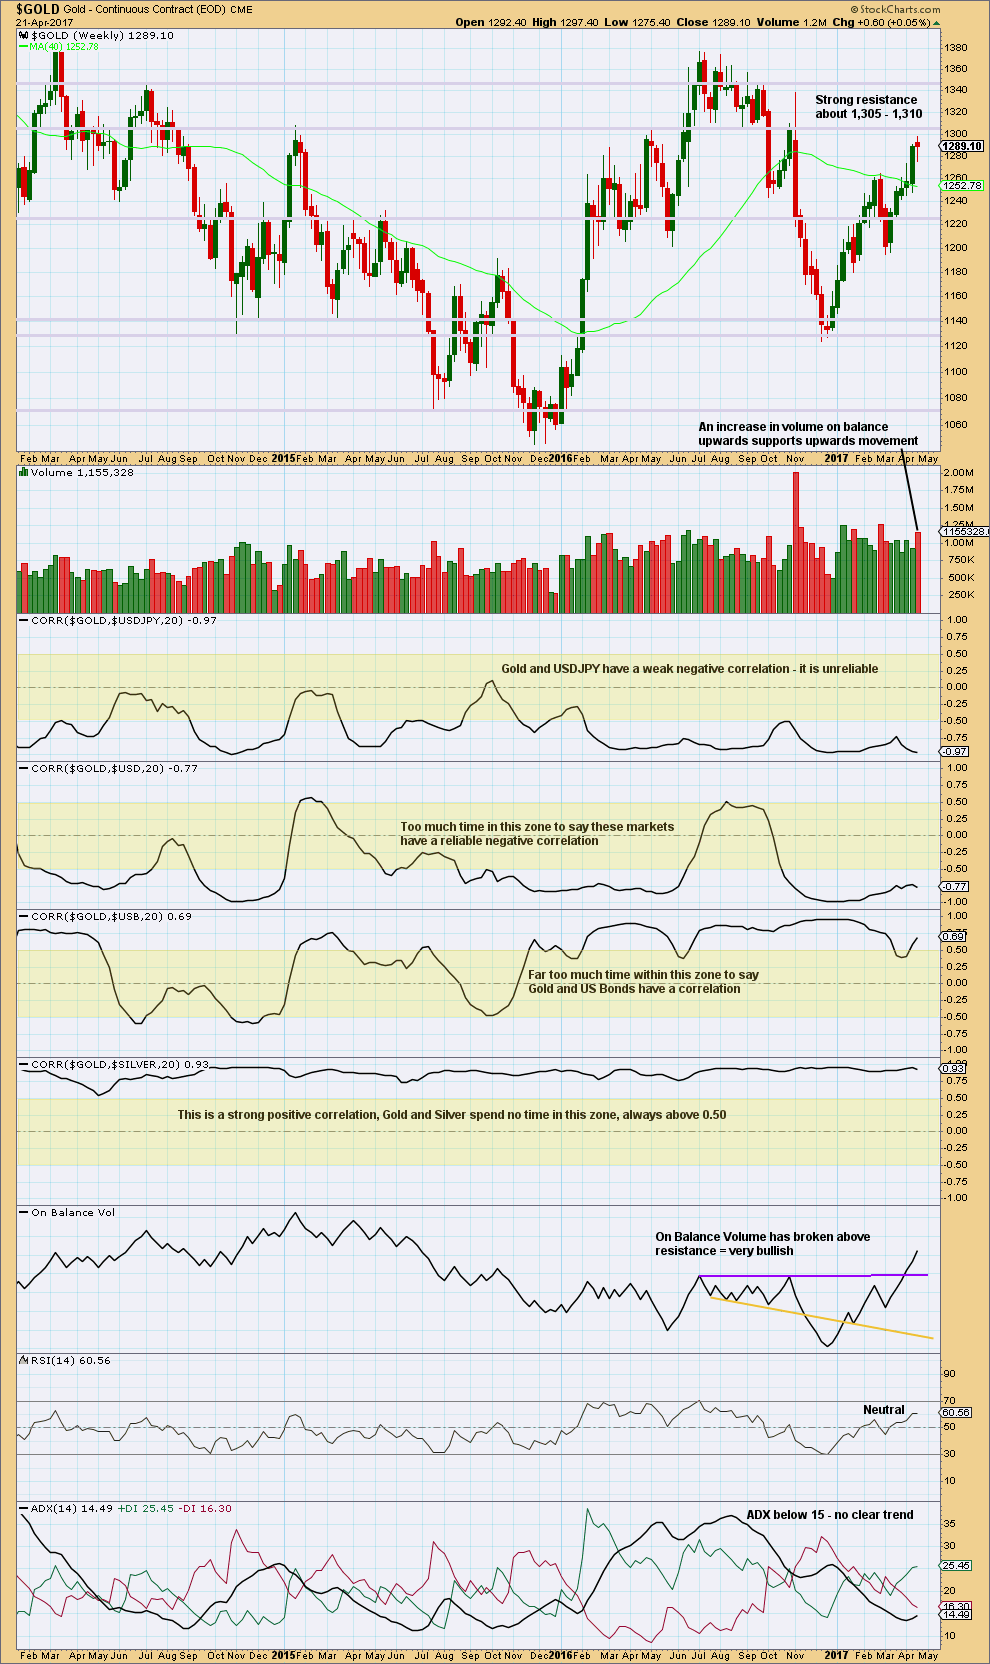
There are a lot of assumptions out there about Gold and its relationships to various other markets. Happily, there is a quick and easy mathematical method to determine if Gold is indeed related to any other market: StockCharts have a “correlation” option in their indicators that shows the correlation coefficient between any selected market and the one charted.
The correlation coefficient ranges from -1 to 1. A correlation coefficient of 1 is a perfect positive correlation whereas a correlation coefficient of -1 is a perfect negative correlation.
A correlation coefficient of 0.5 to 1 is a strong positive correlation. A correlation coefficient of -0.5 to -1 is a strong negative correlation.
Any two markets which have a correlation coefficient that fluctuates about zero or spends time in the 0.5 to -0.5 range (shown by highlighted areas on the chart) may not be said to have a correlation. Markets which sometimes have a positive or negative correlation, but sometimes do not, may not be assumed to continue a relationship when it does arise. The relationship is not reliable.
For illustrative purposes I have included the correlation coefficient between Gold and Silver, which is what strong and reliable correlation should look like.
Gold made a higher high and a higher low this week, although the candlestick has closed red. An increase in volume is bullish. The long lower wick on the candlestick is also bullish although the colour is bearish.
ADX does not yet indicate a trend. If it reaches 15 or above, then it would indicate an upwards trend. RSI indicates there is still plenty of room for price to rise. This chart is bullish.
DAILY CHART
Click chart to enlarge. Chart courtesy of StockCharts.com.
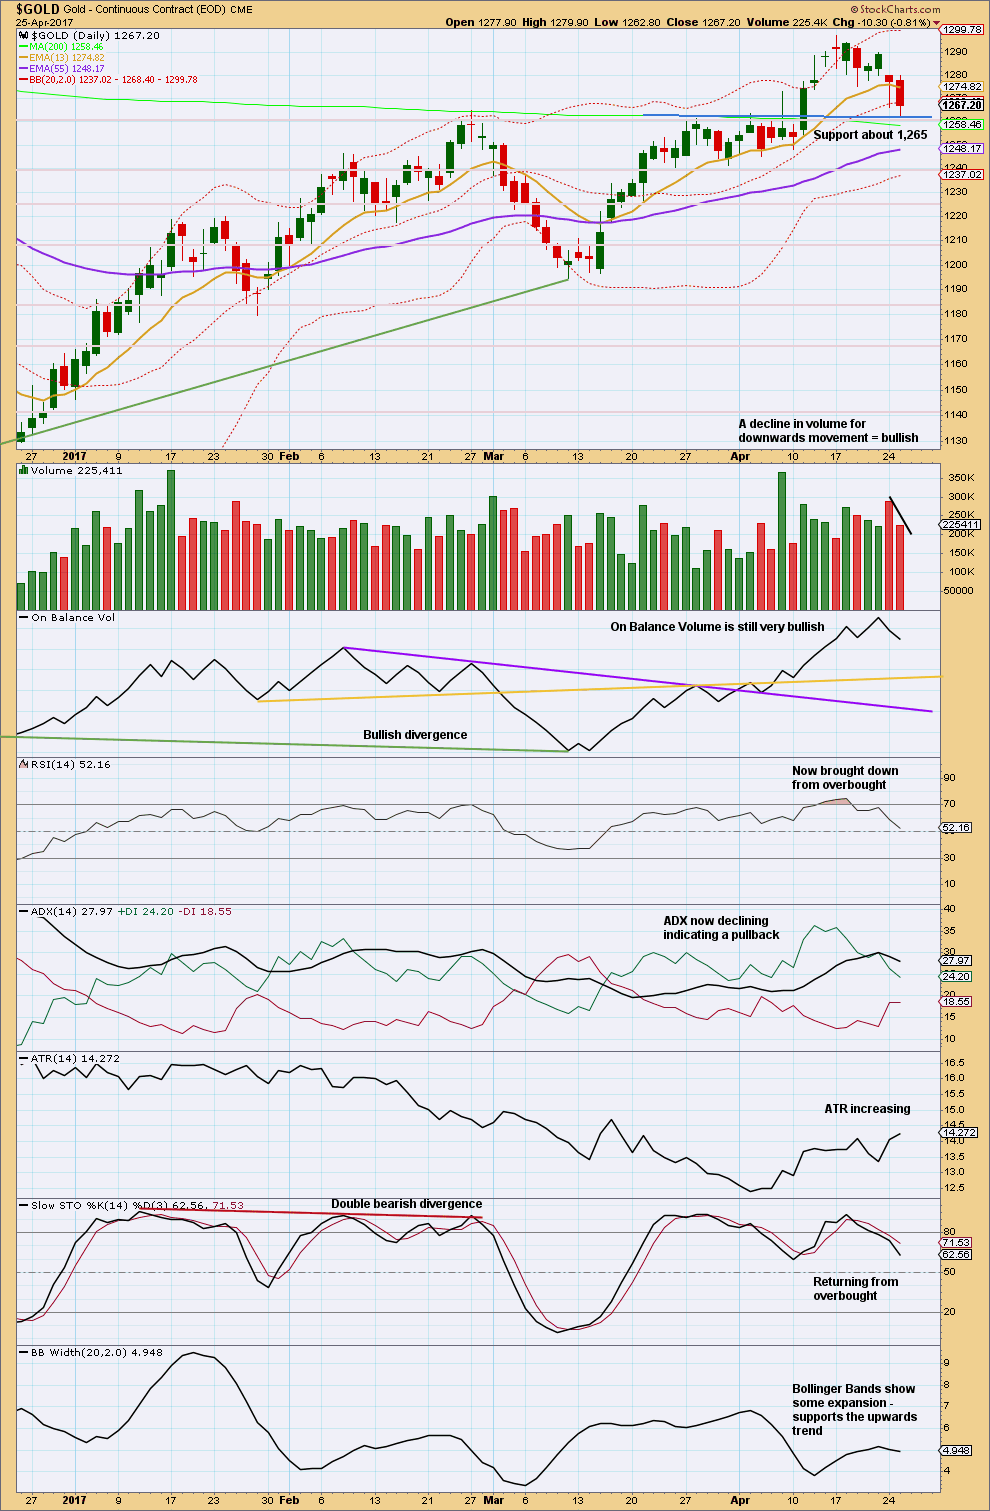
Some decline in volume for a second downwards day indicates a lack of support for downwards movement from volume. This may indicate an end to the pullback here.
The prior consolidation zone had resistance about 1,265. The upwards day of the 11th of April was a classic upwards breakout supported by volume. Now price has curved around and down to test support at prior resistance, which is typical price behaviour. It looks most likely that the pullback is now over and price should move up and away.
This tendency does not always hold: there was a recent example on GDX on the 19th of April where it did not and price fell back into a prior consolidation zone. But it does hold more often than it fails, so on balance of probability this looks like a reasonable point to enter long for Gold. Stops may be set back within the consolidation zone. If price reenters the zone, then something else may be happening and long positions should be closed.
Overall, this chart remains more bullish than neutral.
GDX
DAILY CHART
Click chart to enlarge. Chart courtesy of StockCharts.com.
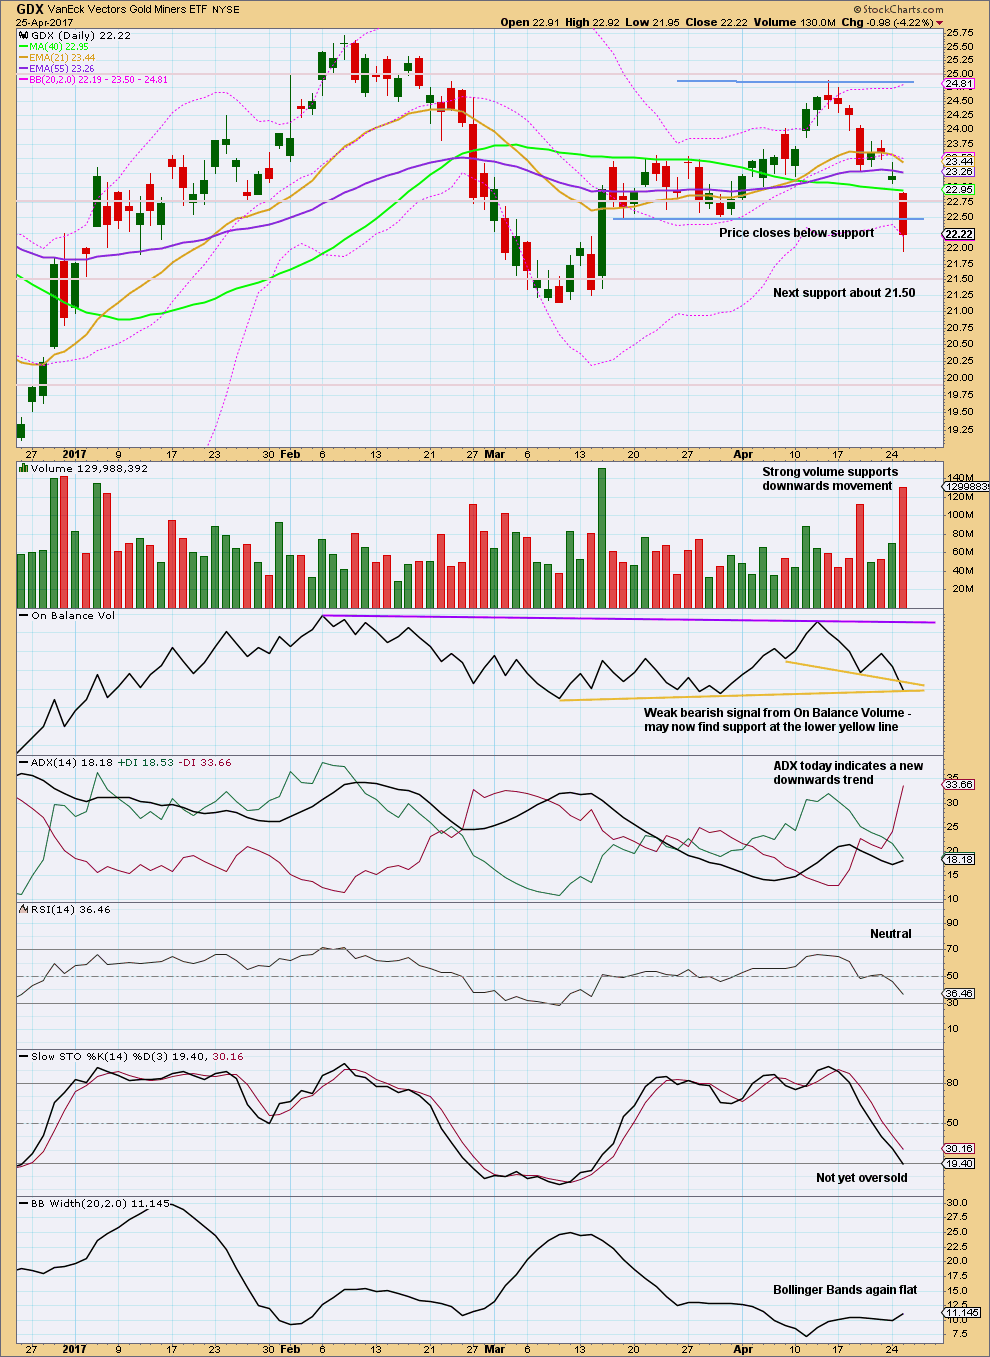
Yesterday, the slight increase in volume for a downwards day suggested price may fall a little further and it has. However, support was expected about 22.50. Today closes below support on a strong downwards day that has strong support from volume.
A downwards trend is now indicated for GDX. This has support from increasing volume and range.
However, On Balance Volume may provide support here and halt the fall in price.
Overall, this chart has switched to mostly bearish. If tomorrow completes another downwards day and On Balance Volume breaks below support, then the picture for GDX would be full bore bearish.
STUDY OF A THIRD WAVE IN $GOLD
Click chart to enlarge.
This study of a third wave will be left in daily analysis until the current third wave is either proven to be wrong (invalidated) or it is complete.
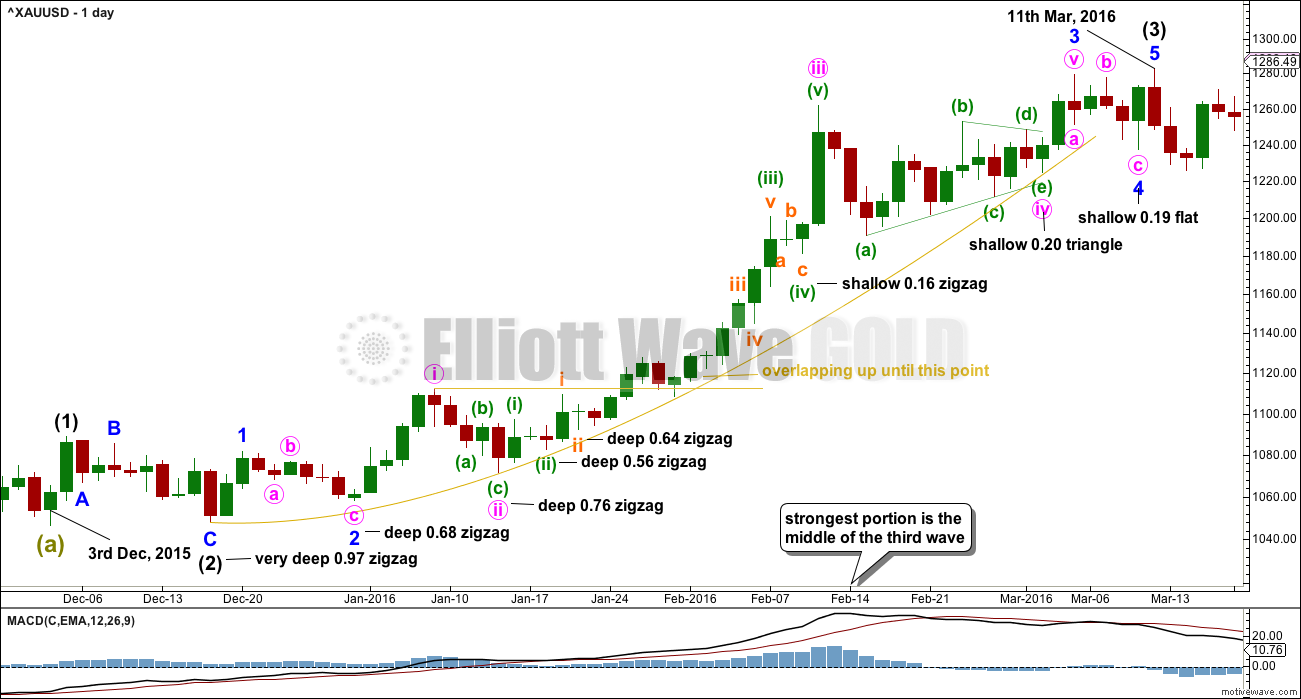
This third wave spans 59 trading days.
It was not until the 40th day that the overlapping ended and the third wave took off strongly.
The middle of the third wave is the end of minute wave iii, which ended in a blow off top.
There is excellent alternation between second and fourth wave corrections.
This third wave began with a series of five overlapping first and second waves (if the hourly chart were to be added, it would be seven) before momentum really builds and the overlapping ends.
The fifth wave of minuette wave (v) is the strongest portion.
This third wave curves upwards. This is typical of Gold’s strong impulses. They begin slowly, accelerate towards the middle, and explode at the end. They do not fit neatly into channels. In this instance, the gold coloured curve was used.
Click chart to enlarge. Chart courtesy of StockCharts.com.
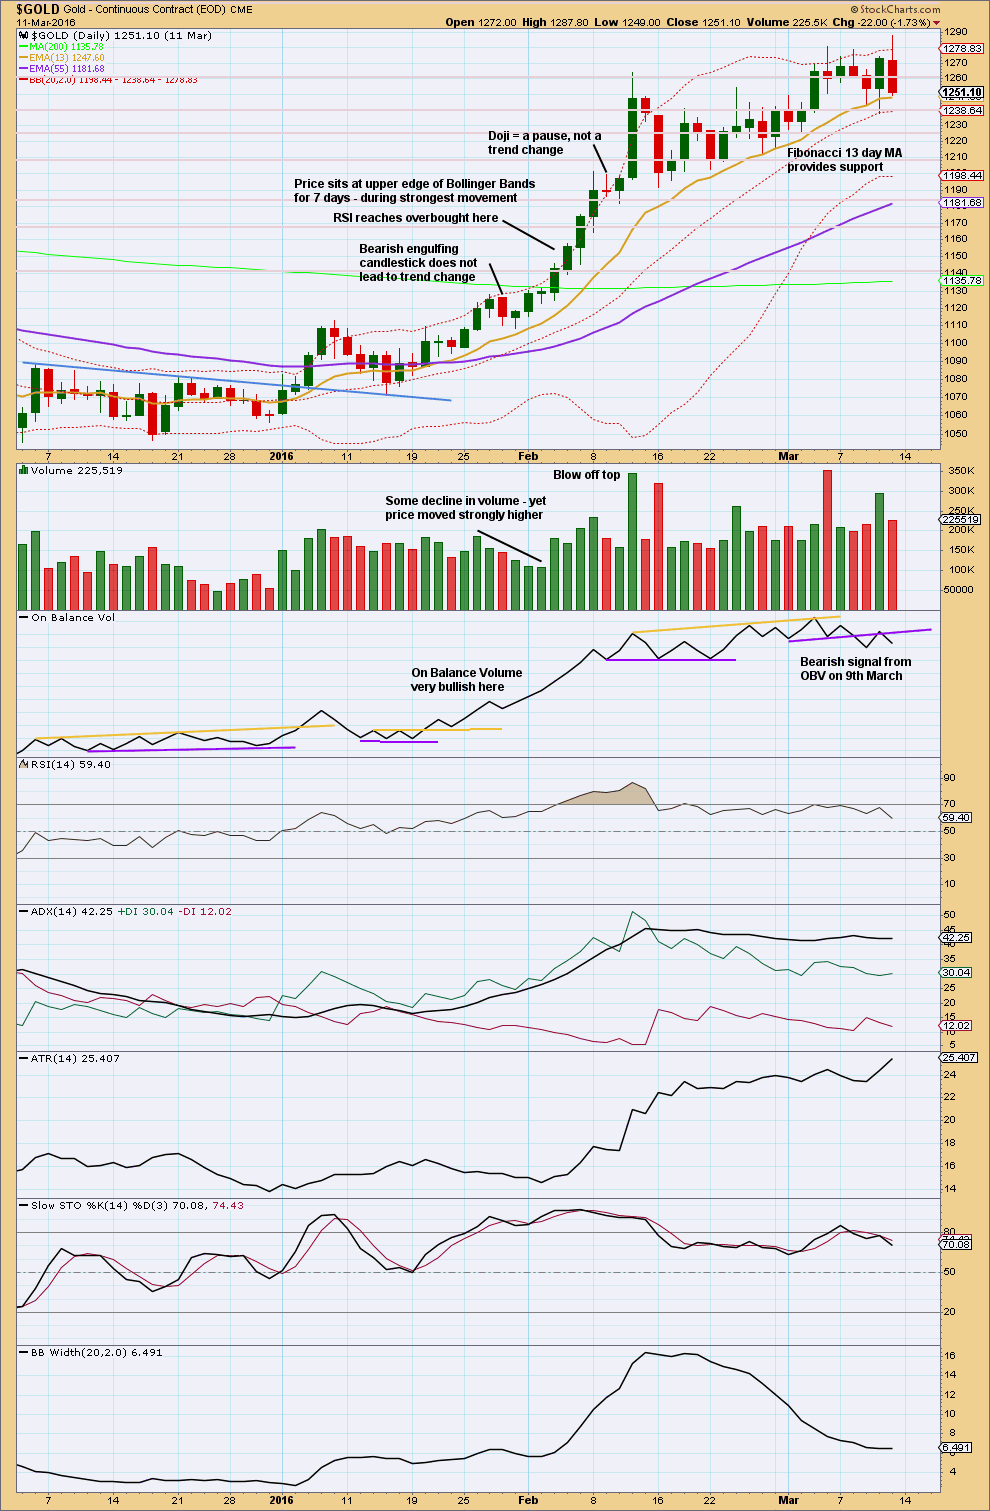
This trend began after a long consolidation period of which the upper edge is bound by the blue trend line. After the breakout above the blue trend line, price curved back down to test support at the line before moving up and away.
RSI reaches overbought while price continues higher for another five days and RSI reaches above 85. The point in time where RSI reaches overbought is prior to the strongest upwards movement.
ADX reached above 35 on the 9th of February, but price continued higher for another two days.
The lesson to be learned here: look for RSI to be extreme and ADX to be extreme at the same time, then look for a blow off top. Only then expect that the middle of a big third wave is most likely over.
The end of this big third wave only came after the blow off top was followed by shallow consolidation, and more highs. At its end RSI exhibited strong divergence with price and On Balance Volume gave a bearish signal.
Third waves require patience at their start and patience at their ends.
This analysis is published @ 09:05 p.m. EST.
Updated hourly chart:
We need price to break above this channel for confidence that we have a low in place.
Since I have begun tracking the trading advice I have given on this website on balance profit has been greater than loss. If members follow this advice their accounts should see increasing equity, not decreasing.
It’s really hard to see people quit when I’m giving on the whole profitable advice.
Including today still a very profitable position on US Oil.
I just don’t know what more I could do.
I will also wish you well John.
Gold is up nearly $80 from your spot on 2 wave low of 1190 in only 30 trading days. I’ve been trading since 2004 when gold started its bull run. There is simply zero way to extrapolate one market (gold) into the action of the miners. I’m afraid we all suffer from confirmation bias here and there. The miners have political risk, exploration risk, oil / fuel risk, labor risk, etc. Look at ABX yesterday! I’ve found your EW analysis to be extremely helpful for gold – the commodity. The only thing that ever gets me in trouble is my own appetite for extreme leverage (which I’m used to via trading futures since ’04). Even Verne needs to be careful with how he applies your EW to his options trading. Time-frames, position size, exit plan, all need to be considered. I’m totally thrilled that your EW has given me another tool for my swing trading program which is typically 1-12 weeks. Thanks for all you do!
Cheers Corey.
You’re right about the extrapolation of $GOLD analysis to any other market, including GDX.
It does concern me that here I am analysing $GOLD and members are expecting that to be useful in them trading another market like GDX.
Of course if that’s how my analysis is being used it’s not going to be particularly useful.
Just in case anyone’s wondering, I analyse the Gold cash market because it has huge volume, I don’t use EW analysis on individual equities because their volume is not sufficient for EW.
I do have a certain amount of sympathy for John. Before I found Lara’s site I saw some atrocious EW analysis from some folk that were supposed to know what they were doing. I got so frustrated I actually started to do the exact opposite of what these clowns told me I should based on their supposed wave count, and folk, I am serious. That experience taught me the discipline of tight stops, proper position sizes, and taking responsibility for my trades.
I am at a complete loss to understand how anyone who has followed Lara’s careful, meticulous and thorough analysis for even a short time can walk away with such disappointment. I suspect a case of problematic position sizing.
Here is the God’s honest truth folk, you should expect to loose on many of your trades and to do so often if you trade a lot. Some of the very best traders I know, including the legendary Steve Nison, not infrequently have more losses on trades than winners. Nison was still the best trader in his section when he worked for a Wall Street bank.
There should always be a number that tells you that you are wrong about a trade (stop loss), you should limit your exposure on any one trade (position size), and you should have a defined profit target on every trade you enter.
In my humble opinon, applying those rules with Lara’s analysis guarantees your trading account will grow, and that you will stay out of serious trouble and heart-ache. Don’t mean to preach but I am always sad to see comments like John’s as I have a good idea of what happend.
Here is where you typically see the cat and mouse game from you-know-who. I expect a contract dump just about here that should get bought issuing in a nice bullish engulfing candle…if not today perhaps soon…
Underway….
Gold bouncing right at 200 dsma. Silver hammering out a low beneath lower BB.
That 16.40 print for SLV should hold. Futures rebounded at around 17.36
Long GDX. No leverage in case this is not the low…can add. Long /GC as well with tight stop at 1264
Wow, that’s too bad of the loss. It is critical, as Lara states, to manage trade % to mitigate loss. EW is not a signal but a study and a great tool to add to your trading. I’d loss without it and learn so much from it that helps confirm my technical analysis. Best of luck!
All the best John.
So far Gold electing not follow Silver into the weeds. It is interesting that GLD had a few gap down days recently but remains staunchly above its 200 dsma. A great bullish sign would be a gap below followed by an immediate recovery above….
Either Gold will join Silver in a violation of the 200 day SMA , or it will not. If it does, that would be very bearish near term. A close of Silver back within the lower BB without a 200 day SMA violation by Gold could signal an impending reversal.
I think we need to watch for a day gold is down and the miners are up to signal the low is in. Plus need USD/JPY to roll back over along with rates to roll back over and get the 10 year going down from 2.34% towards 2.00% and then wave 3 may start.
Lara.
Could it be that the point you labelled submicro 5 of micro 3 at 1262.32 be instead submicro 3. Then, the low today at 1261.62 becomes micro 3. The high reached at 1265.25 is micro 4, and there is one more wave down to complete micro 5 and hence Minute 2. I think this wave count gives a more proportionate look for subminuette c.
Target:
(a) 1258.57, minuette y = 1.618 * minuette w;
(b) 1256.57, subminuette c = subminuette a, your secondary target;
(c) 1257.22, micro 5 = 0.618 * micro 3.
If the scenario described above fails to materialise, I’ll settle for the end of Minute 2 at 1261.62.
It looks like events have overtaken this idea Alan. But I’m in agreement that there does look like a problem of proportion now between micro 2 and 4.
The strong selloff in the miners does not seem to be in alignment with the imminently bullish gold count. Invalidation points for the bull counts were hit in GDX and GDXJ.
A deep move back within the triangle is bearish and I think there is a good chance now that GDX goes lower, with bounces along the way. My target for this idea is 20.31, with a minimum target of 21.14 to avoid a truncation.
https://www.tradingview.com/x/KzhhTLqr/
Or this?
As you know Dreamer I’m very wary of using EW analysis on GDX. It just doesn’t always have nice looking Elliott waves, it doesn’t have sufficient volume.
It’s threes can look like fives and vice versa. Quite off putting.
Anyway, here’s another idea. This one bullish. It does seem to be stretching it though to see the wave I’ve labelled intermediate (1) as a five. So this is an alternate, “what if?” count.
Thank you Lara. Always appreciate your GDX charts!
If price stays above 21.14, then this will be the count. Time will tell.
A simple look at GDXJ is alarming for the bulls. Although the trend line has not been repeatedly tested, it would appear to be very bearish if price cannot get back above the line ASAP.
https://www.tradingview.com/x/RbjnGmva/
Blame it on ABX? The worlds largest miner fell short of earnings estimates, lowered their forecast and the stock got slammed, losing over 11% on very high volume
Big range down days are more often than not followed by more down although there may be a brief relief rally first.
https://www.tradingview.com/x/uD3ltKFV/