
An inside day fits both Elliott wave counts. Classic technical analysis will be used to determine which one may be more likely.
Summary: Watch the best fit channel on the hourly chart carefully. If price breaks above the upper edge, then a low is very likely in for Gold. If that happens, long positions should be entered with stops just below 1,260 and a target about 1,349 in the first instance.
If Gold makes a new low, then it may not be by very much. If this happens, then use it as an opportunity to get a good entry point to the upwards trend.
The larger trend remains upwards. Recent downwards movement looks very strongly like a pullback.
As always, use stops and do not invest more than 1-5% of equity on any one trade.
New updates to this analysis are in bold.
Grand SuperCycle analysis is here.
Last monthly and weekly charts are here.
MAIN ELLIOTT WAVE COUNT
DAILY CHART – DETAIL
Click chart to enlarge.
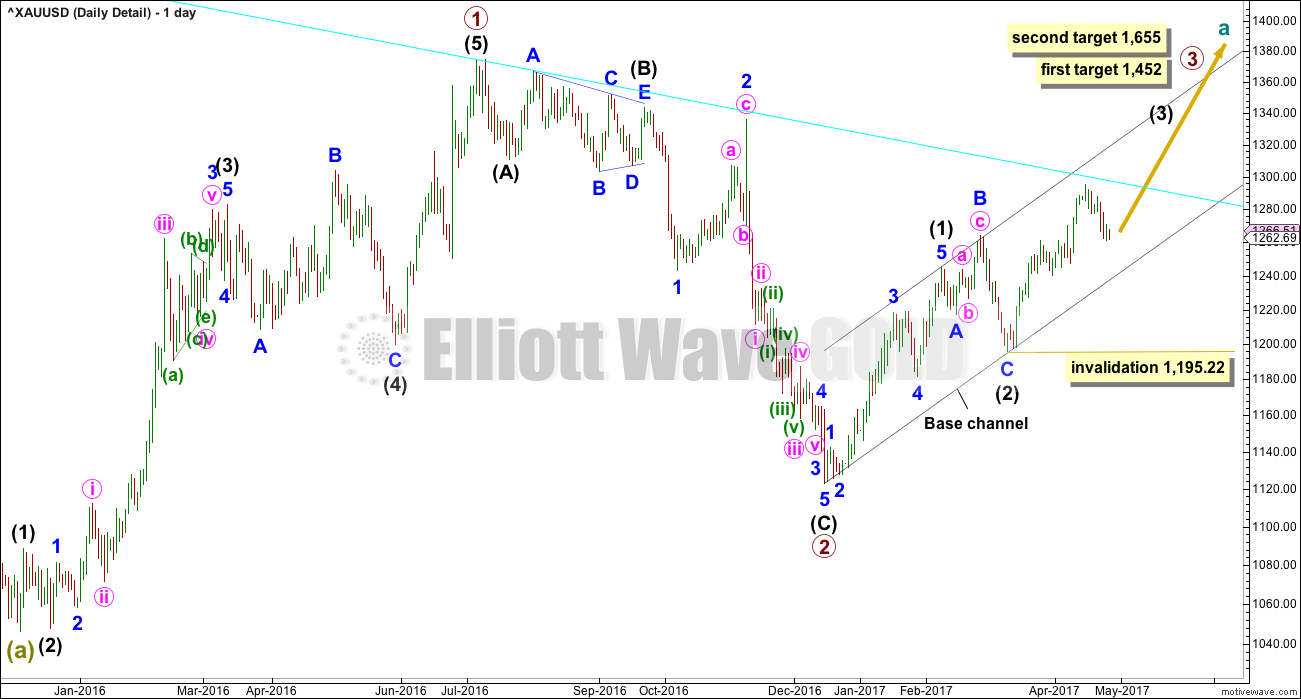
This chart steps back to see all movement since the important low on the 3rd of December, 2015.
To see how this fits into the bigger picture, please see the last historic analysis linked to at the start of this analysis.
The first upwards movement labelled primary wave 1 fits well as a five wave impulse. Primary wave 2 fits as a zigzag. It would be difficult to see the downwards wave of primary wave 2 as an impulse because that would require ignoring what looks very much like a triangle at its start (labelled intermediate wave (B) ). To see this as an impulse that movement would need to be a second wave correction, but second waves do not subdivide as triangles.
Primary wave 3 should have begun. Within it intermediate waves (1) and (2) should be complete. Intermediate wave (2) is a very common expanded flat correction.
The middle of this big third wave now looks unlikely to have passed, so it is still ahead. This has a better look on this bigger picture view.
Minute wave ii may not move beyond the start of minute wave i below 1,240.24.
DAILY CHART
Click chart to enlarge.
This daily chart will suffice for both weekly charts, which can be seen in the last published historic analysis.
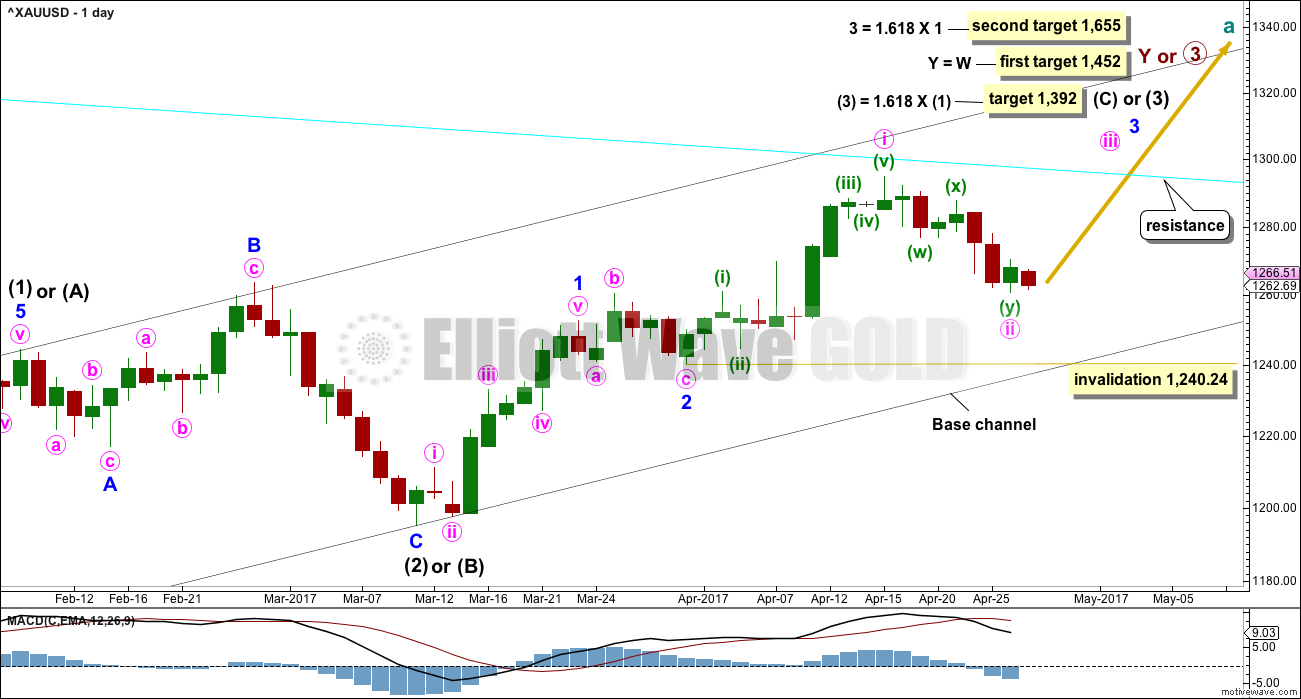
Upwards movement at primary degree is either a third wave (first weekly chart) to unfold as an impulse, or a Y wave (second weekly chart) to unfold as a zigzag. If upwards movement is a zigzag for primary wave Y, then it would be labelled intermediate waves (A) – (B) and now (C) to unfold. It is most likely a third wave because cycle wave a is most likely to subdivide as an impulse.
Intermediate wave (1) or (A) is a complete five wave impulse lasting 39 days. Intermediate wave (2) or (B) looks like an expanded flat, which is a very common structure.
So far, within intermediate wave (3) or (C), minor waves 1 and 2 may now be complete. Minor wave 3 may have begun. Within minor wave 3, only minute wave i may now be complete and minute wave ii may be over here, or it may move a little lower but not beyond the start of minute wave i below 1,240.24.
Minor wave 2 lasted six days. Minute wave ii has now lasted seven days at this stage for this wave count. There is now a slight disproportion between these wave counts. If price makes a new low below 1,260.86, then minute wave ii would become more disproportionate to minor wave 2. If that happens, the probability of this wave count would reduce to an alternate and the alternate below would become the main wave count.
Minute wave iii should show an increase in upwards momentum and be supported by volume. Thereafter, minute wave iv should be shallow and may be very brief. When minute wave iv is complete, then minute wave v should show a further increase in momentum and may end with a blow off top.
A cyan trend line is added to all charts. Draw it from the high in October 2012 to the high in July 2016. This line has been tested five times. Price is finding resistance at the cyan trend line now. If price can break through resistance here after some consolidation, then that may release energy to the upside for the end of minor wave 3.
HOURLY CHART
Click chart to enlarge.
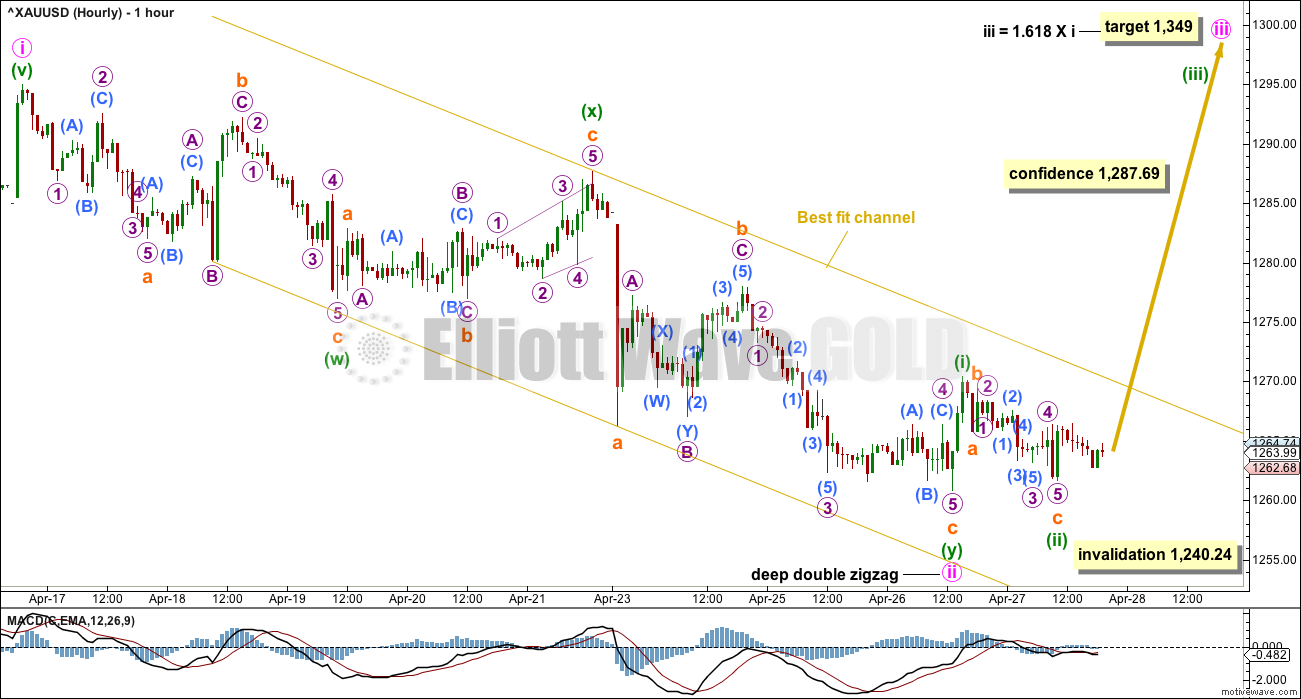
The depth and structure of this pullback looks like a second wave correction. The only question between the two wave counts, main and alternate, is of what degree is this second wave correction.
Minute wave ii still fits as a double zigzag. It will not fit as a single zigzag because there is too much overlapping. Within the second zigzag labelled minuette wave (y), the structure of subminuette wave c may now have its final fifth wave complete. However, the bottom line is that there cannot be any confidence a low is in place while price remains within the channel.
If minute wave iii has begun, then a target is now calculated for it to end. Confidence in this target may only be had with a breach of the channel.
ALTERNATE DAILY CHART
Click chart to enlarge.
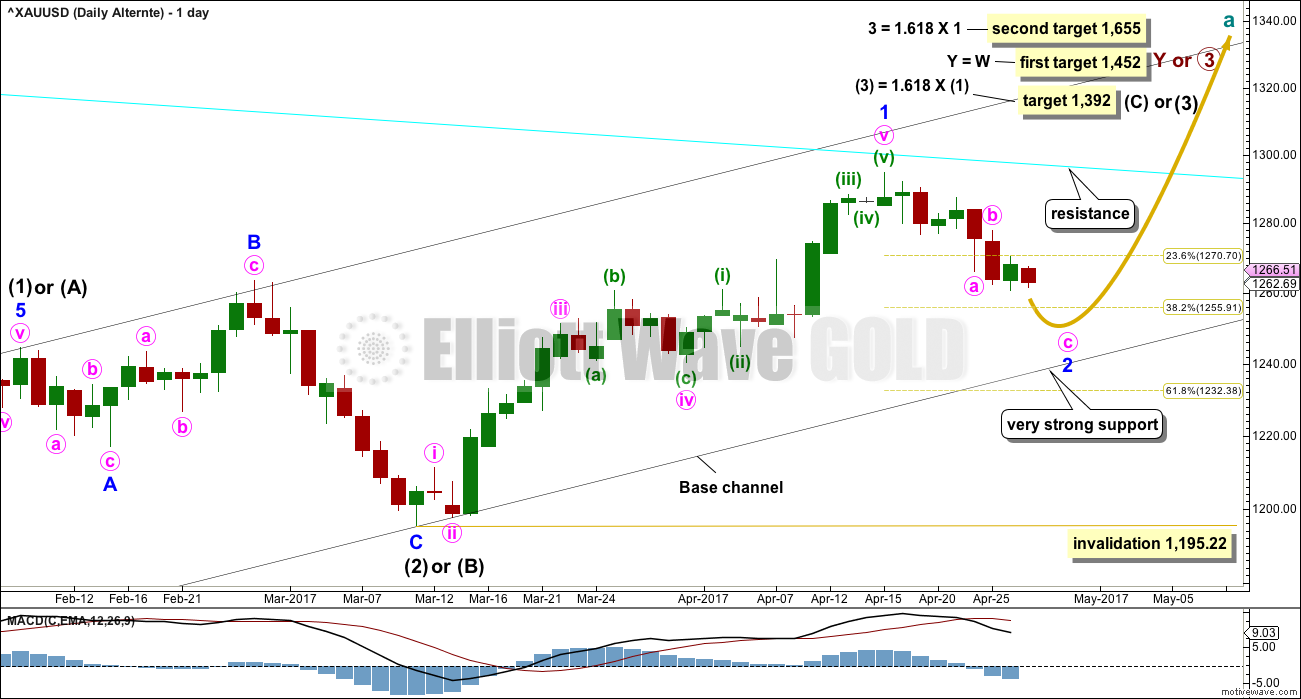
The duration and depth of this correction suggests the pullback may be at minor degree instead of minute degree.
It is possible that minor wave 1 is over at the recent high and now minor wave 2 may be unfolding lower. If it gets down to the lower edge of the base channel, it should find very strong support there. If this wave count is correct, then price should not break below this trend line.
If the pullback does continue, and if it is deeper than the target on the hourly chart, then price may come down to touch the lower edge of the base channel. If that happens, it would offer us a gift of a very good entry point to join the upwards trend. If that happens, then members would be strongly advised to enter long with a stop just below the lower edge of the channel (give the market a little room to move and allow for overshoots).
Minor wave 2 may not move beyond the start of minor wave 1 below 1,195.22. However, if the base channel provides support, price should not get close to this invalidation point. Only if the base channel is breached by a full daily candlestick below and not touching the lower edge would a bearish wave count be considered.
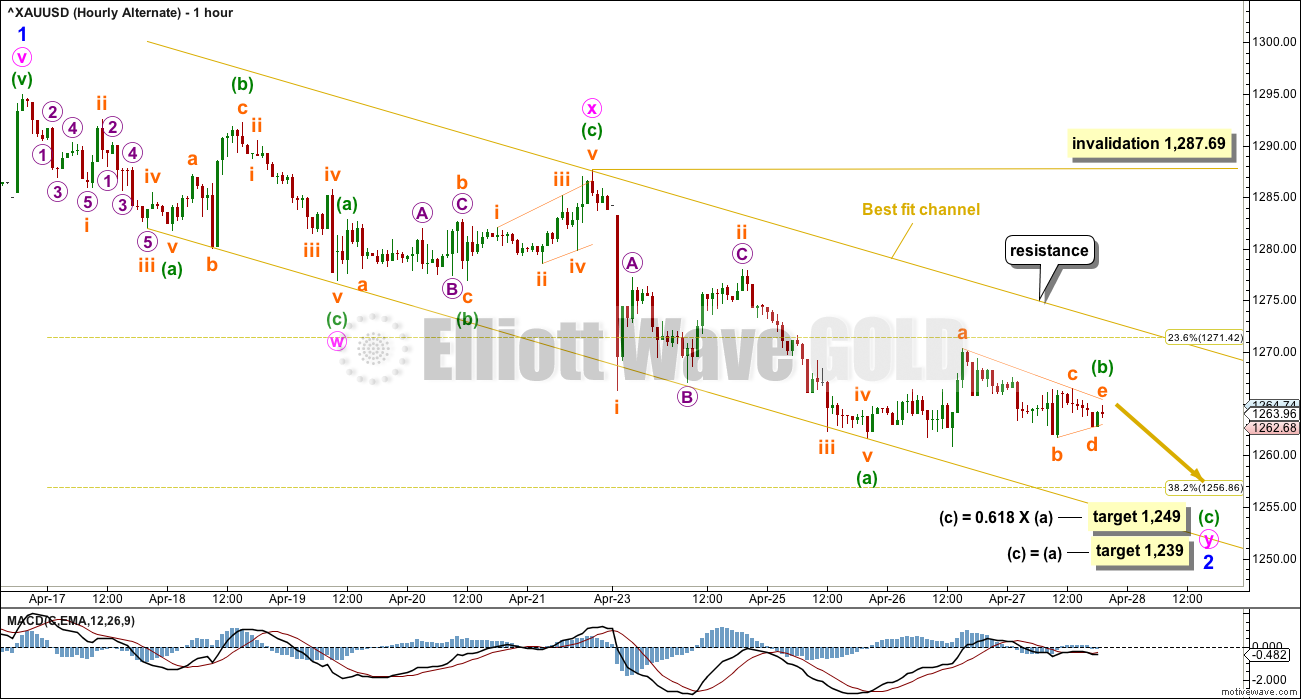
ALTERNATE HOURLY CHART
Click chart to enlarge.
There was an invalid structure in yesterday’s alternate hourly wave count. The leading diagonal for minute wave a did not meet the rules regarding wave lengths for expanding diagonals; specifically, the fourth wave was not longer than the second. This movement is reanalysed.
Minor wave 2 may be an incomplete double zigzag. The second zigzag may require minuette wave (c) downwards to complete. Two targets are calculated which assume minuette wave (b) is complete now. If price gets down to the first target and keeps falling or the structure of minuette wave (c) is incomplete, then the second target would be used. The second target may see minor wave 2 come down to touch the lower edge of the base channel on the daily chart.
Minuette wave (b) is seen here as a regular contracting triangle. Four of the five sub-waves within a triangle must be zigzag or zigzag multiples, and all five sub-waves must be threes. Here, subminuette wave a is a three, a flat correction. The rules regarding structures of triangle sub-waves are met. This potential triangle is supported by MACD now hovering close to zero and almost flat as the triangle completes.
If the targets are wrong, they may be too low. Classic technical analysis today suggests that Gold is finding very strong support about 1,260 and may not be able to break much if at all below this point.
TECHNICAL ANALYSIS
WEEKLY CHART
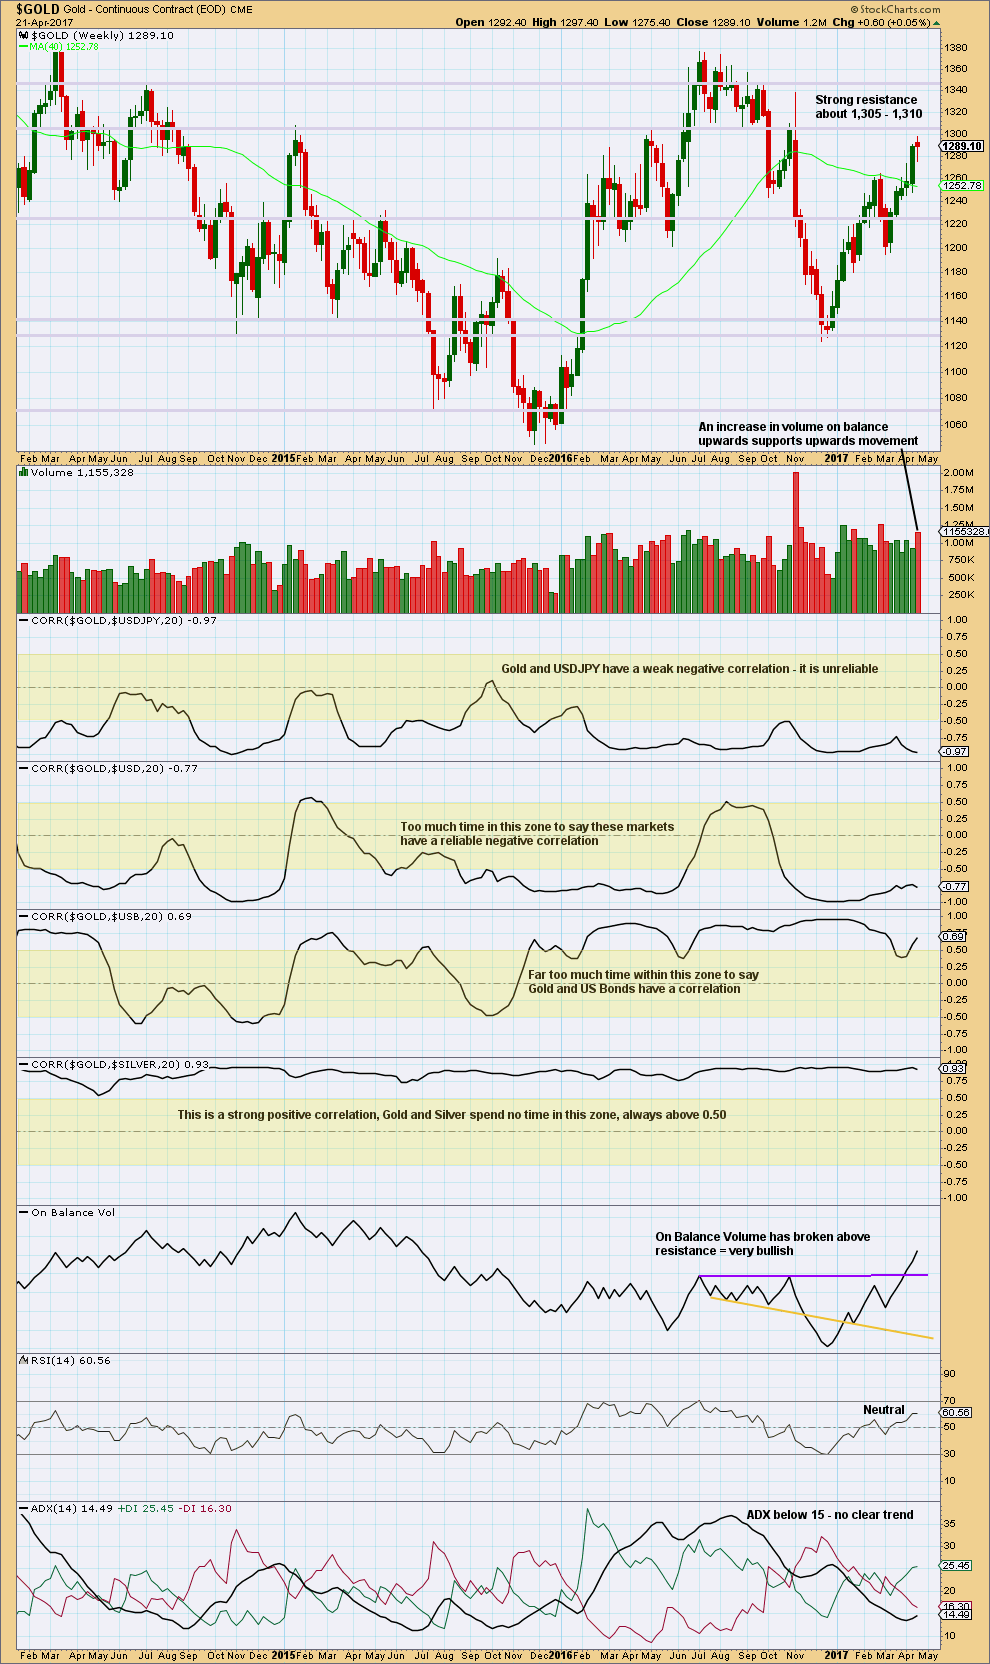
Click chart to enlarge. Chart courtesy of StockCharts.com.
There are a lot of assumptions out there about Gold and its relationships to various other markets. Happily, there is a quick and easy mathematical method to determine if Gold is indeed related to any other market: StockCharts have a “correlation” option in their indicators that shows the correlation coefficient between any selected market and the one charted.
The correlation coefficient ranges from -1 to 1. A correlation coefficient of 1 is a perfect positive correlation whereas a correlation coefficient of -1 is a perfect negative correlation.
A correlation coefficient of 0.5 to 1 is a strong positive correlation. A correlation coefficient of -0.5 to -1 is a strong negative correlation.
Any two markets which have a correlation coefficient that fluctuates about zero or spends time in the 0.5 to -0.5 range (shown by highlighted areas on the chart) may not be said to have a correlation. Markets which sometimes have a positive or negative correlation, but sometimes do not, may not be assumed to continue a relationship when it does arise. The relationship is not reliable.
For illustrative purposes I have included the correlation coefficient between Gold and Silver, which is what strong and reliable correlation should look like.
Gold made a higher high and a higher low this week, although the candlestick has closed red. An increase in volume is bullish. The long lower wick on the candlestick is also bullish although the colour is bearish.
ADX does not yet indicate a trend. If it reaches 15 or above, then it would indicate an upwards trend. RSI indicates there is still plenty of room for price to rise. This chart is bullish.
DAILY CHART
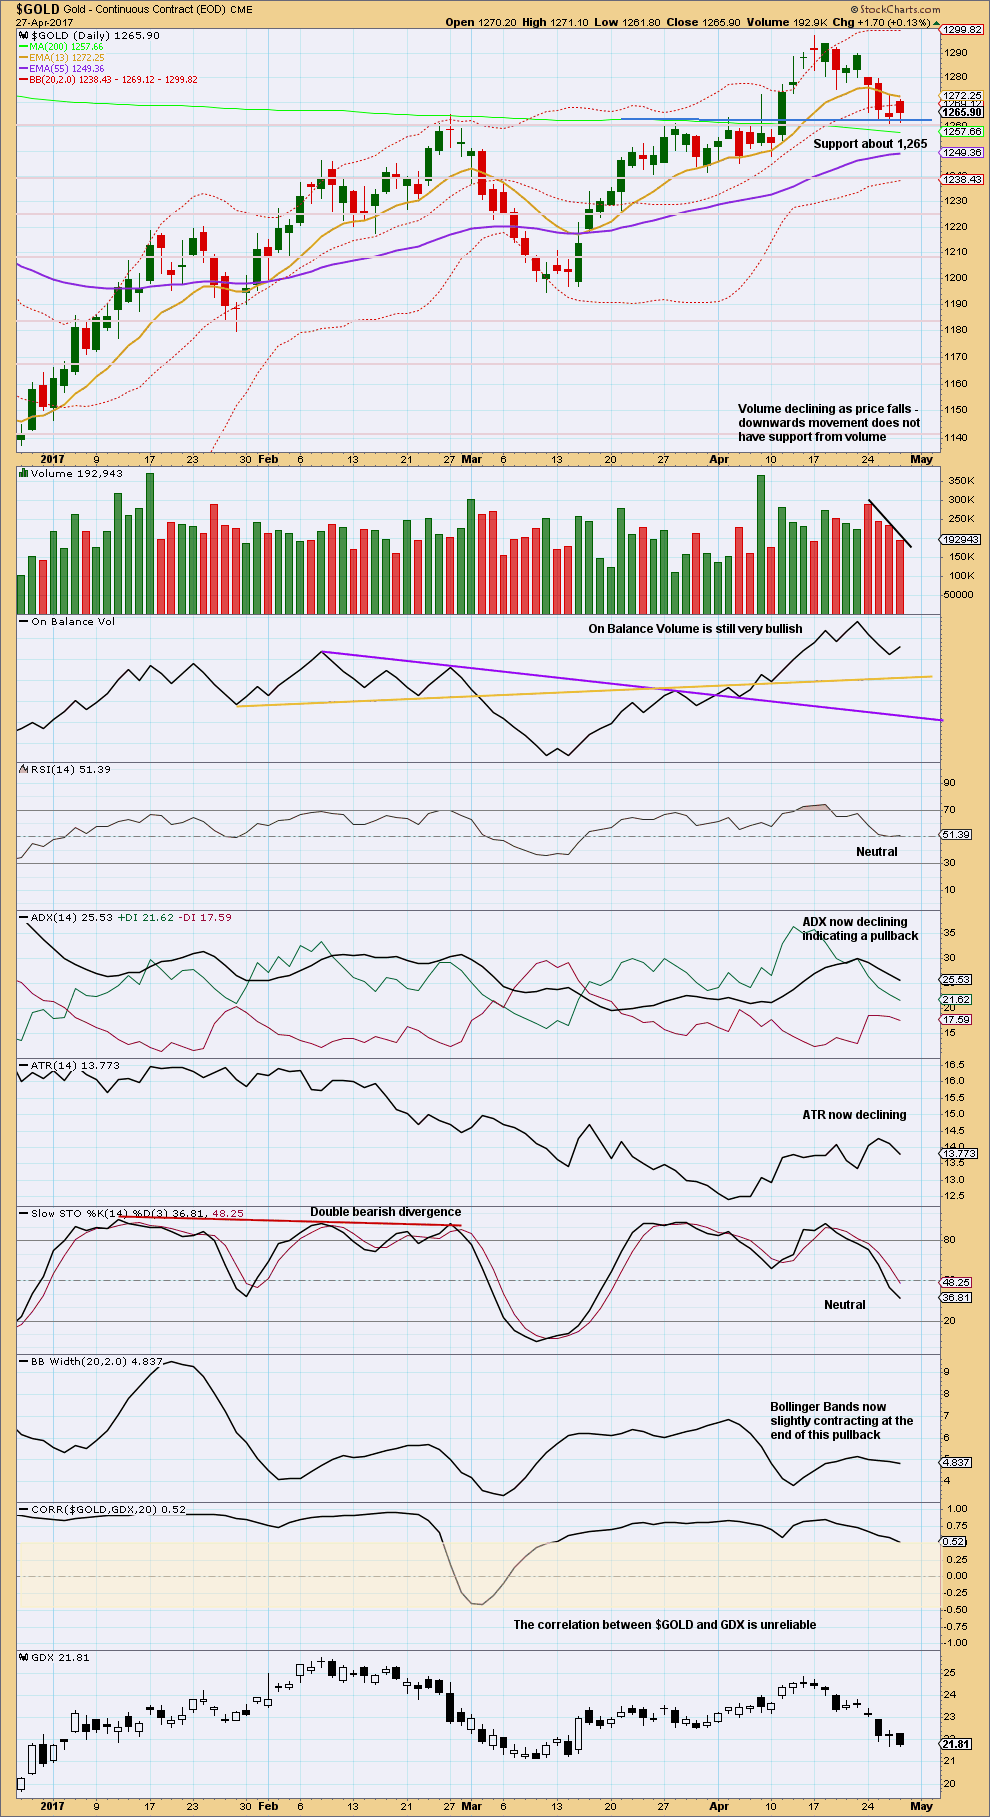
Click chart to enlarge. Chart courtesy of StockCharts.com.
Three days in a row now of downwards movement comes with a steady decline in volume. The last three days have seen Gold remain at support, which was prior resistance for a consolidation about 1,265. It looks very strongly like this downwards movement is still a typical pullback within a larger trend, and it should end here today or very soon indeed. This chart strongly suggests Friday may be a strong upwards day.
ADX, ATR and Bollinger Bands all agree with this view. This pullback looks typical. It has managed to bring ADX and Stochastics down from extreme and will now allow the upwards trend to again develop.
GDX
DAILY CHART
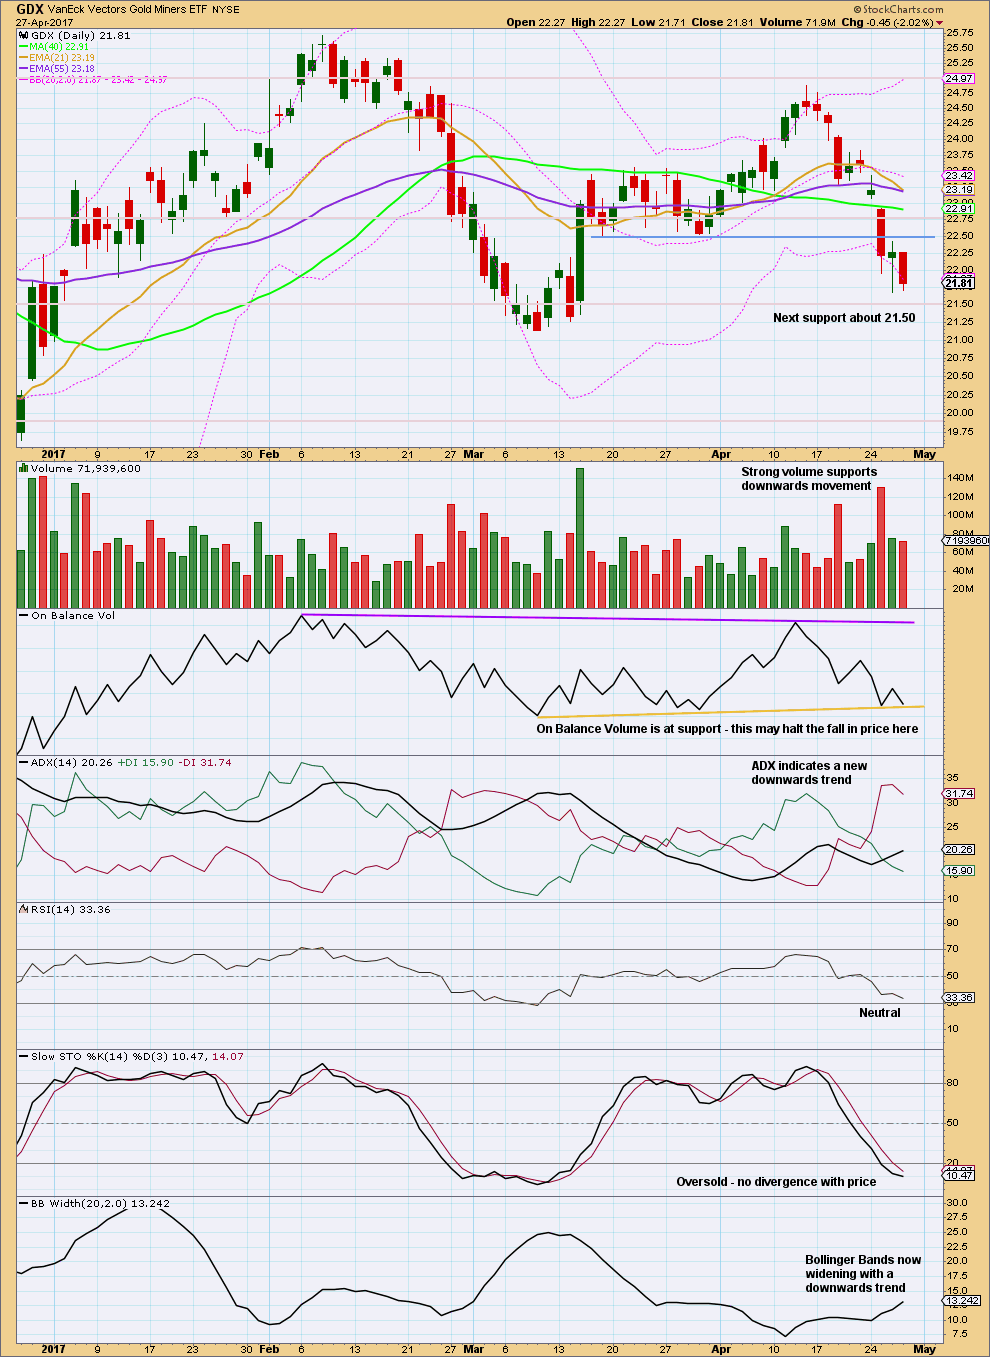
Click chart to enlarge. Chart courtesy of StockCharts.com.
On Balance Volume strongly suggests today that a low may be in for GDX. A decline in volume for an inside day with the balance of volume downwards also suggests a low may be in.
STUDY OF A THIRD WAVE IN $GOLD
Click chart to enlarge.
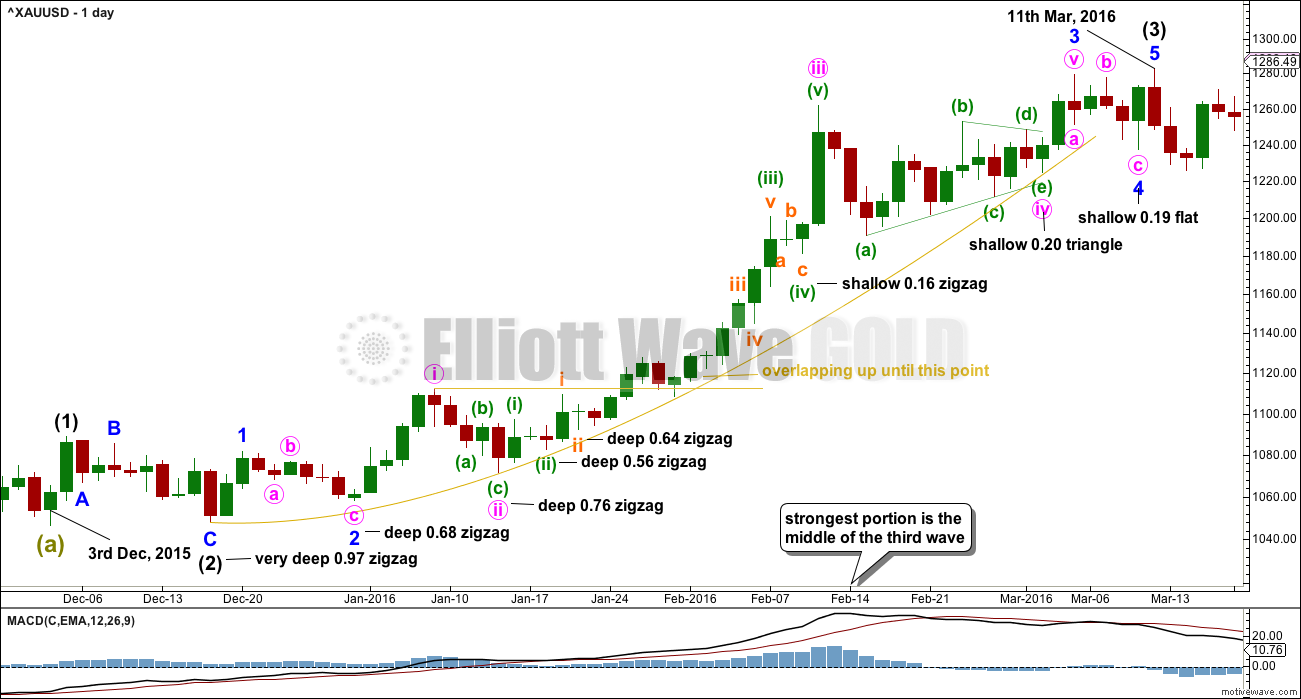
This study of a third wave will be left in daily analysis until the current third wave is either proven to be wrong (invalidated) or it is complete.
This third wave spans 59 trading days.
It was not until the 40th day that the overlapping ended and the third wave took off strongly.
The middle of the third wave is the end of minute wave iii, which ended in a blow off top.
There is excellent alternation between second and fourth wave corrections.
This third wave began with a series of five overlapping first and second waves (if the hourly chart were to be added, it would be seven) before momentum really builds and the overlapping ends.
The fifth wave of minuette wave (v) is the strongest portion.
This third wave curves upwards. This is typical of Gold’s strong impulses. They begin slowly, accelerate towards the middle, and explode at the end. They do not fit neatly into channels. In this instance, the gold coloured curve was used.
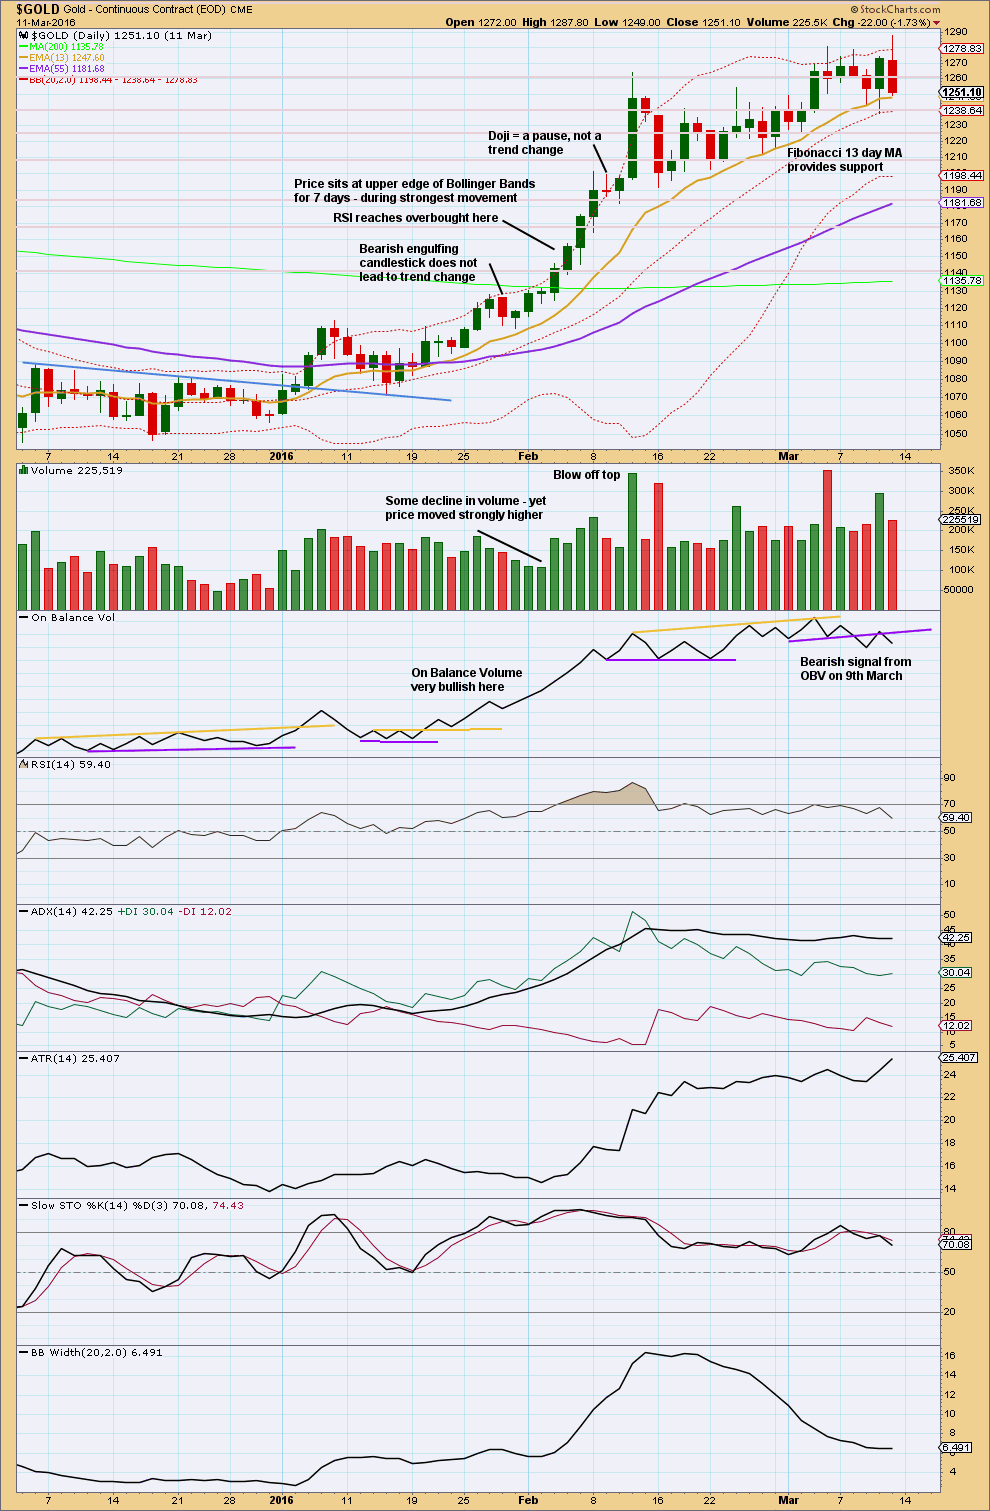
Click chart to enlarge. Chart courtesy of StockCharts.com.
This trend began after a long consolidation period of which the upper edge is bound by the blue trend line. After the breakout above the blue trend line, price curved back down to test support at the line before moving up and away.
RSI reaches overbought while price continues higher for another five days and RSI reaches above 85. The point in time where RSI reaches overbought is prior to the strongest upwards movement.
ADX reached above 35 on the 9th of February, but price continued higher for another two days.
The lesson to be learned here: look for RSI to be extreme and ADX to be extreme at the same time, then look for a blow off top. Only then expect that the middle of a big third wave is most likely over.
The end of this big third wave only came after the blow off top was followed by shallow consolidation, and more highs. At its end RSI exhibited strong divergence with price and On Balance Volume gave a bearish signal.
Third waves require patience at their start and patience at their ends.
This analysis is published @ 08:43 p.m. EST.
On the question of fundamentals, there is another consideration equally as important as the removal of physical metal from the market place by strong hands, and hedging by those massively long equities, and that is the erstwhile FED. I have been doubled over with laughter listening to them talk about three rate hikes this year. What is truly remarkable is people have not only been talking about this as if it is true, they have been trading this way as well. You have got to hand it to Yammerin’ Yellen for bamboozleing the crowd. Meanwhile, GDP for the first quarter is now expected to be a whopping 0.6%! We will probably get a negative print for the second quarter, even without a rate hike. Raising rates will guarantee it. The FED may be crazy, but they are not stupid. What do you think is going to happen to precious metals when they start hemming and hawing about future rate hikes? When they announce that they will actually begin another easing cycle? When they announce QE.5?
Think about it! You are in a position to front-run the coming stampede when it finally dawns on the masses…Stay Frosty!
I think it is always a good idea to respect the possibility of a bearish count in the precious metals sector. I am also quite amused at how some technical analysts absolutely scoff at the idea of fundamentals having anything to do with EW theory and the possible wave counts. I recently saw some analysis that contended that you don’t have a true bull market until old highs have been exceeded, and by that measure the NDX bull market is only just getting started, never mind the state of the global economy or what tech firms are earning. When it comes to the precious metals sector, I for one am intensely interested in the fundamentals. Fundamentals like the fact that some 600 tons of paper Gold are traded daily, with less than 5 tons ever being delivered. There have been a case or two in which the combined purchase of the Russians and the Chinese have exceeded annual world production, which means the rest of the metal came from somewhere else – it moved from West to East. Neither the Russians nor the Chinese governments permit a single ounce to leave their territory. There is historical precedent (India) for demand for delivery of as much as 200 tons. Remember once that FX spread is locked in the purchaser can insist on delivery even in the face of prices much higher than the locked-in rate, which is the subterfuge bullion banks have relied on to keep the paper scheme alive. The rumour is that bullion banks are leveraged 90: 1, and if you include derivatives, more like 500:1!! As you are aware, they recently changed the rules so that retail investors can no longer insist in delivery on their futures contracts. Unless you are holding contracts that meet a certain tonnage (nothing most of us can afford), you can be forced to accept paper.
Here is the key thing, apart from all the macro-economic and sovereign governments exisiting policy with regard to the precious metals. A remarkable number of big funds heavily invested in the equities markets are not as delusional regarding the equity bubble as one might assume. They are hedging their long equity positions with long precious metals trades. They are not so much speculating, as they are hedging, and there is a gargantuan difference. Bankster raids simply flow like water off a duck’s back when it comes to attempts to dislodge hedging positions.
The dual effect of sovereign governments removing physical metal from the market (making naked shorting even more perilous) and cohorts using long contracts for hedging makes for a potentially explosive situation when it comes to fundamentals.
Banks can either cover their short contracts, or experience a “failure to deliver”. Most of you know what the latter means, and you understand why it will never happen. The entire system would blow up if that happened. The banks are too big to fail and know they will be bailed out. They WILL eventually cover. All any sovereign government has to do to blow up the COMEX is insist on delivery of a measly 300, or even 250 tons worth of futures contracts. Why don’t they do it? To keep accumulating at these depressed prices….of course!! Never let anyone tell you that fundamentals don’t matter. They most certainly do, and it is just a matter of time before everyone becomes painfully aware of that fact. 🙂
Hi Lara -i wonder if you had a chance to look over the monthly chart i posted yesterday. I was hoping you would give it an extremely low probability 🙂
On another note, i just happened to notice today that AEM surged on high volume and bested its 200 day MA. It’s based on a surprise earnings report, but i think if miners were about to head into the dumpster it might be unlikely for a large miner to act so well on good news. It would be a confirmation if it didn’t react so well. It might be a tell that it did. I also see that NEM has fully recovered from its drop the other day from a negative earnings report. It still looks kinda bearish overall, but we might glean the same conclusion from that as well.
Edit – looks like i mixed up NEM with ABX, which did not recover yet
I’ve taken a look. The gross disproportion between the triangle for primary 4 and primary 2 makes it look just wrong. P4 would have lasted 46 months, while P2 would have lasted only 13 months.
The difference is just too big. It looks wrong.
This is the monthly alternate wave count. It’s very bearish. This has a better fit than the idea of the triangle continuing.
This monthly chart is in the last published monthly and weekly charts historic analysis, linked to at the top of each daily analysis.
Thanks Lara! Indeed I think the longs need a move above 1300 and over the monthly downtrend line asap or it gets scarier as more time goes by without an upside breakout
So we are potentially either at the start of a 3rd wave up or a 3rd wave down!!!
I’m curious Lara what the probability is in your estimation for this bearish scenario?
Well folk, I can only conclude that they plan on making their final stand after regular market hours. I will be looking for a serious bankster bear raid over the week-end. A lot of people are saying that they have thrown in the towel and they simply are unable to drive price lower, but they don’t know these guys – they are devious! One way or another, there should be some fireworks ahead! Have a great week-end everyone!! 🙂
Hi. Looks like Gold price is finding support 1264-61 for bottoming with Silver poised to rally. On weekly outlook basis though, expecting both Gold and Silver to pullback. Lets see if one can make a two way trade out of this or simply go long on a pullback or just stay long Gold with downside risk 50dma (better still 200dma lol). Interesting times ahead.
I’ve got a bit of dry powder I have been saving for any sudden spike down on Silver but so far no cigar. It seems to be embarking on the slow torturous track to the upside rather than a sharp capitulation bounce. I will consider a green print today sign of a possible bottom.
https://www.kimblechartingsolutions.com/2017/04/gold-miners-largest-outflows-history-bullish-says-joe-friday/
Another interesting sentiment indicator. Some coin dealers I know say everyone is coming in to sell their gold eagles. Can you imagine?!
A third consecutive day of Silver trading entirely below its lower BB is as about as stretched as it gets during recent corrections. They have given up trying to smash Gold and figure if they can intimidate the smaller Silver marker then Gold will follow suit. Last time I looked, neither Gold nor the miners seem too impressed. They can cover now, or they can cover later. If the latter, a slow and painful short squezze march higher ahead. If the former, a Nike upside swoosh.
Silver back testing a major trend line and also finding support at an internal trend line. Seems to be a key spot.
Quite frankly, I’ve never been this long both the metals and the miners in my life.
The most concerning aspect of being long is how gold has actually held strong – “typically” you’d see the miners lead or silver lead – but not always. There is likely going to be a *yuuuge* catch-up run in the miners.
Another GDXJ article
http://www.safehaven.com/article/44261/misunderstanding-gdxj-why-its-actually-great-news-for-junior-miners
Gold:
> Breakout of inverted H&S pattern neckline, then back test
> Breakout of purple downtrend line, halted at blue downtrend line, and now back-testing the purple downtrend line
> Likely a little more down before the uptrend resumes
Silver:
> Much weaker than gold. False breakout at inverted H&S neckline and false breakout of symmetrical triangle
> Short term uptrend line now broken
> A new low below 16.83 is looking likely
GDX:
> False breakout of the symmetrical triangle followed by further weakness and breakdown of the short term uptrend line
> Found support at the lower symmetrical triangle trendline: however, it is likely the move down is not over
> Expecting a new low below 21.14 and possibly as deep as 20.31, before a strong reversal to the upside with an “around the apex” move
USD:
> H&S neckline breakdown, then backtest
> Symmetrical triangle trendline breakdown, then backtest
> Looks very bearish with more down likely
https://www.tradingview.com/x/gU83mgax/
Interestingly $GOLD and $USD are currently not negatively correlated. Their correlation coefficient is at the moment -0.31