
Last week expected a small consolidation short term, which is what has happened.
Summary: So far, from the low on the 15th of March, price has made a series of higher highs and higher lows at the daily chart level. If the Elliott wave analysis is correct, then the current pullback presents a good opportunity to join the trend. However, classic analysis does not offer support to the Elliott wave count with the exception of On Balance Volume, which is bullish. If joining this trend here, it is essential that risk is managed: stops may be set just below 17.754, and do not invest more than 1-5% of equity on this trade.
New updates to this analysis are in bold.
Last monthly chart is here.
ELLIOTT WAVE COUNT
WEEKLY CHART
Click chart to enlarge.
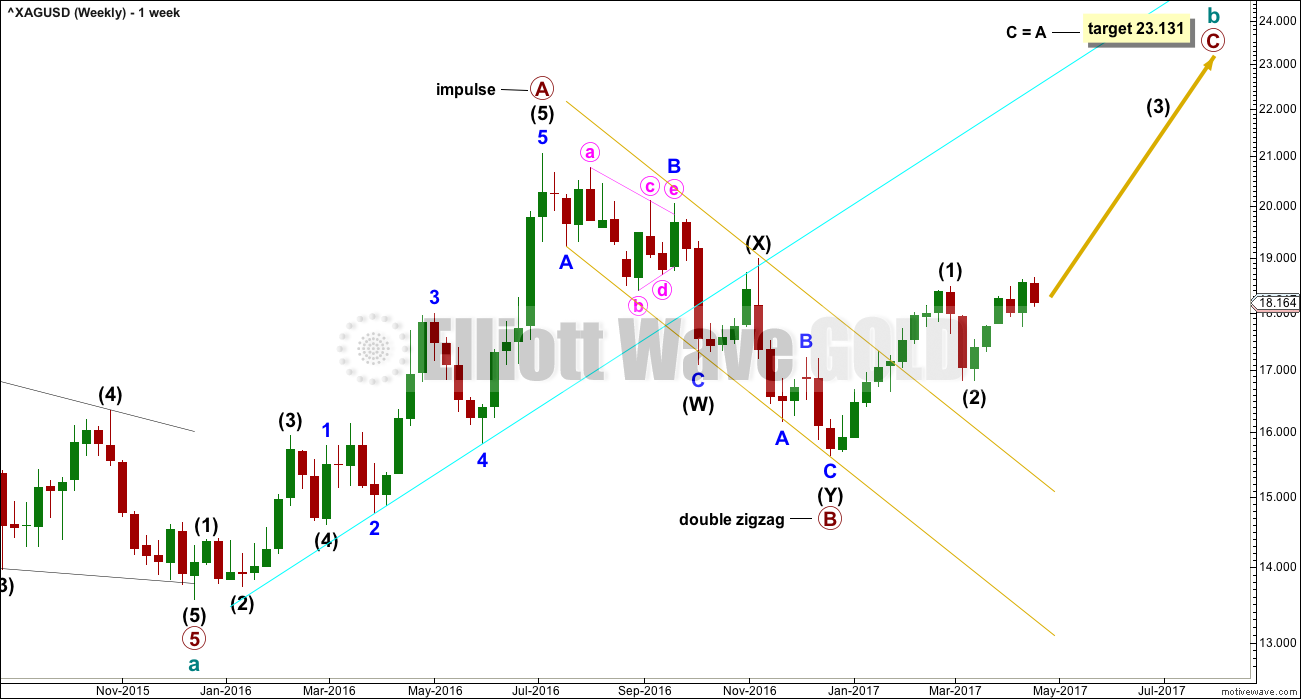
Upwards movement labelled primary wave A fits perfectly as an impulse.
Primary wave B fits as a deep double zigzag. Primary wave C must subdivide as a five wave structure. The target expects it to reach the most common Fibonacci ratio to primary wave A.
Primary wave A lasted 29 weeks. Primary wave B lasted 24 weeks. These waves are in proportion.
DAILY CHART
Click chart to enlarge.
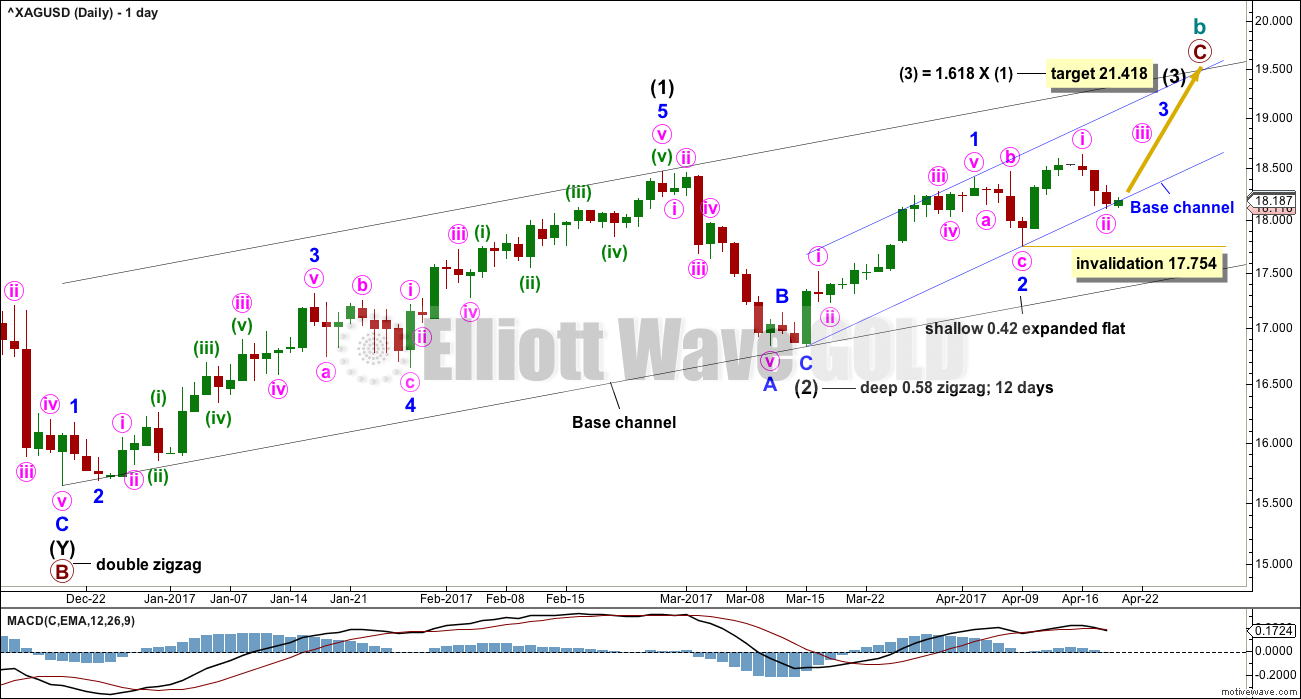
A third wave up now at three degrees may be beginning for Silver. Minute wave ii may not move beyond the start of minute wave i below 17.754.
A blue base channel is added. Along the way up corrections should find strong support at the lower edge of this channel. If this wave count is correct, then this trend line should not be breached.
At this stage, the trend line is about where price found a low for the last session. Base channels almost always work to show where lower degree second waves should end, but not always. It is most likely then that minute wave iii should begin here.
TECHNICAL ANALYSIS
WEEKLY CHART
Click chart to enlarge. Chart courtesy of StockCharts.com.
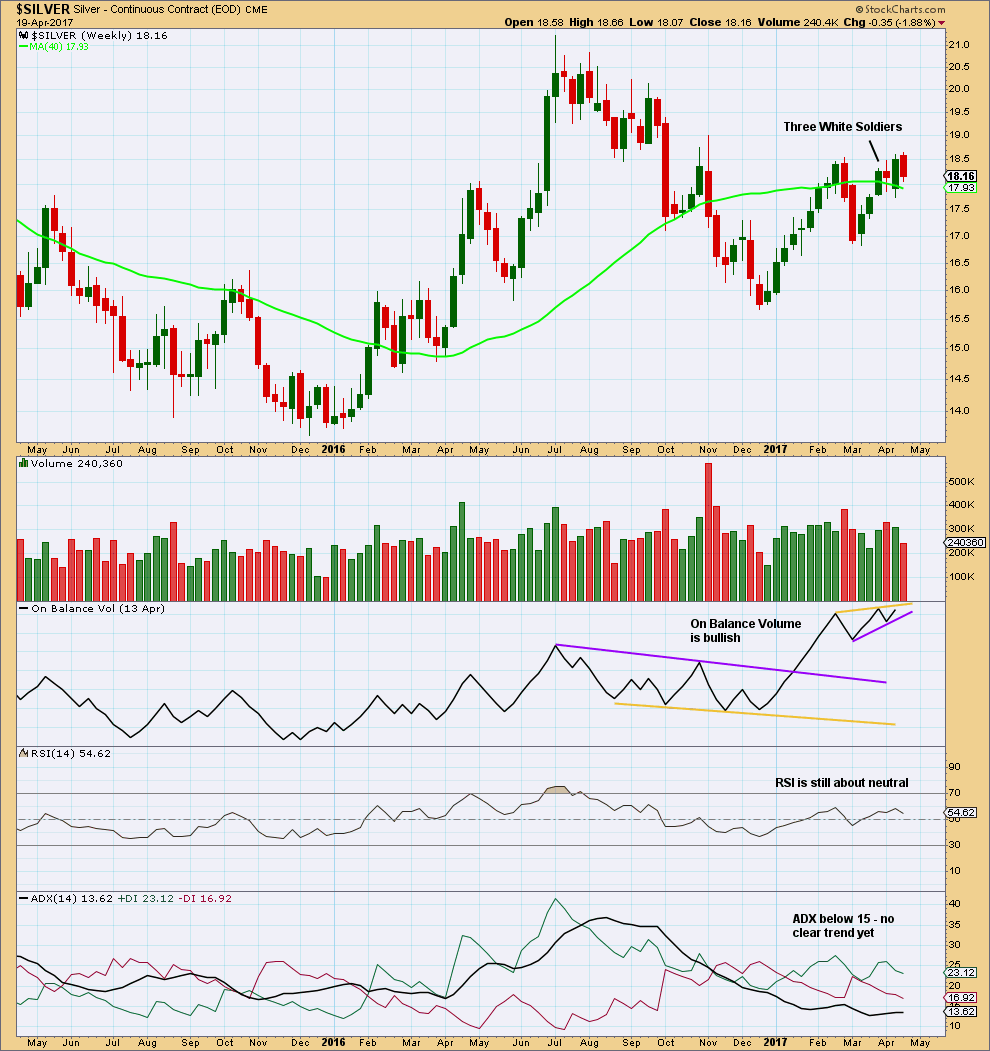
This upwards wave has begun with a bullish candlestick pattern, Three Advancing White Soldiers.
On Balance Volume is now constrained within two new trend lines. A break out of this zone would provide a new signal. At this time, On Balance Volume is bullish.
This possible upwards trend is still in its early stages at the weekly chart level; ADX is not yet above 15.
DAILY CHART
Click chart to enlarge. Chart courtesy of StockCharts.com.
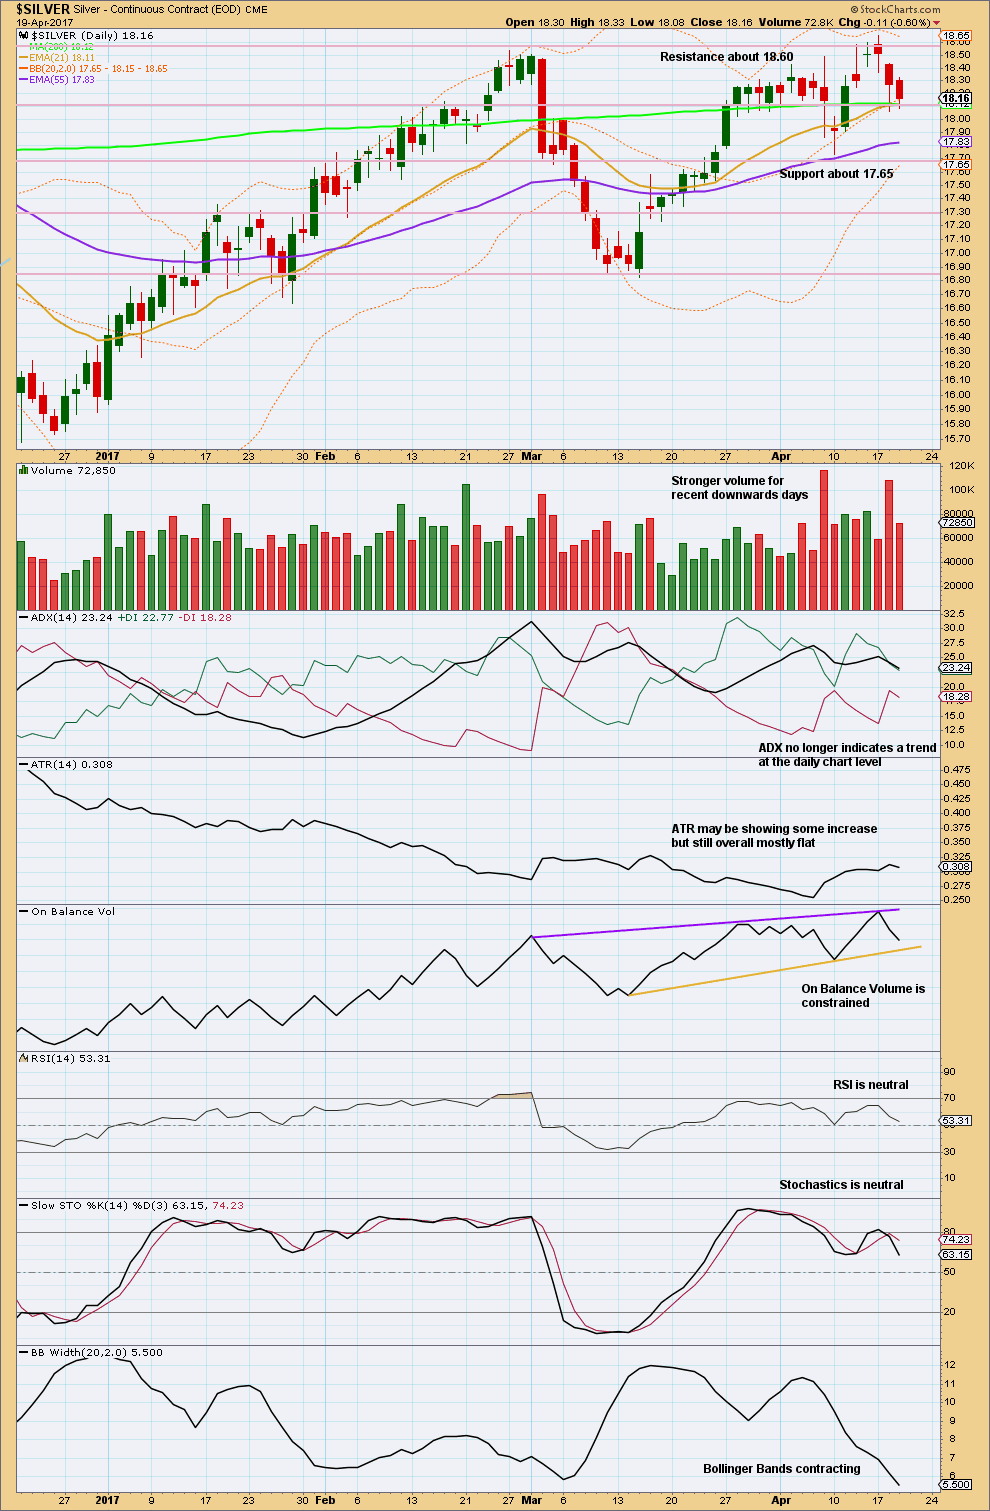
The longer lower wicks on the last two red daily candlesticks is slightly bullish. The decline in volume for the second downwards day indicates a lack of support for the fall in price from volume. This is slightly bullish.
ADX indicates a consolidation. Price is bound by resistance about 18.60 and support about 17.65. It is two downwards days during this consolidation which have strongest volume, suggesting a downwards breakout is more likely than upwards. This contradicts the Elliott wave analysis.
ADX, ATR, Bollinger Bands, RSI and Stochastics are all neutral.
On Balance Volume is relatively bullish with a recent higher high and so far a higher low. A break out from On Balance Volume would be a reasonable signal.
This analysis is published @ 04:03 a.m. EST.
Hi Lara, what is the situation with Silver? How low is it going to go?
hello lara
should we trial our stoplosss in crude, currently running at 50.73 or should keep same as suggested you at the time of recommendation.
Move to at least breakeven. Or bring down to the low of the 12th of April (FXCM data has that at 52.72) That should be the low of a first wave, any fourth wave correction shouldn’t overlap back into that price range.
Once there’s more downwards movement with a correction or two along the way then we can draw a resistance line and use that to set a trailing stop, we can move stops down daily.
It’s too early to do that now.