
A pullback was expected for Silver. Price continued higher with a small sideways movement during the week.
Summary: Watch On Balance Volume carefully for a signal. Silver may have completed a small consolidation; it may not show a deeper pullback now. Silver is in an upwards trend. The target is at 21.418. Corrections are an opportunity to join the trend. Always use a stop and do not invest more than 1-5% of equity on any one trade.
New updates to this analysis are in bold.
Last monthly chart is here.
ELLIOTT WAVE COUNT
WEEKLY CHART
Click chart to enlarge.
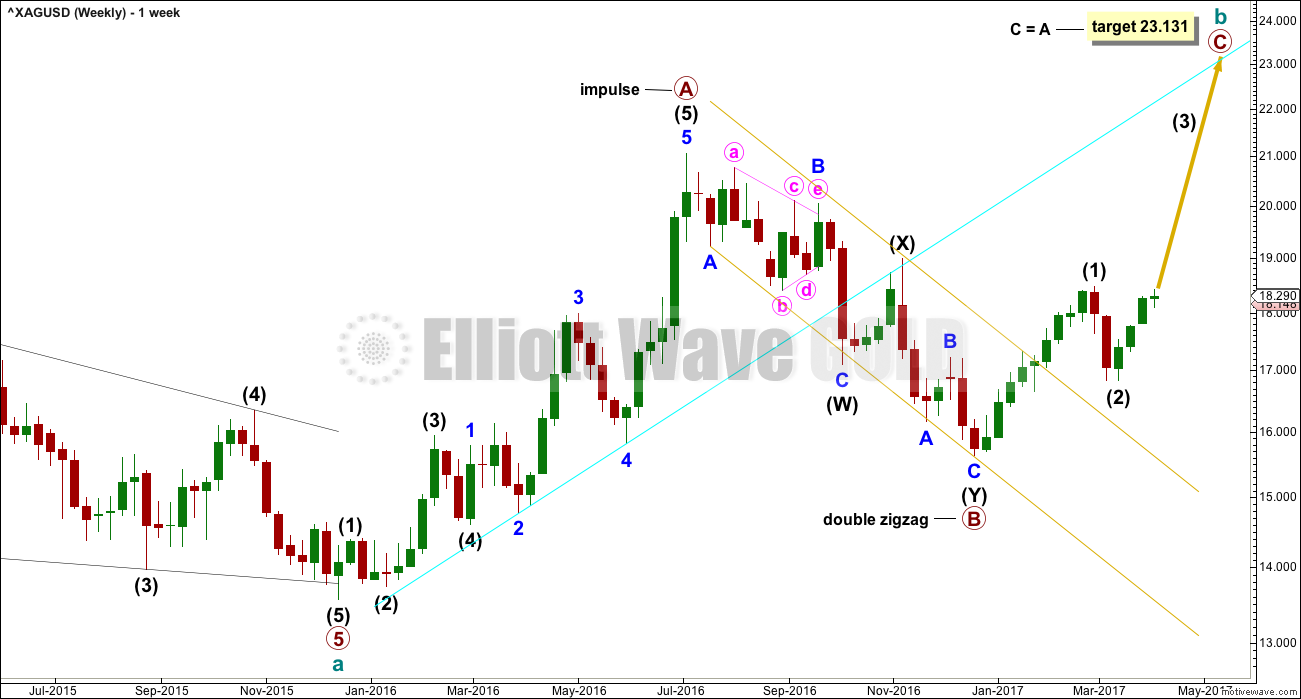
Upwards movement labelled primary wave A fits perfectly as an impulse.
Primary wave B fits as a deep double zigzag. Primary wave C must subdivide as a five wave structure. The target expects it to reach the most common Fibonacci ratio to primary wave A.
Primary wave A lasted 29 weeks. Primary wave B lasted 24 weeks. These waves are in proportion. However, B waves can be very long lasting, so it is important to consider alternates. An alternate is provided at the daily chart level.
DAILY CHART
Click chart to enlarge.
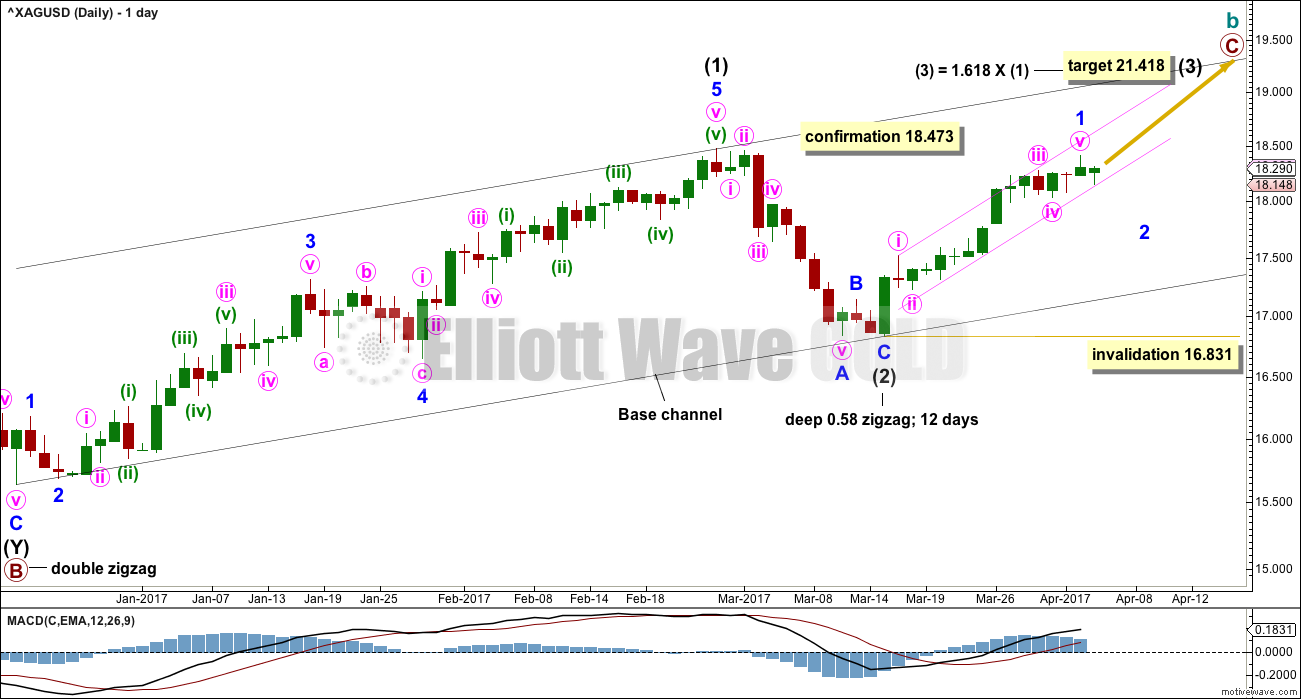
Intermediate wave (2) now looks complete as a zigzag, close to the 0.618 Fibonacci ratio of intermediate wave (1).
A new high above 18.473 would invalidate the alternate below and provide confirmation of this main wave count. At that stage, intermediate wave (3) would also have moved beyond the end of intermediate wave (1) meeting the Elliott wave rule.
Within intermediate wave (3), no second wave correction may move beyond the start of its first wave below 16.831.
A small best fit channel is drawn this week about minor wave 1. The bottom line for Silver is that while price remains within that channel expect the upwards trend to continue. If price breaks below the lower edge of the channel, then a second wave correction would likely have begun.
The strong upwards pull now of a big third wave may force any upcoming pullbacks to be relatively brief and shallow. Upwards momentum should begin to build. Upwards movement should have support from increasing volume.
Lower degree corrections should now find support at the lower edge of the base channel.
ALTERNATE DAILY CHART
Click chart to enlarge.
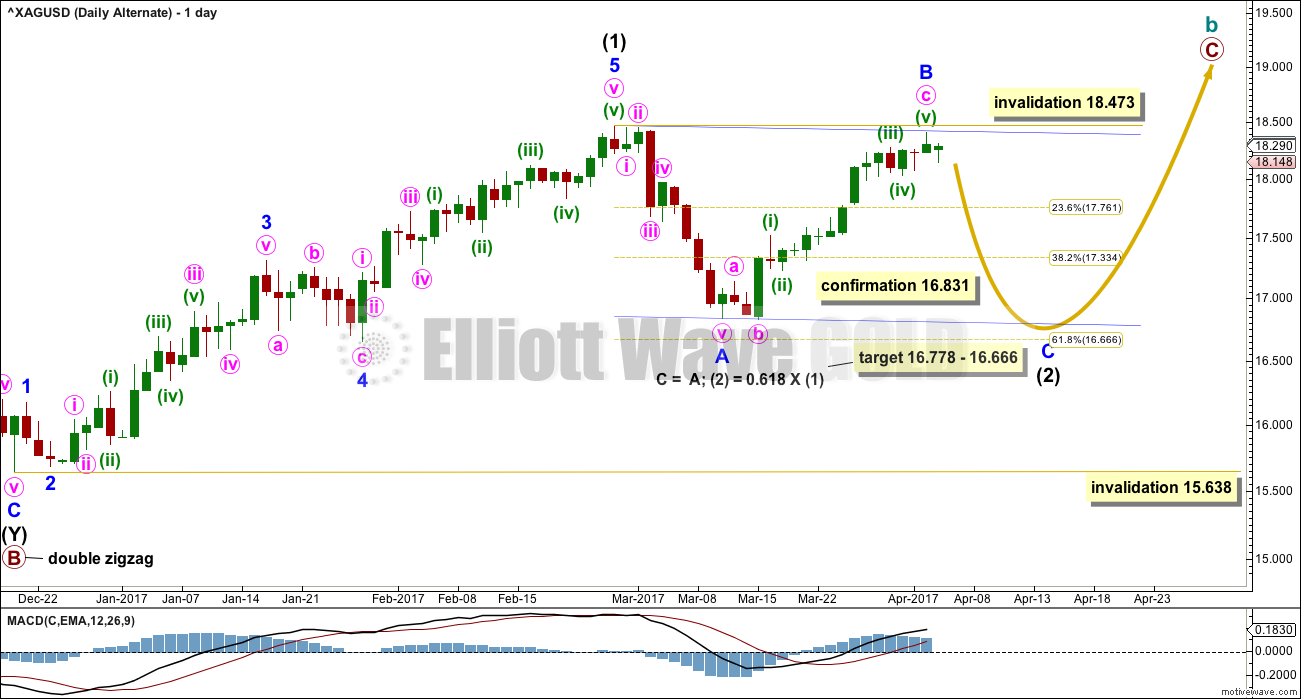
What if intermediate wave (2) is not over?
Minor wave A will fit as a five and minor wave B fits as a regular flat correction. However, regular flats normally have C waves which are about even in length with their A waves and they normally fit neatly within a small channel. This one has a remarkably long C wave, so this substantially reduces the probability of this wave count this week.
The target is recalculated this week for intermediate wave (2) to end.
Intermediate wave (2) may not move beyond the start of intermediate wave (1) below 15.638.
TECHNICAL ANALYSIS
WEEKLY CHART
Click chart to enlarge. Chart courtesy of StockCharts.com.
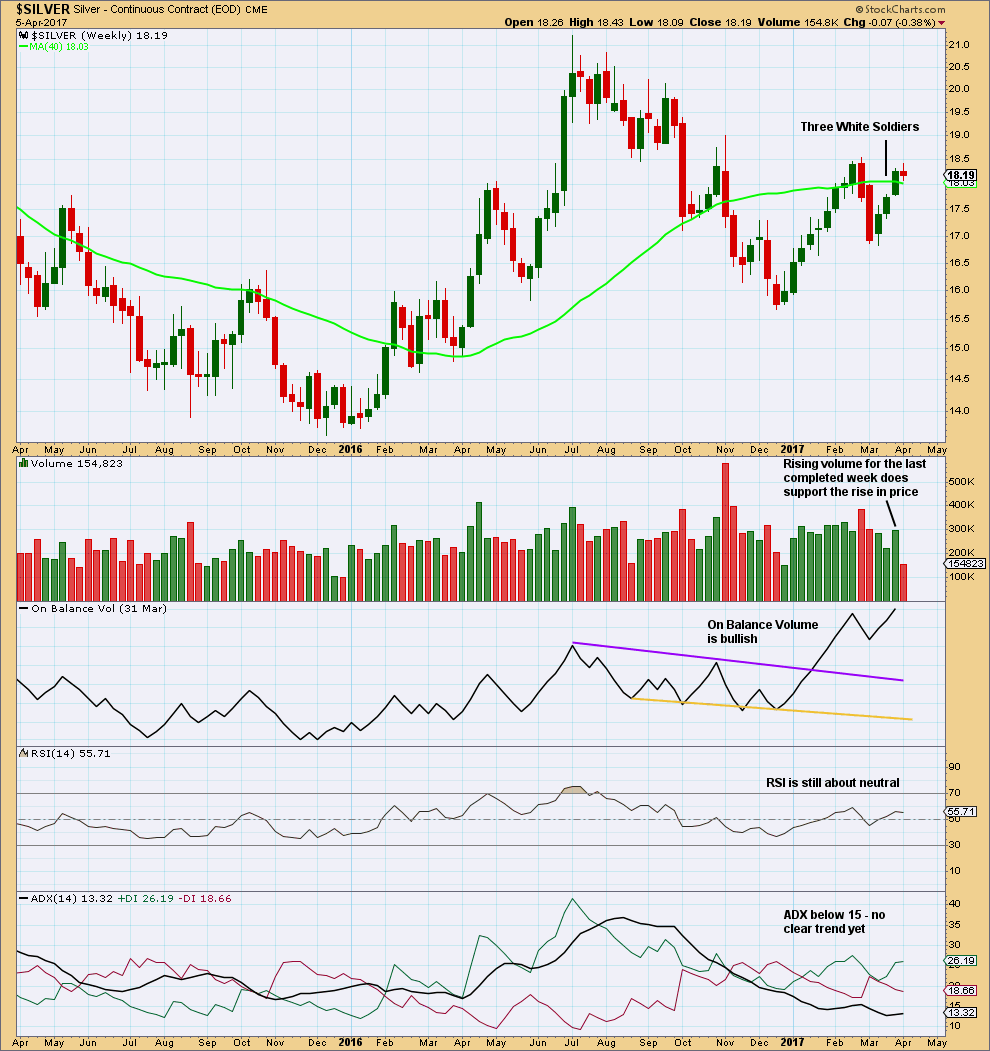
The last three green weekly candlesticks complete a bullish candlestick pattern, Advancing Three White Soldiers. This supports the main Elliott wave count over the alternate.
DAILY CHART
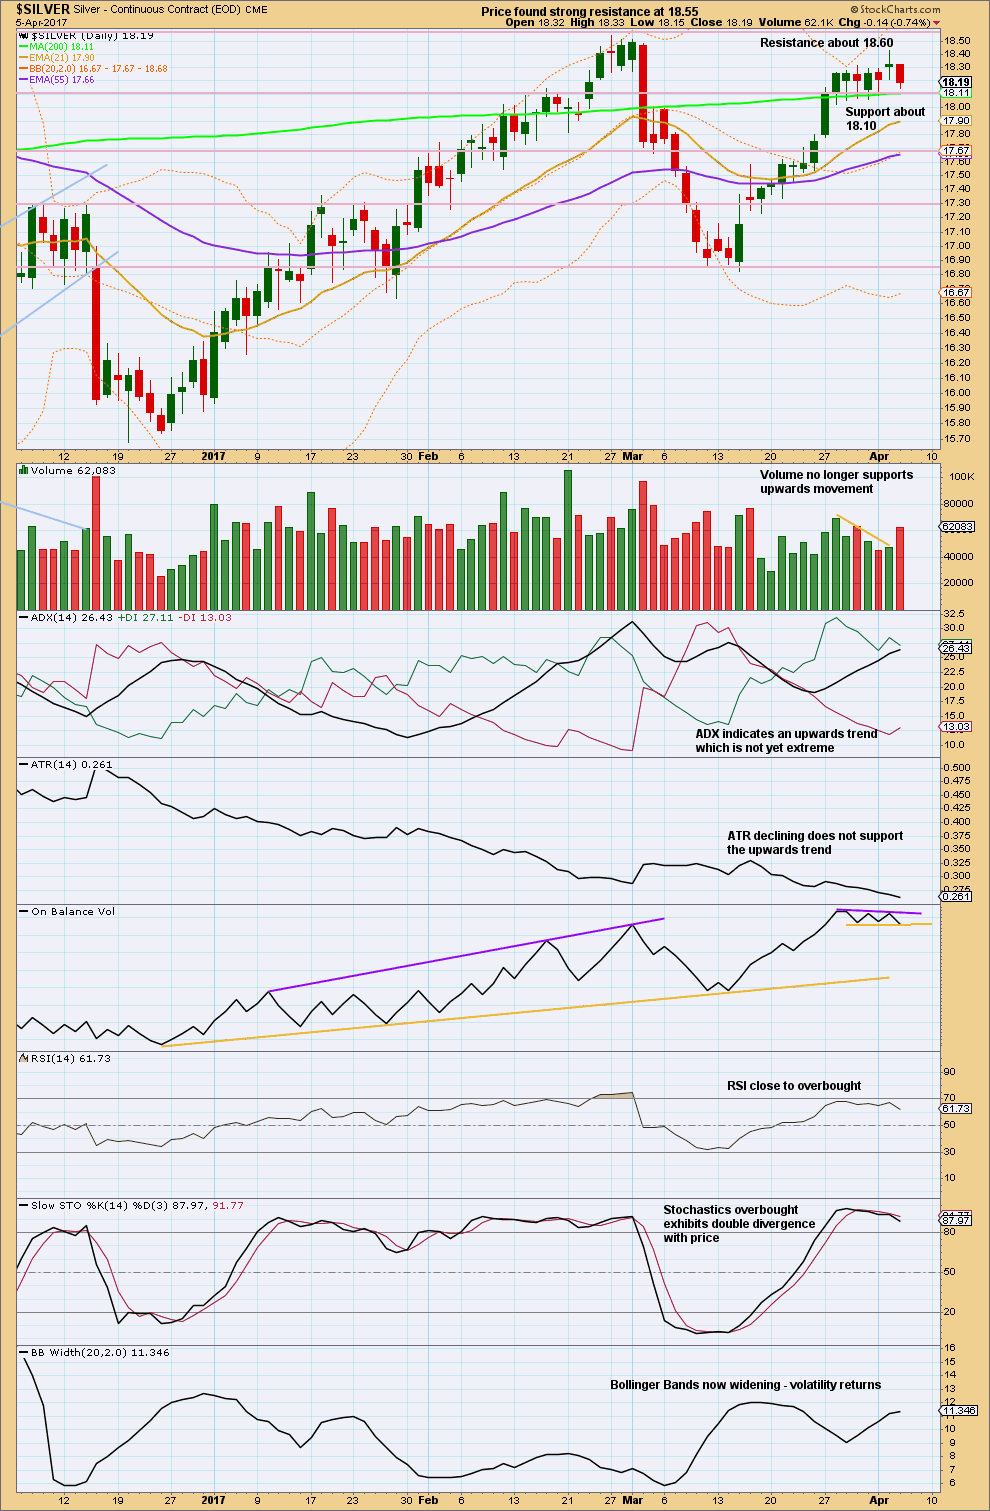
Click chart to enlarge. Chart courtesy of StockCharts.com.
Price did move into a small consolidation that was brief and shallow. This has not resolved overbought conditions though.
The last session moved price lower on strong volume. This may be the first session of a pullback.
Stochastics is bearish, ATR is bearish, and volume is bearish for the short term.
RSI is still neutral. ADX is bullish.
On Balance Volume now is constrained within a tight range. A breakout by On Balance Volume from this range would provide a signal. If it breaks below support, then expect a multi day pullback has begun. If it breaks above resistance, expect the upwards trend to show a strong increase in momentum and volume.
Stochastics may remain extreme for long periods of time, when Silver trends, and it may develop multiple divergence with price before price turns.
This analysis is published @ 05:25 p.m. EST.