
Today’s Trading Room looks at Copper and US Oil.
Only a recommendation on Gold is given for Elliott Wave Gold members.
To learn what the Trading Room is about see first Trading Room analysis here.
Trading Room will focus on classic technical analysis. Elliott wave analysis will be for support and for targets / invalidation points.
Copper (Spot)
TECHNICAL ANALYSIS
Click chart to enlarge. Chart courtesy of StockCharts.com.
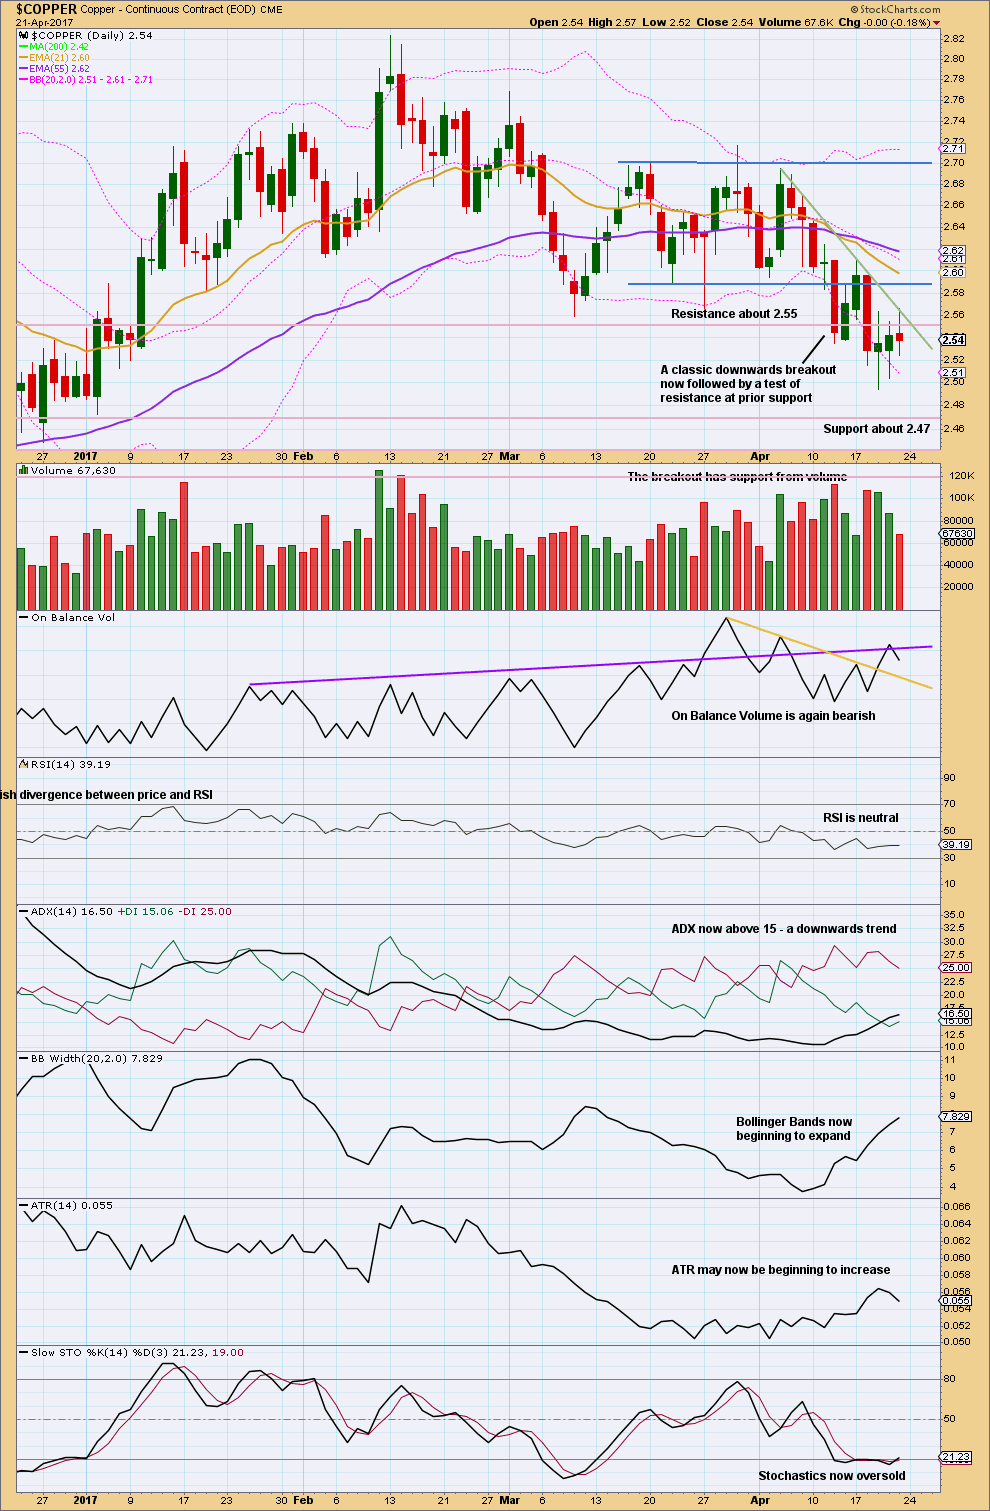
On the 12th of April Copper had a classic downwards breakout from a consolidation zone, which was supported by volume.
A resistance line is added this week in green. Price might find some resistance at this line, but at this stage the line does not offer good technical significance because it is steep and not long held.
Looking back over the last 2 years, horizontal support and resistance lines are added. Price may find some resistance here about 2.55.
The long lower wick on the candlestick for the 20th of April is bullish. Now the relatively long upper wick on the 21st of April is a little bearish. This upwards movement looks like another small bounce and this view is supported by declining volume.
On Balance Volume is again bearish, turning down from the purple line.
There is a downwards trend which is not extreme.
TREND LINE

Click chart to enlarge.
Copper has found very strong resistance at the green trend line, which goes back to at least August 2011. The doji candlestick for February puts the trend from up to neutral.
ELLIOTT WAVE ANALYSIS

Click chart to enlarge.
The blue channel continues to show about where price may find resistance and support. If this Elliott wave count is correct, then Copper should break through support at the lower edge of the channel and then increase in downwards momentum.
Trading advice for members only: [wlm_private “GOLD Daily YT|GOLD Daily NT|GOLD Daily NTGR|GOLD DAILY 6M NT|GOLD DAILY 6M YT|GOLD DAILY 6M NT GFR|GOLD Plus Daily YT|GOLD Plus Daily NT|OIL SILVER Weekly YT|OIL SILVER Weekly NT|GOLD Plus Daily 6M NT|GOLDPLUSDAY6M|OIL SILVER Weekly 6M NT|GOLDPLUSDAY1M|GOLDPLUSDAY1MYT|GOLDDAY6M|GOLDDAY1M|GOLDDAY1MYT|OILSILVERWEEK6M|OILSILVERWEEK1M|OILSILVERWEEK1MYT”]Existing short positions should still have stops just above 2.611. Each time price bounces up towards the blue trend line offers another opportunity to enter short. Profit target is still at 1.937.[/wlm_private]
US Oil (WTI Crude – Spot)
TECHNICAL ANALYSIS
Click chart to enlarge. Chart courtesy of StockCharts.com.
Elliott Wave Gold members were advised to enter short for US Oil on the 12th of April, at 53.11. Positions are now comfortably profitable and stops have been moved down to protect profits.
Analysis is now focused on managing short positions and determining when to take profit.
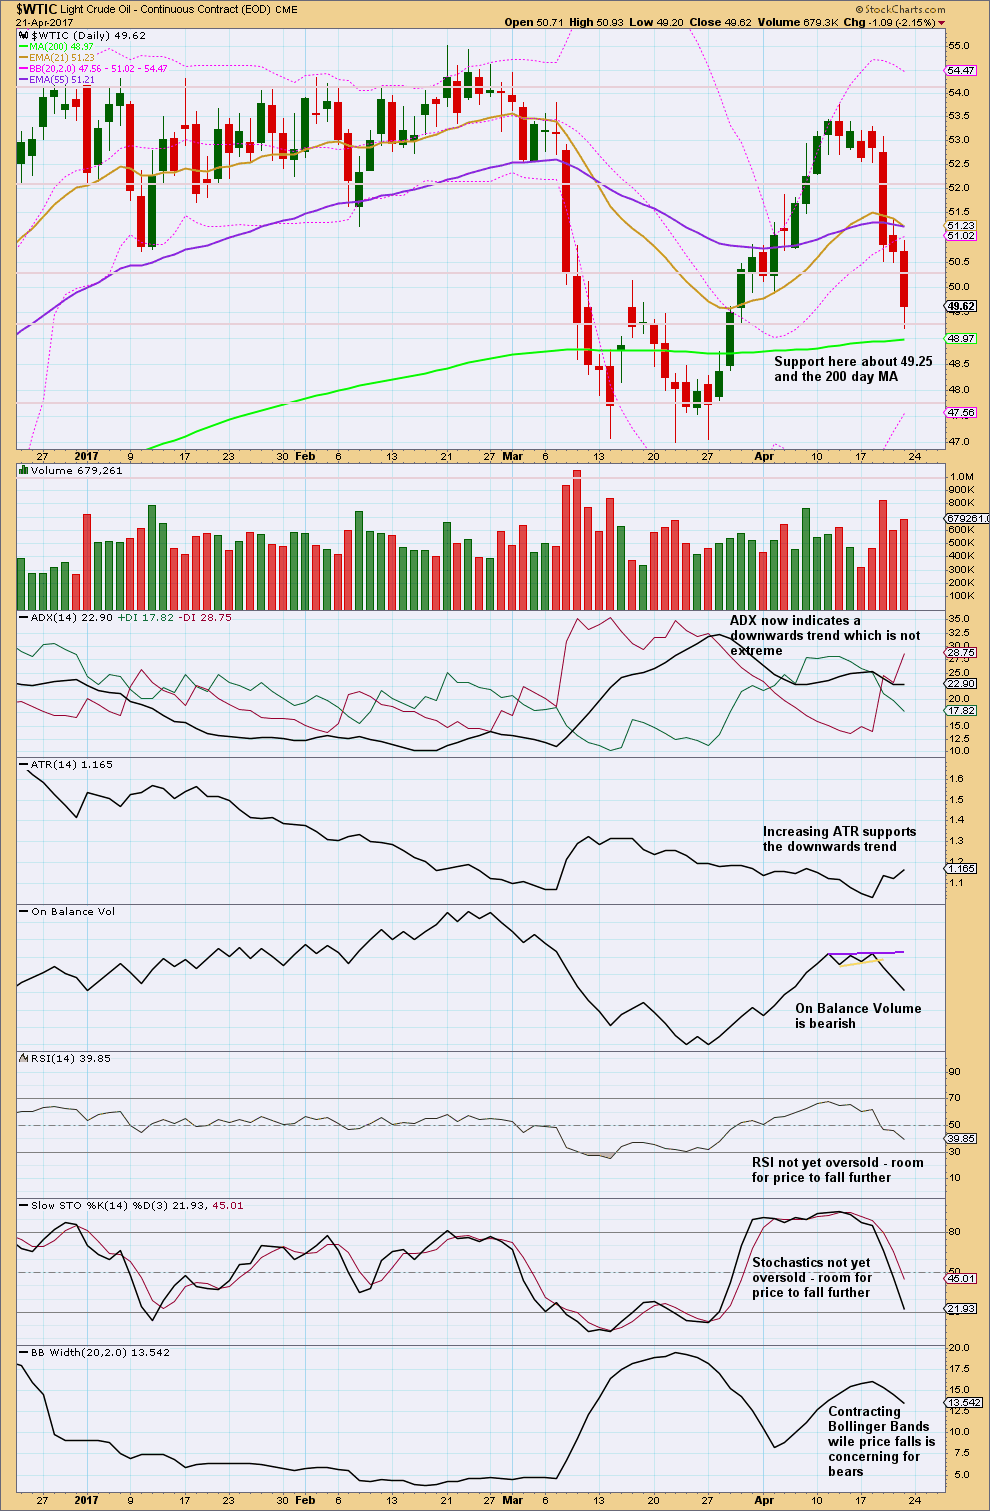
Downwards movement has some support from volume. ADX is bearish. ATR increasing supports the trend. On Balance Volume is very bearish.
With RSI and Stochastics not yet oversold, there is room for price to fall further.
US Oil can close outside the extreme range of Bollinger Bands for several days in row when it has a strong trend. With a close two days in a row below the lower edge of Bollinger Bands, this is not a concern.
ELLIOTT WAVE ANALYSIS
Click chart to enlarge.
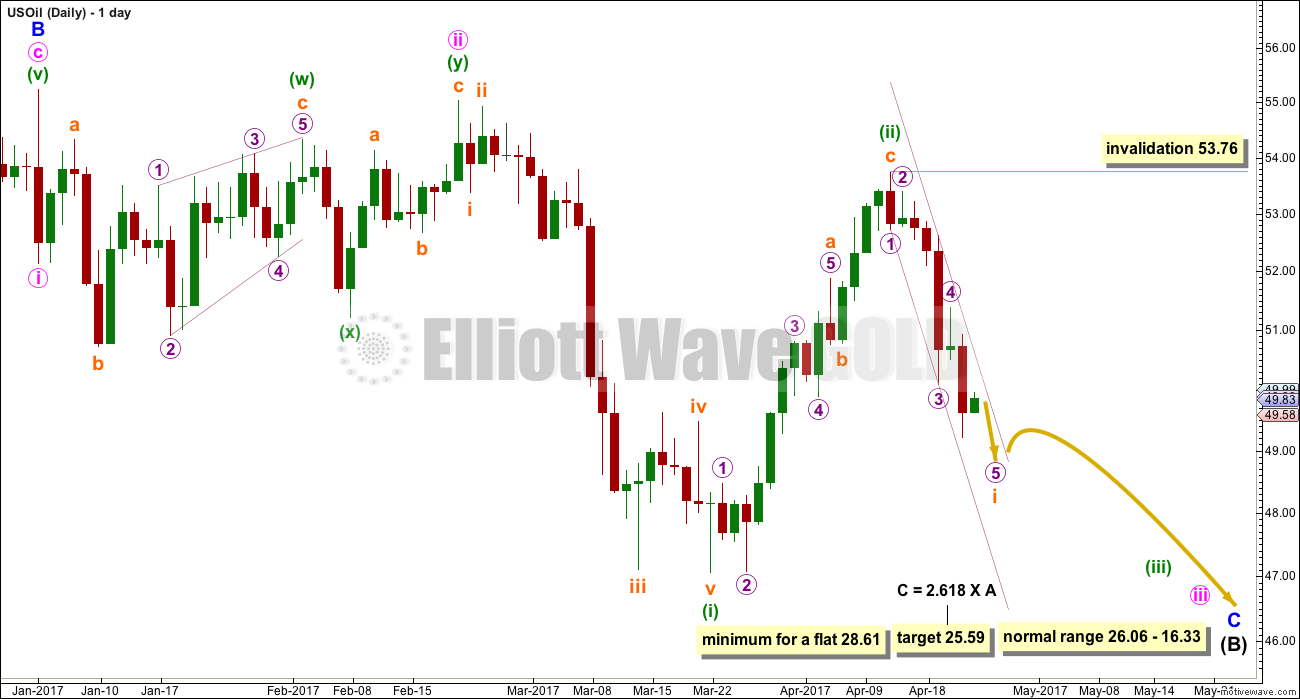
This third wave for minuette wave (iii) must move below the end of minuette wave (i) at 47.06, to meet the core Elliott wave rule, and it must move far enough below this point to allow room for a subsequent fourth wave to unfold and remain below first wave price territory.
Minor wave C must subdivide as a five wave impulse. It has begun with two deep and very time consuming second wave corrections for minute wave ii and minuette wave (ii). The upcoming fourth wave corrections for minuette wave (iv) and minute wave iv may be expected to be relatively shallow to meet the guideline of alternation.
A narrow best fit channel is added to recent downwards movement. An upcoming correction for subminuette wave ii may breach the channel. At this stage, with the power of a third wave pulling to the downside, subminuette wave ii may be expected to be relatively brief and shallow.
Trading advice for members only: [wlm_private “GOLD Daily YT|GOLD Daily NT|GOLD Daily NTGR|GOLD DAILY 6M NT|GOLD DAILY 6M YT|GOLD DAILY 6M NT GFR|GOLD Plus Daily YT|GOLD Plus Daily NT|OIL SILVER Weekly YT|OIL SILVER Weekly NT|GOLD Plus Daily 6M NT|GOLDPLUSDAY6M|OIL SILVER Weekly 6M NT|GOLDPLUSDAY1M|GOLDPLUSDAY1MYT|GOLDDAY6M|GOLDDAY1M|GOLDDAY1MYT|OILSILVERWEEK6M|OILSILVERWEEK1M|OILSILVERWEEK1MYT”]Use the best fit channel to place trailing stops, and adjust stops now daily. Today, pull stops down to just above 51 (add 3X your normal broker spread to this). This would ensure short positions are closed out if the upper edge of the channel is breached within the next 24 hours. Profit target remains at 28.61.[/wlm_private]
TRADING ROOM SUMMARY TABLES
OPEN POSITIONS
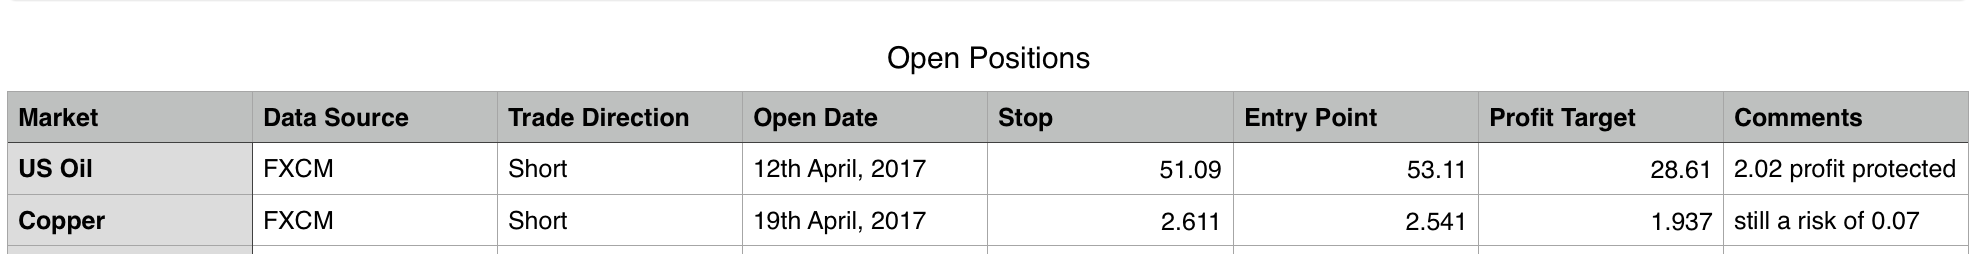
Click table to enlarge.
Trading advice for gold given to Elliott Wave Gold members will be included in Trading Room summary tables. However, so that it remains private for Elliott Wave Gold members only, it will not be included in Trading Room posts.
CLOSED POSITIONS
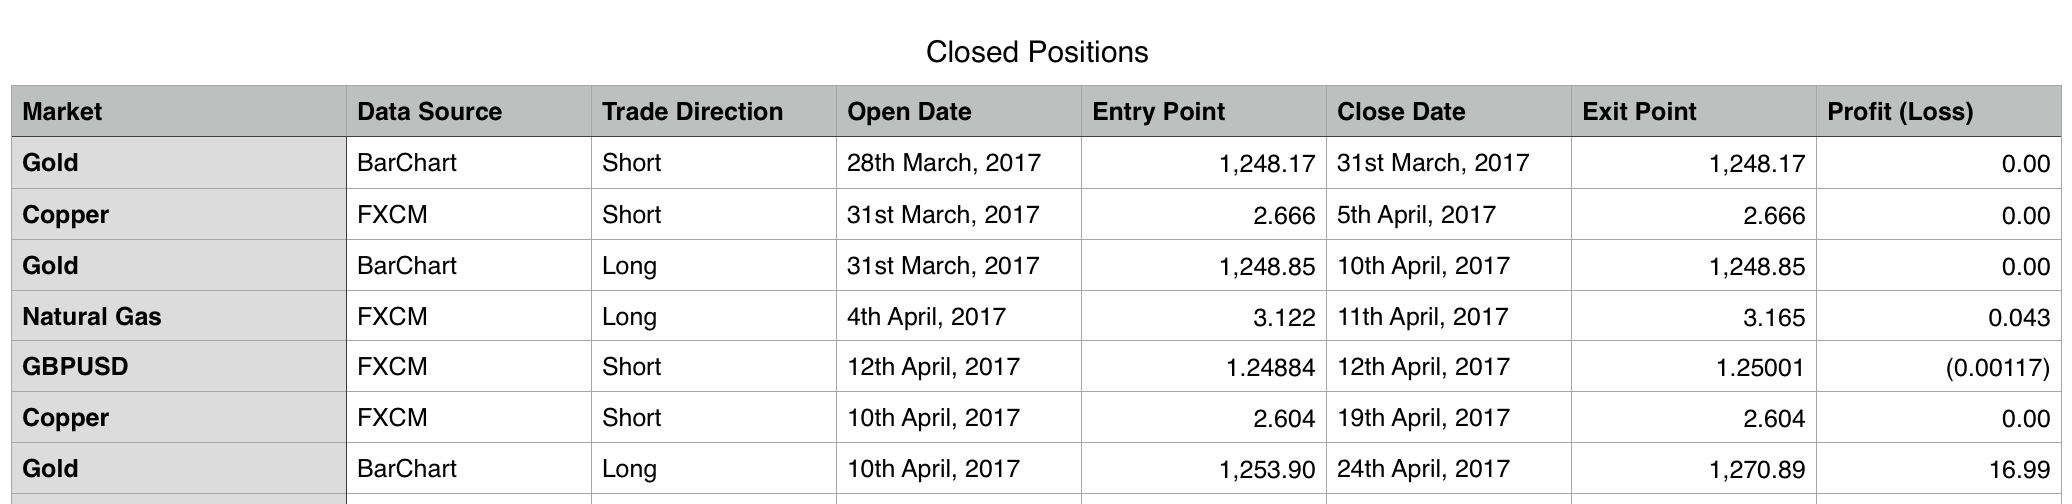
Click table to enlarge.
Each month a new “closed positions” table will begin. To see all closed positions for March 2017 see the last Trading Room post for March here.
RECOMMENDATIONS
[wlm_private “GOLD Daily YT|GOLD Daily NT|GOLD Daily NTGR|GOLD DAILY 6M NT|GOLD DAILY 6M YT|GOLD DAILY 6M NT GFR|GOLD Plus Daily YT|GOLD Plus Daily NT|OIL SILVER Weekly YT|OIL SILVER Weekly NT|GOLD Plus Daily 6M NT|GOLDPLUSDAY6M|OIL SILVER Weekly 6M NT|GOLDPLUSDAY1M|GOLDPLUSDAY1MYT|GOLDDAY6M|GOLDDAY1M|GOLDDAY1MYT|OILSILVERWEEK6M|OILSILVERWEEK1M|OILSILVERWEEK1MYT”]
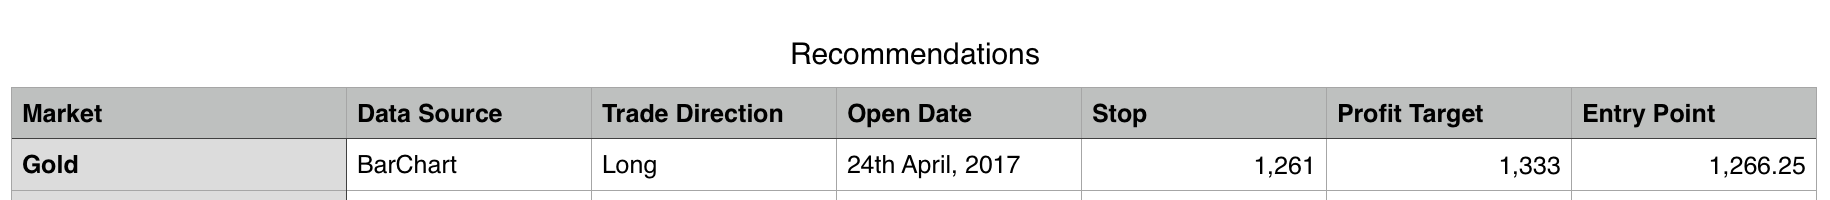
Click table to enlarge.[/wlm_private]
DISCLAIMER
As always, it is essential that anyone using this analysis for trading advice manages risk carefully. Follow my two Golden Rules:
1. Always use a stop.
2. Never invest more than 1-5% of equity on any one trade.
Trading is about probabilities, not certainties. Failure to follow my two Golden Rules of trading indicates failure to manage risk.
Accept that this analysis may be wrong. It is impossible for any analyst to predict with certainty what a market will do next.
The technical problem with comments encountered last week has now been fixed. Members should log into the website then click on the title of this post to see comments.
Trading advice will be updated throughout the week for Elliott Wave Gold members only in this comments section.
This analysis is published @ 10:00 p.m. EST.
[Note: Member comments and discussion will remain private.]
US Oil hourly chart updated (this will be posted also in the latest US Oil analysis):
Subminuette ii doesn’t look complete now, the last wave down won’t fit as a five but will fit as a three.
Subminuette ii may be continuing further as an expanded flat correction, very common structures.
Great analysis on copper so far. I’m still holding on my position, opened when copper was at 3.68. And yes, this is a great area to add to shorts or enter short. Looking forward to the next move down…
looking to add to copper shorts this week
The small real bodies and long upper wicks on the last two daily candlesticks (so far, the second isn’t closed yet) look bearish. This looks like a good time to go short.