
Bitcoin has recently seen strong upwards movement along with increasing news coverage. A blowoff top may again be approaching. Will this herald just another interruption to Bitcoin’s upwards trend? Or could it be the end of this meteoric rise and the beginning of a larger fall?
All charts are on a semi-log scale.
FORTNIGHTLY CHART
Click chart to enlarge.
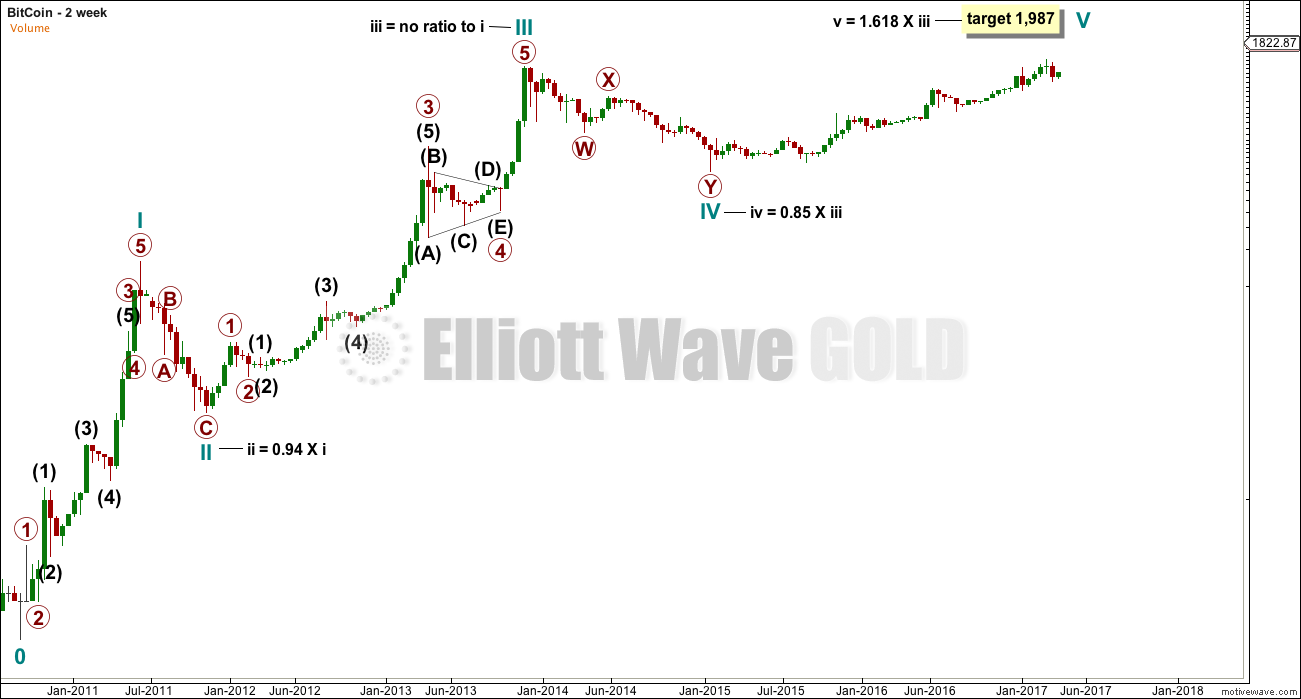
The data for this wave count begins from June 2010.
What looks like a five wave impulse may be completing. With no Fibonacci ratio between cycle waves III and I, it may be more likely that cycle wave V will exhibit a Fibonacci ratio to either of III or I.
This movement does not fit well at all into a channel.
I have taken some time to look at the waves which now in hindsight are obviously complete, particularly the waves within cycle wave III. I have noticed some tendencies of this market:
– Bitcoin behaves like an extreme commodity. Its impulses have a curved look with slower second waves, quick fourth waves, and strong sharp fifth wave extensions. This tendency shows up in bullish and bearish waves.
– Third waves are much longer than first waves, and fifth waves are longer still. Again, this is an extreme version of typical commodity behaviour.
– The middle of its third waves may exhibit Fibonacci ratios within them, but overall it does not regularly exhibit good Fibonacci ratios. This would make target calculation particularly difficult.
– Candlestick reversal patterns are common at the end of Bitcoin’s strong fifth waves. These are engulfing patterns or star patterns with very long wicks on the final candlestick.
– Early second wave corrections are extremely deep, close to 0.8 and often deeper than 0.9 the depth of the prior first wave.
WEEKLY CHART
Click chart to enlarge.
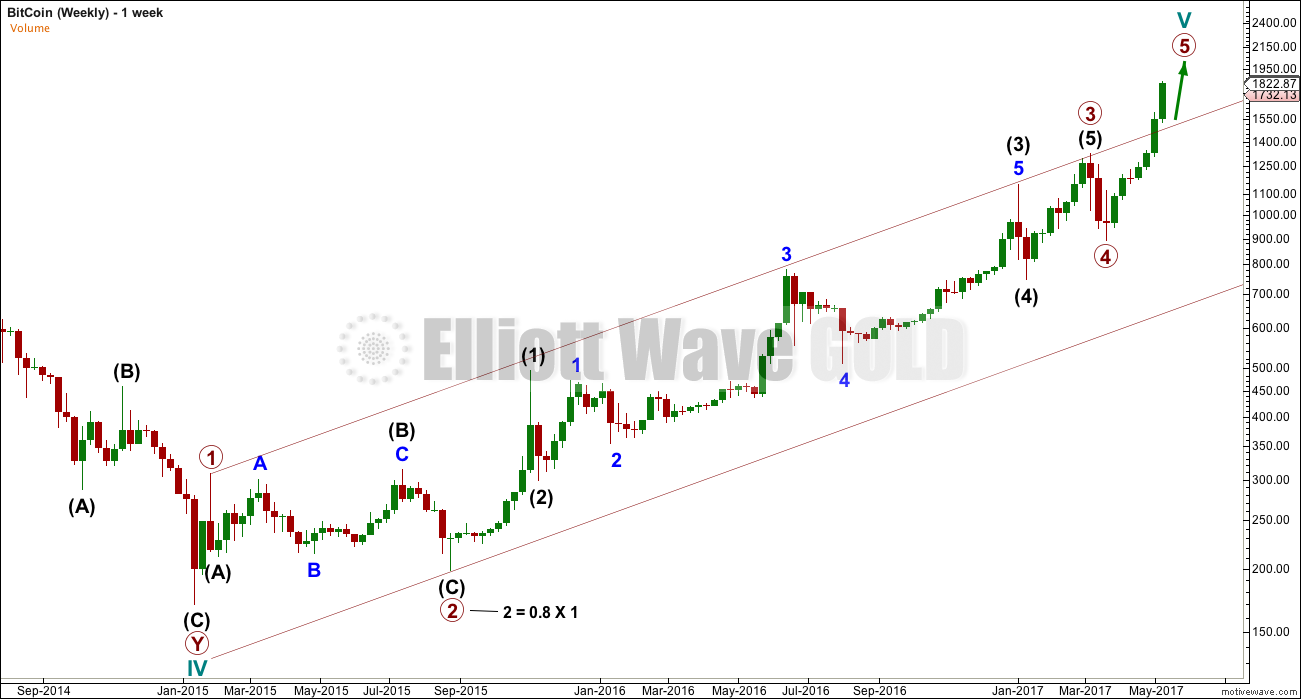
The weekly chart looks at the possible structure of cycle wave V, the final fifth wave.
There are multiple ways to label this upwards movement. This is only one.
DAILY CHART
Click chart to enlarge.
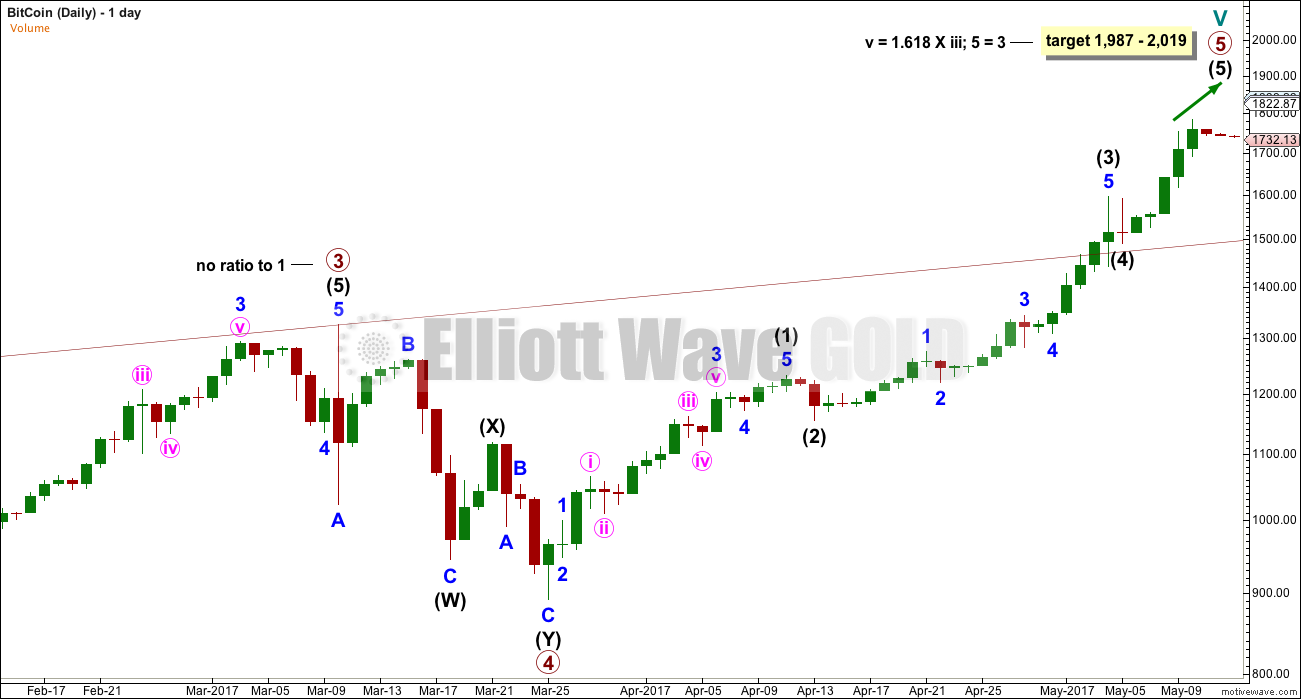
This daily chart looks at the final fifth wave of primary wave 5. Again, there are multiple ways to label this movement and this is only one of them.
What cannot yet be seen is a candlestick reversal pattern at the high.
A target is calculated at two degrees, which is a zone of only 32 bits. While this target looks reasonable, it must be acknowledged that given observed behaviour of this market it may well be too low if it is wrong.
The bigger picture expects that Bitcoin may soon end its meteoric rise and turn to begin a very sharp and deep fall. When cycle wave V ends, it would complete one impulse up. Given this market’s tendency to very deep early second wave corrections, the resulting fall may be as deep as 0.9 of the prior rise.
I will be following this market daily now to pinpoint when may be best to sell Bitcoins.
Thereafter, I will follow the big second wave correction to its completion in order to pinpoint when will be the best time to buy Bitcoins again.
This analysis is published @ 07:16 p.m. EST.
[Note: Analysis is public today for promotional purposes. Member comments and discussion will remain private.]
There is an etf for Bitcoin. Symbol GBTC.
If you are not tech savvy than this is the alternative way to benefit from Bitcoin trades.
Thanks Lara for the update.
I will be following this analysis going forward.
For non geek person like me Is it possible to have white paper on Bitcoin covering what is this market, available exchanges , wallets ect.
I have a Multibit wallet and in there is 0.001 coin. LOL!!!
Because of tech complexity I could not buy bit cooins when it was below $USD 100.
Thanks again.
Unfortunately there is no single exchange that has bitcoin pricing going back to its birth in 2009. I created this crude image from Mt Gox and Bitstamp data scaled to fit as best as I could. It looks to me that there is a clear 5 wave count up to the 2013 high and then price broke down during 2014 out of that channel. That would make 2013 the cycle high and Jan 2015 wave II low. What do you think?
The peak on your left hand chart is the end of my cycle wave I.
When I look at this data on my chart it looks like a five up is incomplete.
The end of your data looks like where I have cycle wave IV? And I can’t see cycle wave V on your data?
look forward to shorting Bitcoins and your entry point. Feel as though Bitcoin along with commodities will all fall hard (oil, gold, bitcoin, copper). Do I hear deflation??
If you can figure out how to short Bitcoin please let us know!
How do you short Bitcoins??? Let us know.
Thanks.
First, thanks Lara for the Bitcoin chart and analysis. I had asked for it several months ago and I thought you had forgotten about it. Second, the following exchange offers shorting through its exchange via the margin account. I have no experience with this exchange, but it may be the option short sellers are looking for: https://www.bitfinex.com/