
Upwards movement was expected for Monday to a target at 1,235 – 1,236. The high for Monday was 1,236.88.
Summary: A new high above 1,236.88 would indicate the short term upwards trend is still intact and the target would then be at 1,245. In the short term, a new low below 1,225.56 would indicate price may continue lower to end somewhere within the range of 1,214.81 to 1,206.42.
New updates to this analysis are in bold.
Last historic analysis with monthly charts is here, video is here.
Grand SuperCycle analysis is here.
MAIN ELLIOTT WAVE COUNT
For clarity I have decided at this time it may be best to publish on a daily basis weekly charts I and II. Both charts expect a zigzag down to complete and the difference is in the expected depth.
WEEKLY CHART I
Click chart to enlarge.
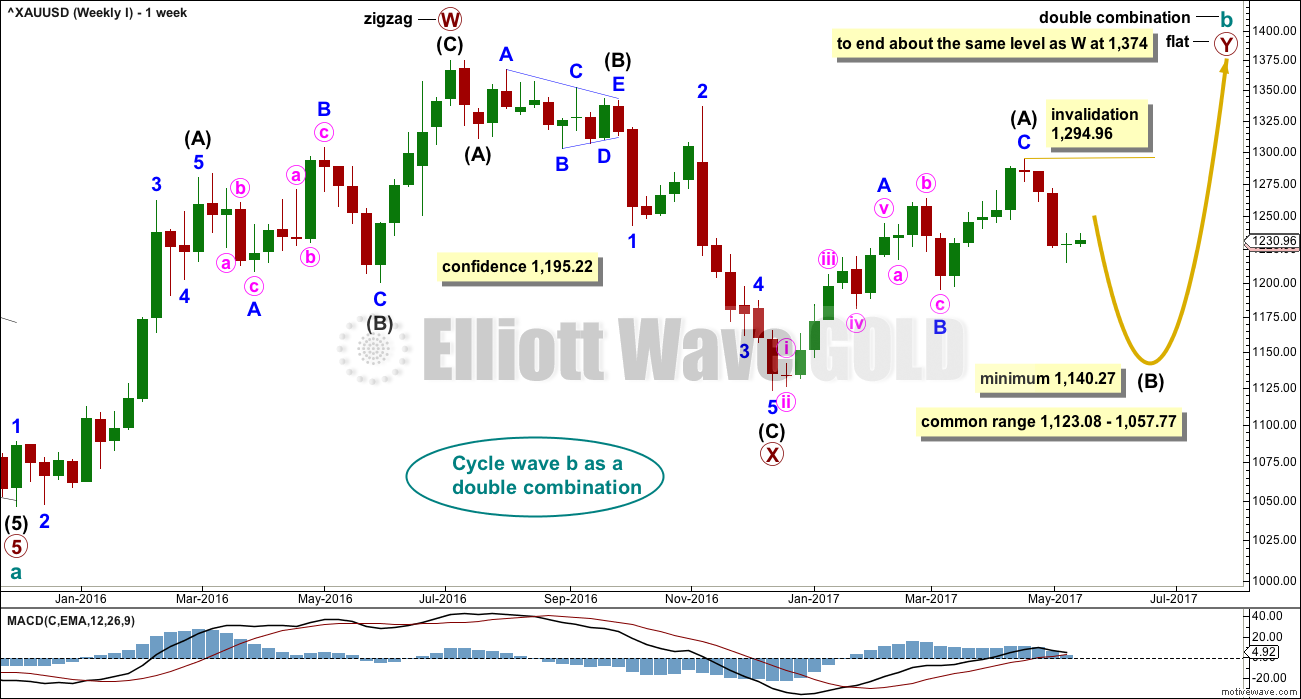
Combinations are very common structures. Cycle degree waves normally last one to several years, and B waves do tend to be more time consuming waves than all other waves. Given these tendencies the most likely scenario at this point may be that cycle wave b is an incomplete double combination.
The first structure in the double labelled primary wave W fits as a zigzag. This upwards movement will subdivide as either a three (zigzag) or a five (impulse). It does have a three wave look to it.
The double is joined by a deep three in the opposite direction labelled primary wave X, which is a 0.77 depth of primary wave W. X waves within double combinations are normally very deep; this one looks right.
The second structure in the combination may be either a triangle or a flat correction. Both of these structures have A waves which subdivide as threes.
At this stage, the upwards wave from the low in December 2016 does now look best and subdivide best as a completed zigzag. This may be intermediate wave (A) of a flat correction or a triangle. Because a triangle for primary wave Y would look essentially the same as the second weekly chart below, only a flat correction is considered here. The most common two structures in a double combination are a zigzag and a flat.
This wave count follows the most common scenario and has the best fit.
Within the flat correction of primary wave Y, intermediate wave (B) must retrace a minimum 0.9 length of intermediate wave (A) at 1,140.27. The most common length for intermediate wave (B) is from 1 to 1.38 times the length of intermediate wave (A), giving a common range from 1,123.08 to 1,057.77.
Intermediate wave (B) may subdivide as any corrective structure, but the most common structure for B waves within flats is a zigzag. At this stage, on the hourly chart it looks like a five down is now complete, which would indicate intermediate wave (B) is a zigzag subdividing 5-3-5.
The daily and hourly charts will follow this weekly chart. That does not mean the other two weekly charts aren’t possible, they are, but the number of charts must be kept reasonable on a daily basis.
WEEKLY CHART II
Click chart to enlarge.
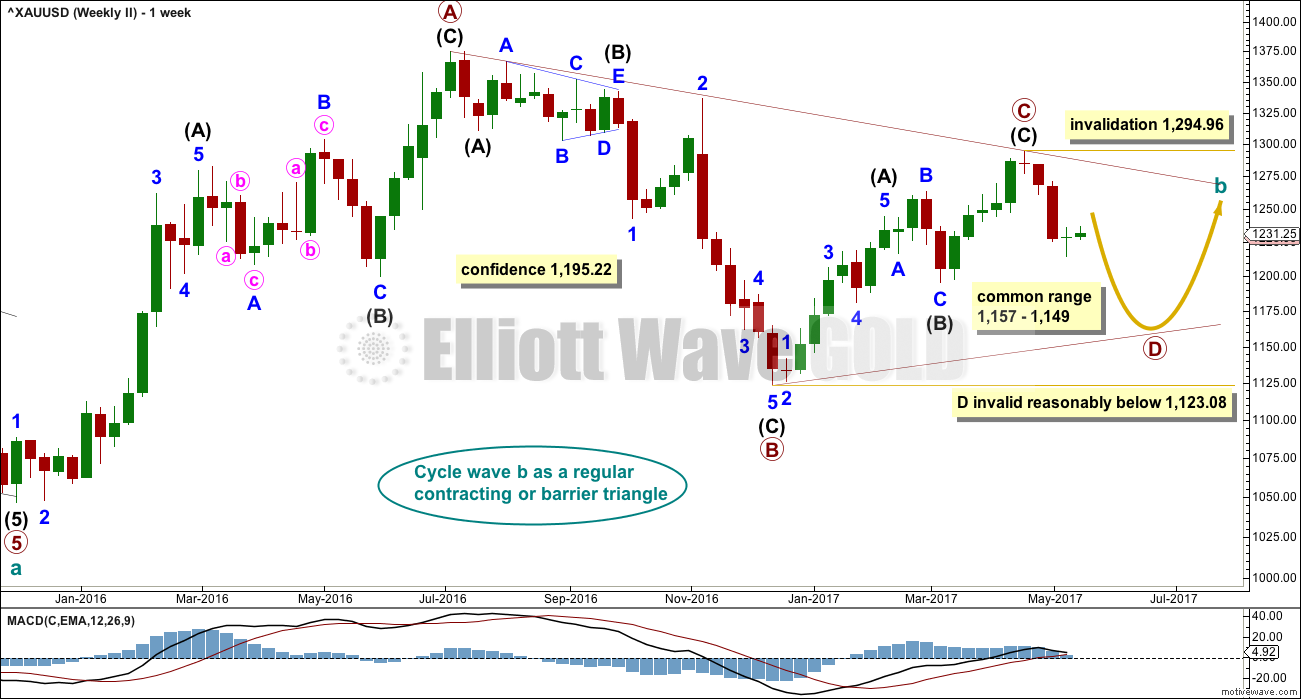
What if cycle wave b is a triangle? This is also entirely possible. Triangles are not as common as double combinations, but they are not uncommon.
Within the triangle, primary waves A, B and C are all single zigzags. One of the five subwaves of a triangle normally subdivides as a more complicated multiple, usually a double zigzag. This may be what is unfolding for primary wave D.
Primary wave D of a regular contracting triangle may not move beyond the end of primary wave B below 1,123.08.
Primary wave D of a regular barrier triangle should end about the same level as primary wave B at 1,123.08, so that the B-D trend line is essentially flat. What this means in practice is that primary wave D may end slightly below 1,123.08 and the triangle would remain valid. This is the only Elliott wave rule which is not black and white.
Thereafter, primary wave E should unfold upwards and would most likely fall a little short of the A-C trend line. If not ending there, it may overshoot the A-C trend line.
DAILY CHART
Click chart to enlarge.
This daily chart will suffice for both weekly charts above, although the labelling follows weekly chart I.
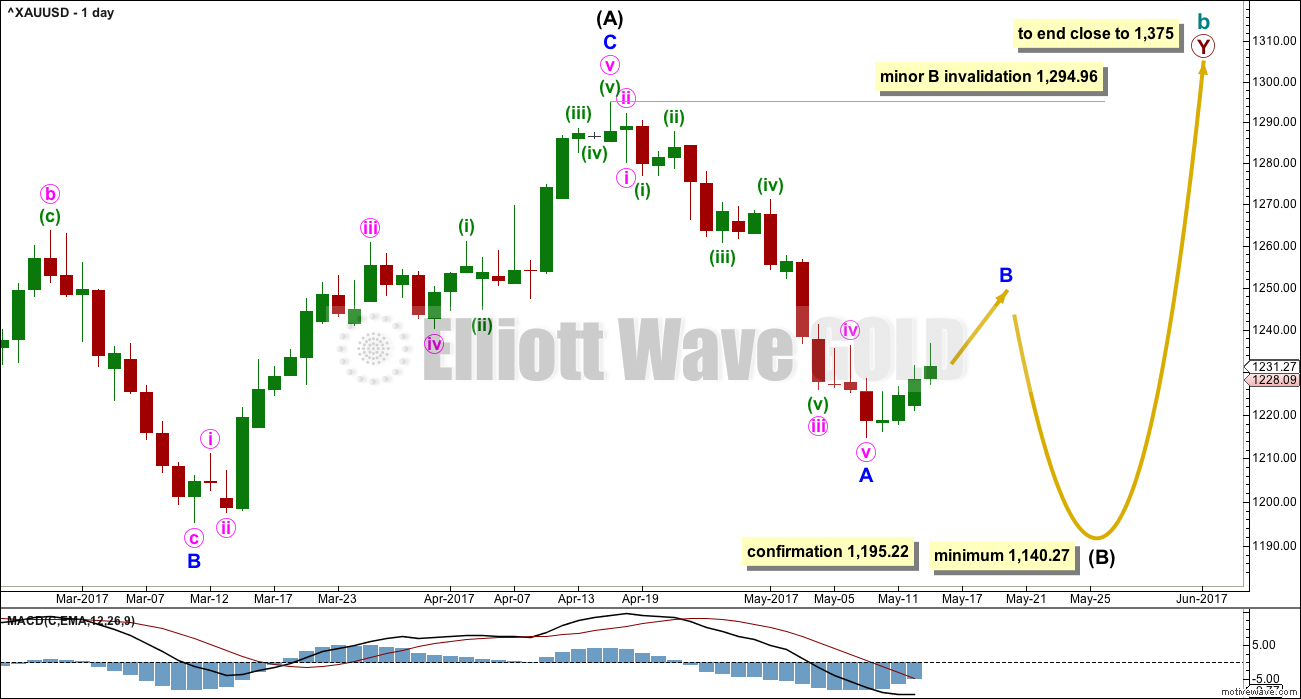
Both weekly charts expect a zigzag downwards. Weekly chart I expects a deep zigzag for intermediate wave (B) to a minimum at 1,140.27. Weekly chart II expects a zigzag down for primary wave D to not move below 1,123.08 and most likely fall well short of that point.
The daily chart follows the expectations for weekly chart I, but the structure for weekly chart II would be exactly the same.
Within the flat correction of primary wave Y, intermediate wave (B) must retrace a minimum 0.9 length of intermediate wave (A) at 1,140.27. The most likely corrective structures to achieve the deep correction required for B waves within flats are single or multiple zigzags. These begin with a five, then a three in the opposite direction. A five down for minor wave A is now complete. Minor wave B has begun.
BarChart data shows a Morning Doji Star reversal pattern at the end of minor wave A. This pattern is not the strongest reversal pattern, but it is fairly reliable after a clear downwards trend. This indicates the downwards trend may end here and be followed by either sideways or upwards movement. Reversal patterns make no comment on how far nor how long the next trend may last.
Minor wave B may be deep but may not move beyond the start of minor wave A above 1,294.96.
B waves exhibit the greatest variety in form and behaviour of all waves. They can be quick sharp zigzags or complicated time consuming combinations. There are more than 23 possible corrective Elliott wave structures that B waves may take, and at their start it is impossible to tell which structure may unfold. B waves do not normally present good trading opportunities; they can be time consuming consolidations with strong whipsaws. However, minor degree B waves may present some opportunity, so it is essential when they unfold that risk is managed diligently. The risk of losses is greater during consolidations than during trending markets.
When minor waves A and B are complete, then a target may be calculated for minor wave C downwards to end the zigzag of intermediate wave (B), using the Fibonacci ratio between minor waves A and C. That cannot be done yet.
HOURLY CHART
Click chart to enlarge.
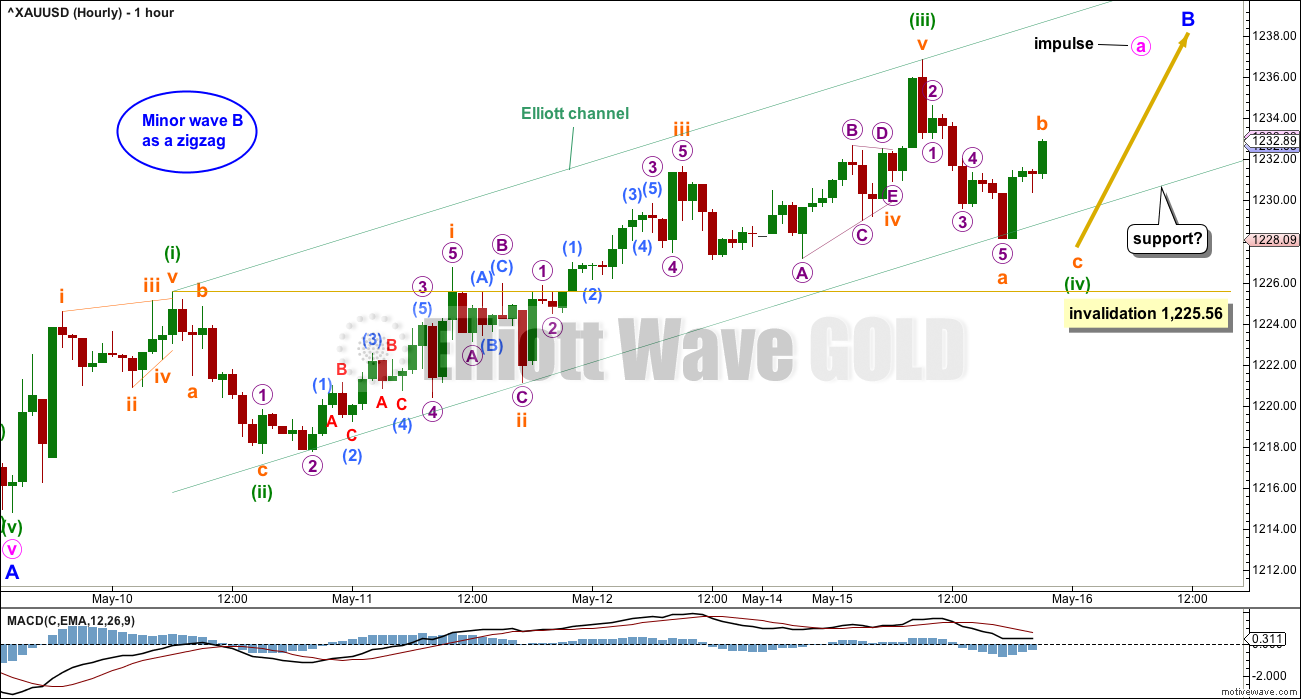
If minor wave B is a zigzag, then within it minute wave a must subdivide as a five wave structure. So far minute wave a may be unfolding as an impulse.
Within the impulse, minuette wave (iv) may not move into minuette wave (i) price territory below 1,225.56.
When minuette wave (iv) is complete, then a target may be calculated for minuette wave (v). Minuette wave (v) would most likely be equal in length with minuette wave (i), which was 10.79.
Minute wave a may end close to the 0.382 Fibonacci ratio at 1,245.
If minute wave a continues higher as an impulse, then when it is complete the following correction for minute wave b may not move beyond the start of minute wave a below 1,214.81.
ALTERNATE HOURLY CHART
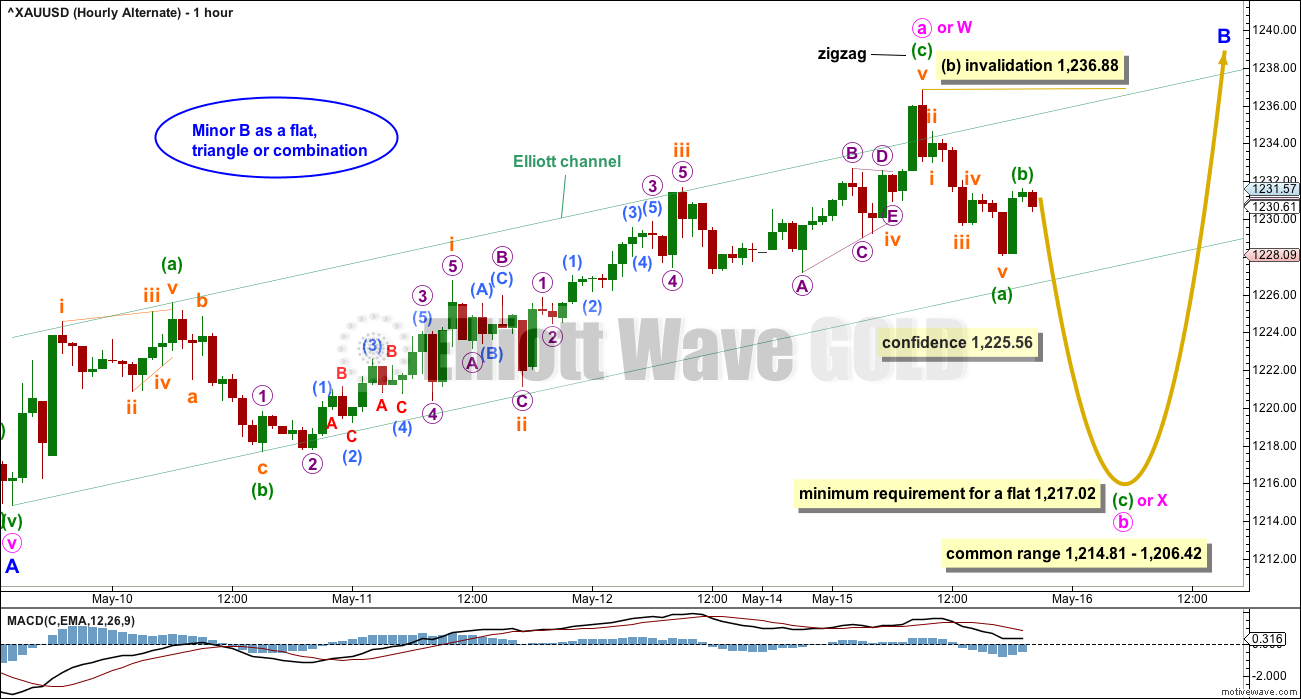
Click chart to enlarge.
Although this is labelled an alternate wave count, the probability of both hourly wave counts is close to even.
Minute wave a may be unfolding as a zigzag, which is classified as a three. When A waves subdivide as threes, then the larger correction is indicated as a flat or triangle.
The zigzag upwards may also be labelled minute wave w; minor wave B may be unfolding as a double combination or double zigzag. The first zigzag in the double may be complete.
A new low below 1,225.56 would invalidate the first hourly wave count and confirm this alternate.
If that happens, then there are still multiple possibilities for minor wave B: it may be a flat, combination, double zigzag or triangle. Alternate wave counts would still be required.
Within flats, triangles and double combinations, minute wave b (or x in the case of a combination) may make a new price extreme beyond the start of minute wave a (or w) below 1,214.81. The minimum requirement for minute wave b within a flat is 0.9 the length of minute wave a. There is no minimum for minute wave x within a combination, and they too may make new price extremes beyond the start of wave W.
If price makes a new low below 1,225.56, before making a new high, then minor wave B would be expected to most likely be a large choppy sideways movement. It may also be a double zigzag which would be a sharp deep correction.
TECHNICAL ANALYSIS
WEEKLY CHART
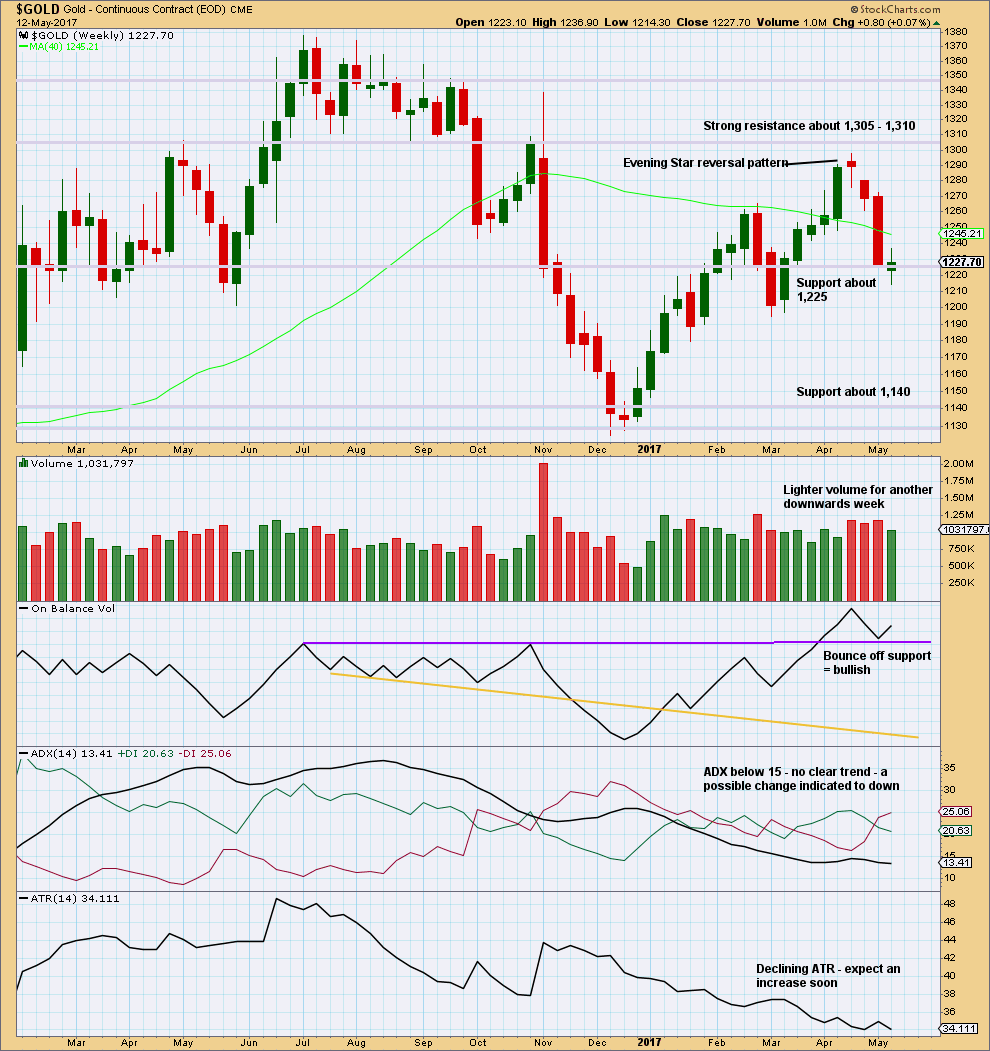
Click chart to enlarge. Chart courtesy of StockCharts.com.
Another downwards week closes green with a small real body. This is a spinning top candlestick that shifts the trend from down to neutral.
The balance of volume is upwards and shows a decline. Upwards movement may be a counter trend movement if it does not have support from volume.
The bullish signal from On Balance Volume suggests this week may see upwards movement.
DAILY CHART
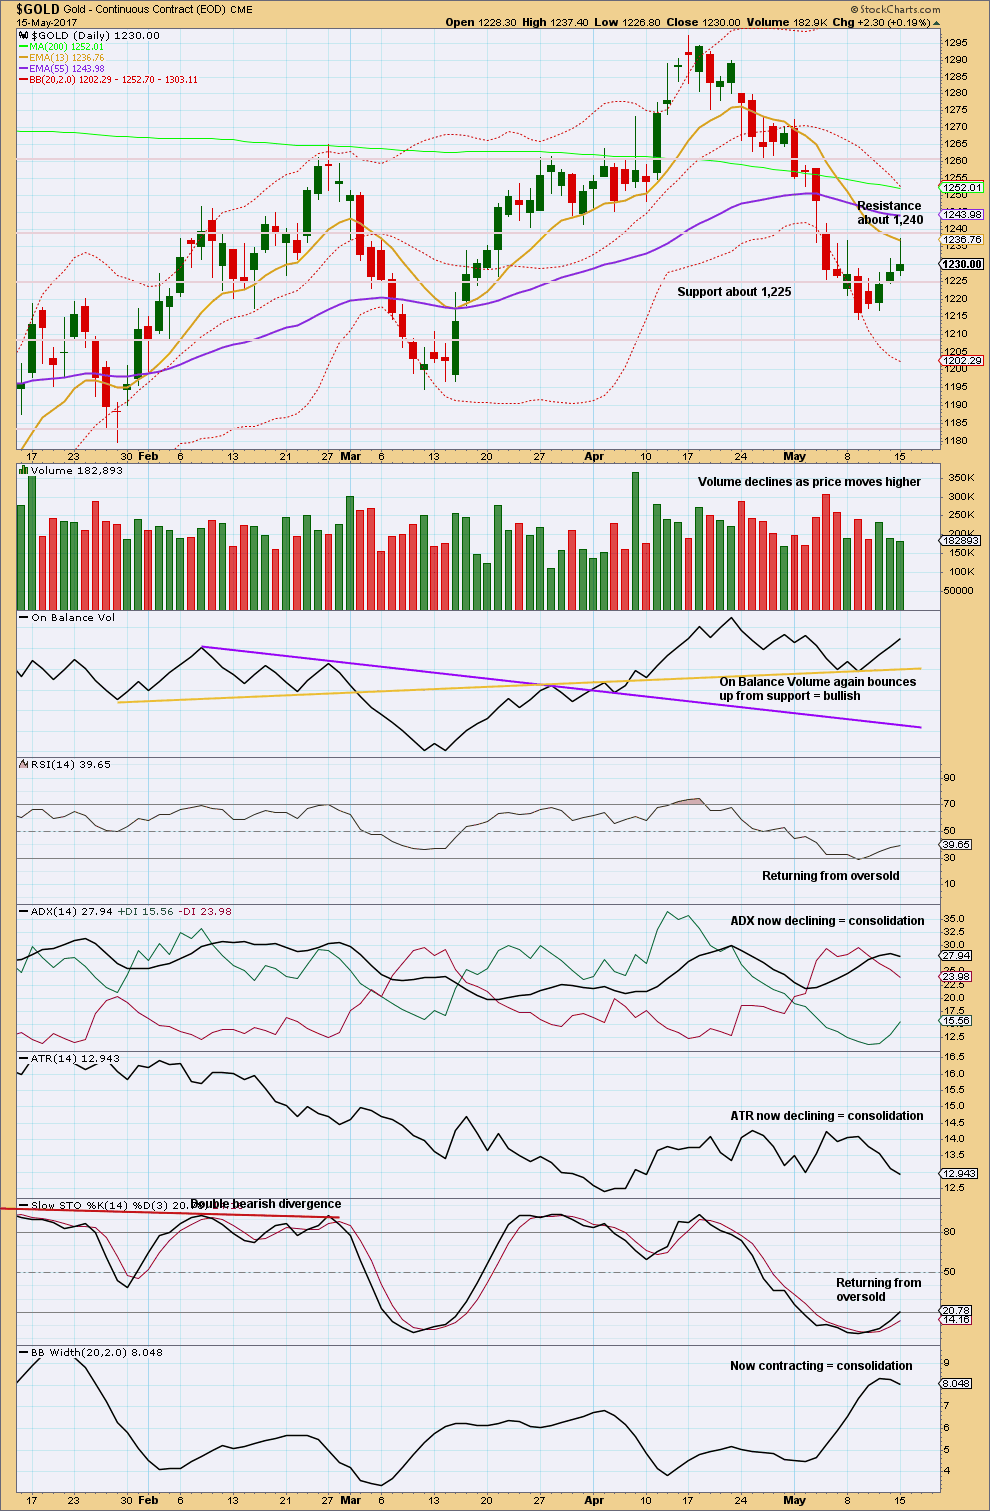
Click chart to enlarge. Chart courtesy of StockCharts.com.
Volume does not support the rise in price. This looks like a counter trend bounce, not the start of a new trend. The long upper wicks on the last two daily candlesticks indicate strong resistance to upwards movement.
Price may today have found resistance about 1,240 and the Fibonacci 13 day moving average.
GDX
DAILY CHART
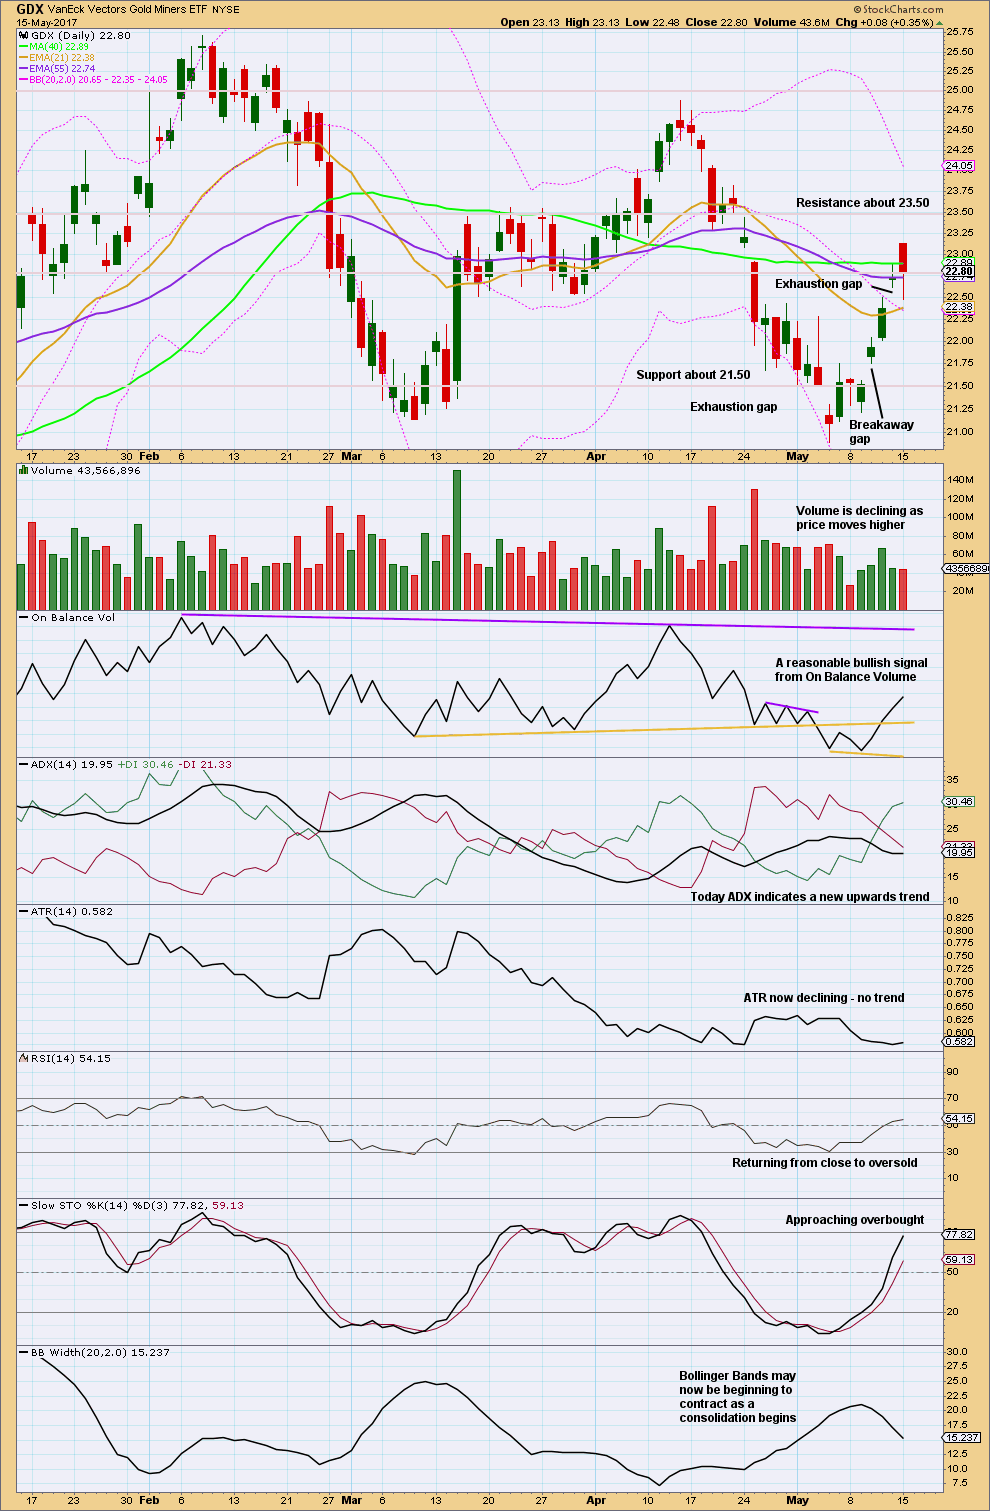
Click chart to enlarge. Chart courtesy of StockCharts.com.
The last gap is now closed by the lower wick of today’s candlestick. This changes it from a possible measuring gap to an exhaustion gap. Expect GDX to now move sideways or possibly change trend to down.
Volume is not supporting the rise in price.
The strong red real body of today’s candlestick is bearish, but the long lower wick is bullish.
The new upwards trend does not have support from volume, has weaker range, and lacks volatility. This looks like a counter trend bounce and not the start of a new sustainable upwards trend.
This analysis is published @ 09:27 p.m. EST.
Since alt hourly wave count is invalidated gold has only one wave count which is minor wave b as zz.
What is the target of minor b?
Or does gold a new hourly wave count?
imo minor b zz with 1235 holding (downside risk 1231-30) will likely labor to tap out 1242-43; with 4-hourly RSI is hovering towards 70 and 4hr/8hr stoch rsi both in overbought territory, very tempting to set up shorts in 1242-1250 range lol….
Minute a may be complete now.
Minor B may end about the 0.618 Fibonacci ratio. But only when minute b is complete can I calculate a target.
I’m just thinking outside the box. Does anyone have a wave count that the most recent low at 1123.08 is all she wrote, and that we are in an impulsive bullish 5-wave up. This does mean that 1214.81 is wave 2 in this count: 1123.08 – 1294.96 – 1214.81.
If you can remember the time we were at 1123.08, analysts were adamant that there was one more low to come. We all know it did not materialise; gold went on a merry 170+ spree. Perhaps this time is the same. All that gloom will come to nought?
I guess for Weekly I if you saw intermediate (B) over last week, and lasting only three weeks, that could be very bullish.
Gold feels very inverse to the S&P lately. And S&P giving off sell signals according to what i’m seeing. Tempted to exchange gold longs for S&P shorts, or just establish some S&P shorts. But I’ve mostly lost money shorting the market, so I’ll just stay long Gold.
PS – US Dollar looking awful (albeit with some momentum divergence so be careful), but has not as of yet lit a spark under gold
Damn I knew it lol. I shouldn’t have been scared to short. This could be the big one who knows. May be better than long gold but will see. Fireworks tonight and tomorrow. Oh and G-d help us all
Ichimoku 4-Hourly Analysis
Data as at 6:25 am ET today
=======================
Gold price is trading in a neutral zone inside the 4-hour cloud. The cloud is red indicating that the overall mood is still one of bearishness. It is not time for bullish exhilaration yet. With the tenkan-sen lying above the kijun-sen, price should still rise further but I foresee a lot of choppiness and volatility ahead. Until price manages to break free of the upper cloud boundary at 1242.645 (on the graph), this will be a period of consolidation. The upper cloud boundary being formidable resistance, together with the stiff 1245-1246 barrier, the chance of a breakthrough seems rather bleak. Unless there are some external factors that can strongly persuade investor sentiment, I seriously doubt that the 1242-1245 region can be surmounted. And that is what I have as the target for the ending of Minute A (in which minuette 5 = 0.618 * minuette 3).
Alan
Nice analysis using cloud.
Watch silver. Silver has broken the upper cloud resistance in 4 hour chart.
It is leading the PM sector.
Thanks Papudi.
It’s good to know that silver is in the lead. When the bull is beginning, silver usually lead the way, and it normally outperforms.
It ties up with your recent posts about the GSR being lowered.
Ichimoku Daily Analysis
Data as at the close of May 15
=========================
Gold price has rallied a bit yesterday, reaching the 1235 level, and hence within the cloud. With a bit of push, prices should reach the short-term resistance at the 1240-1242 level today followed by a test of the stiff resistance at 1245-1246. There is still the danger that prices can get rejected there. If so, prices could easily retreat to the 1215 level. A breakdown below there would almost undoubtedly send the market plummeting to 1200 or even below 1180.
GDX was quite active today, filling 2 gaps. After a gap up at the open, a move down filled the open gap from the last downtrend, then filled the gap from last Friday.
It appears that GDX just finished a wave 3 up or a C wave up. So another couple of corrective sideways to down days are likely in play. As long as price stays above 21.75, then I’ll go with the bullish count. This could be a 4th wave correction.
GDX price is coiling and getting very close to the APEX of the symmetrical triangle, so a big move may be coming soon in the next few weeks.
https://www.tradingview.com/x/9m2nYRbA/
Thanks Dreamer for your thoughts.
Although the miners have recovered quicker than gold, there are still many obstacles ahead before the light at the end of the sideways tunnel can shine through. I’m sure there are many of us patiently waiting for that to happen.
It appears that investors are somehow insensitised towards geopolitical news. The nefarious crap that Wall Street spouts has a greater gravity. People are still being suckered into the dying bull of stocks. Traditional safe haven assets like gold have been able only to eat off the crumbs.