
A new high above 1,236.88 indicated more upwards movement towards a target about 1,245. Price continued only slightly higher so far to reach 1,238.88.
Summary: Allow for price to continue higher towards 1,245 while it remains within the channels on the hourly charts. When price breaks below the lower edge of the channels, then expect a pullback or a sideways consolidation for a B wave within a B wave. This will not present a good trading opportunity, so it is a time to step aside and wait patiently.
New updates to this analysis are in bold.
Last historic analysis with monthly charts is here, video is here.
Grand SuperCycle analysis is here.
MAIN ELLIOTT WAVE COUNT
For clarity I have decided at this time it may be best to publish on a daily basis weekly charts I and II. Both charts expect a zigzag down to complete and the difference is in the expected depth.
WEEKLY CHART I
Click chart to enlarge.
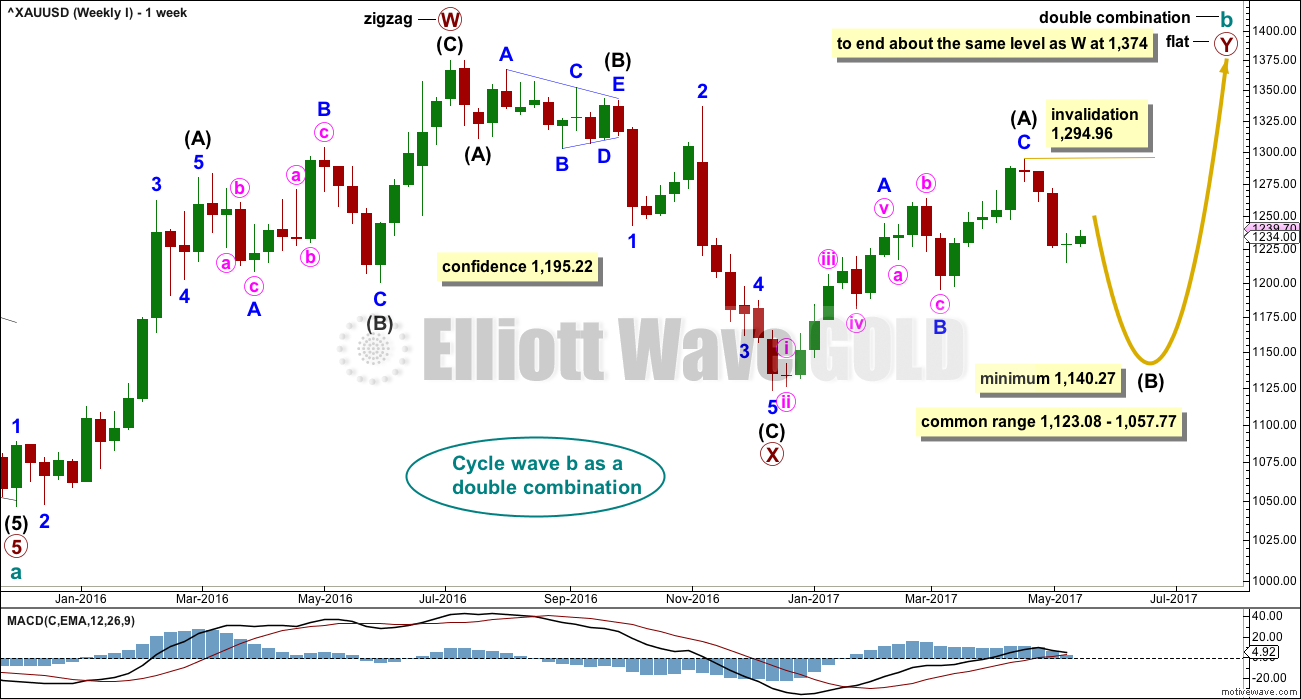
Combinations are very common structures. Cycle degree waves normally last one to several years, and B waves do tend to be more time consuming waves than all other waves. Given these tendencies the most likely scenario at this point may be that cycle wave b is an incomplete double combination.
The first structure in the double labelled primary wave W fits as a zigzag. This upwards movement will subdivide as either a three (zigzag) or a five (impulse). It does have a three wave look to it.
The double is joined by a deep three in the opposite direction labelled primary wave X, which is a 0.77 depth of primary wave W. X waves within double combinations are normally very deep; this one looks right.
The second structure in the combination may be either a triangle or a flat correction. Both of these structures have A waves which subdivide as threes.
At this stage, the upwards wave from the low in December 2016 does now look best and subdivide best as a completed zigzag. This may be intermediate wave (A) of a flat correction or a triangle. Because a triangle for primary wave Y would look essentially the same as the second weekly chart below, only a flat correction is considered here. The most common two structures in a double combination are a zigzag and a flat.
This wave count follows the most common scenario and has the best fit.
Within the flat correction of primary wave Y, intermediate wave (B) must retrace a minimum 0.9 length of intermediate wave (A) at 1,140.27. The most common length for intermediate wave (B) is from 1 to 1.38 times the length of intermediate wave (A), giving a common range from 1,123.08 to 1,057.77.
Intermediate wave (B) may subdivide as any corrective structure, but the most common structure for B waves within flats is a zigzag. At this stage, on the hourly chart it looks like a five down is now complete, which would indicate intermediate wave (B) is a zigzag subdividing 5-3-5.
The daily and hourly charts will follow this weekly chart. That does not mean the other two weekly charts aren’t possible, they are, but the number of charts must be kept reasonable on a daily basis.
WEEKLY CHART II
Click chart to enlarge.
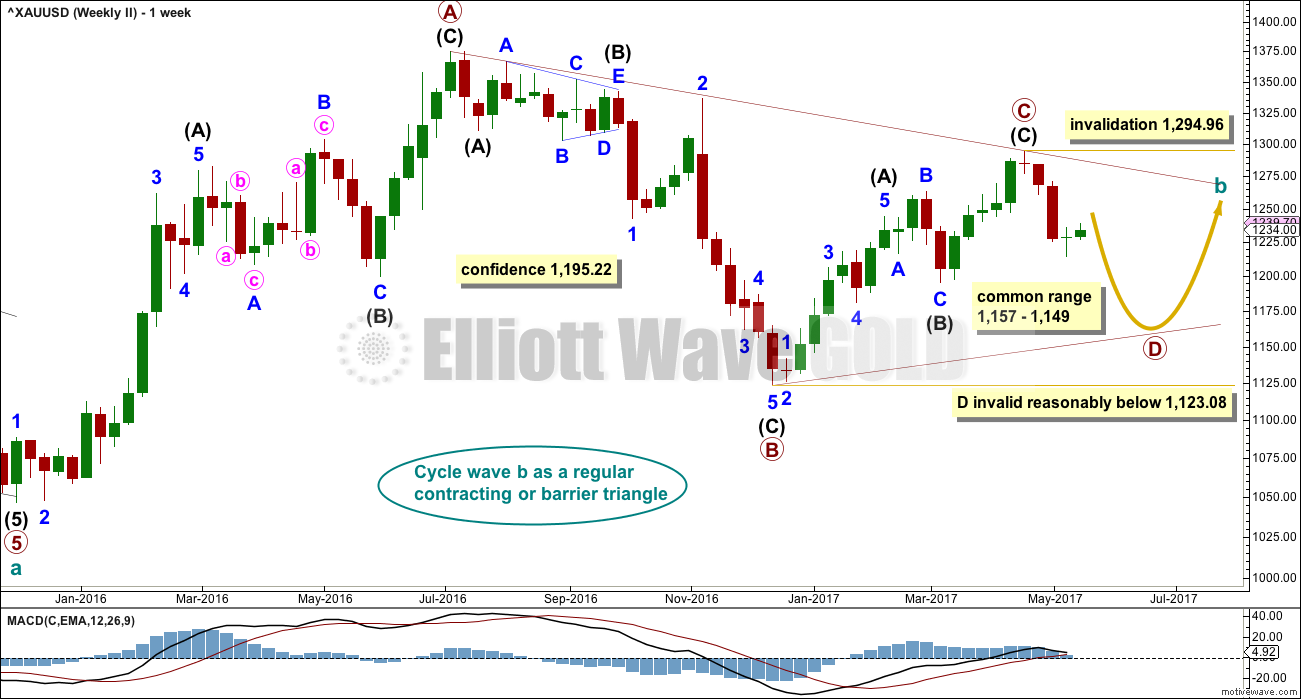
What if cycle wave b is a triangle? This is also entirely possible. Triangles are not as common as double combinations, but they are not uncommon.
Within the triangle, primary waves A, B and C are all single zigzags. One of the five subwaves of a triangle normally subdivides as a more complicated multiple, usually a double zigzag. This may be what is unfolding for primary wave D.
Primary wave D of a regular contracting triangle may not move beyond the end of primary wave B below 1,123.08.
Primary wave D of a regular barrier triangle should end about the same level as primary wave B at 1,123.08, so that the B-D trend line is essentially flat. What this means in practice is that primary wave D may end slightly below 1,123.08 and the triangle would remain valid. This is the only Elliott wave rule which is not black and white.
Thereafter, primary wave E should unfold upwards and would most likely fall a little short of the A-C trend line. If not ending there, it may overshoot the A-C trend line.
DAILY CHART
Click chart to enlarge.
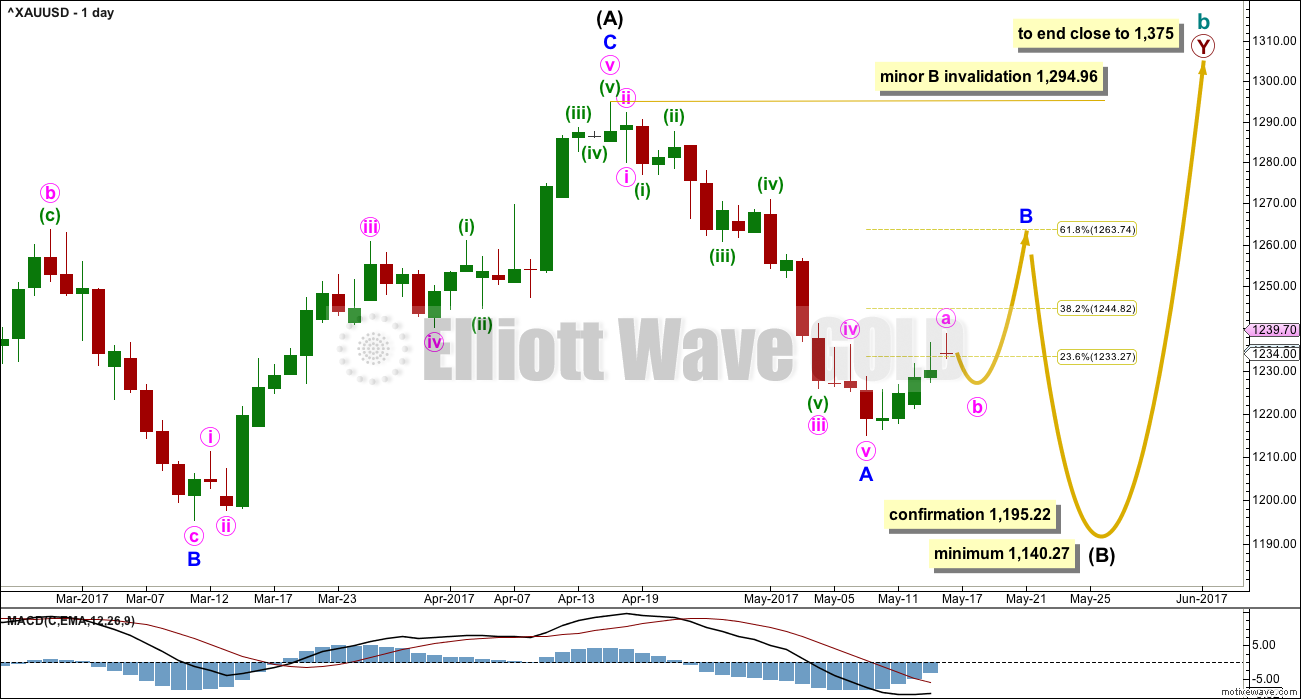
This daily chart will suffice for both weekly charts above, although the labelling follows weekly chart I.
Both weekly charts expect a zigzag downwards. Weekly chart I expects a deep zigzag for intermediate wave (B) to a minimum at 1,140.27. Weekly chart II expects a zigzag down for primary wave D to not move below 1,123.08 and most likely fall well short of that point.
The daily chart follows the expectations for weekly chart I, but the structure for weekly chart II would be exactly the same.
Within the flat correction of primary wave Y, intermediate wave (B) must retrace a minimum 0.9 length of intermediate wave (A) at 1,140.27. The most likely corrective structures to achieve the deep correction required for B waves within flats are single or multiple zigzags. These begin with a five, then a three in the opposite direction. A five down for minor wave A is now complete. Minor wave B has begun.
BarChart data shows a Morning Doji Star reversal pattern at the end of minor wave A. This pattern is not the strongest reversal pattern, but it is fairly reliable after a clear downwards trend. This indicates the downwards trend may end here and be followed by either sideways or upwards movement. Reversal patterns make no comment on how far nor how long the next trend may last.
Minor wave B may be deep but may not move beyond the start of minor wave A above 1,294.96.
B waves exhibit the greatest variety in form and behaviour of all waves. They can be quick sharp zigzags or complicated time consuming combinations. There are more than 23 possible corrective Elliott wave structures that B waves may take, and at their start it is impossible to tell which structure may unfold. B waves do not normally present good trading opportunities; they can be time consuming consolidations with strong whipsaws. However, minor degree B waves may present some opportunity, so it is essential when they unfold that risk is managed diligently. The risk of losses is greater during consolidations than during trending markets.
When minor waves A and B are complete, then a target may be calculated for minor wave C downwards to end the zigzag of intermediate wave (B), using the Fibonacci ratio between minor waves A and C. That cannot be done yet.
HOURLY CHART
Click chart to enlarge.
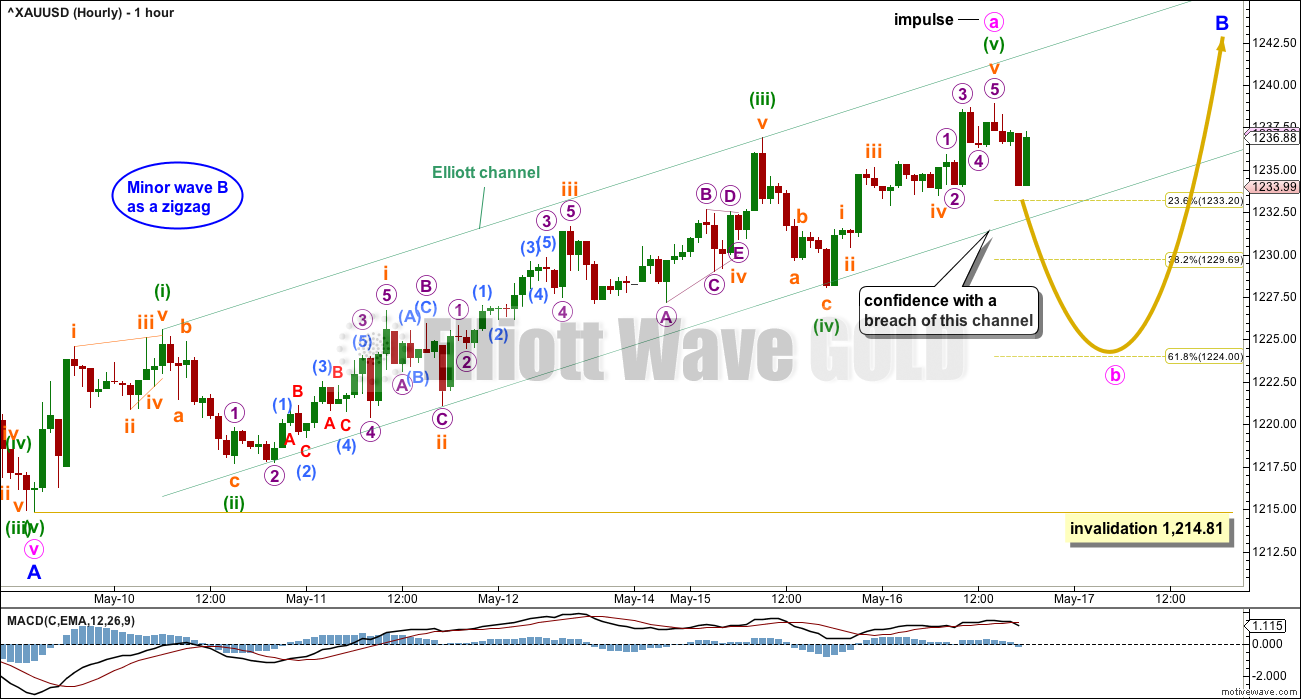
If minor wave B is a zigzag, then within it minute wave a must subdivide as a five wave structure. So far minute wave a may be unfolding as an impulse. Today, it is possible that it is complete. However, it is possible that minuette wave (v) may extend higher while price remains within the Elliott channel. The bottom line is now while price remains within the channel allow for the possibility of more upwards movement. Only have confidence that minute wave a is over when price breaks below the lower edge of the channel.
If minute wave a does continue higher, then it may end close to the 0.382 Fibonacci ratio of minor wave A at 1,245.
If minute wave a completes as an impulse, then the following correction for minute wave b may not move beyond its start below 1,214.81. Minute wave b may end about either the 0.382 or 0.618 Fibonacci ratios of minute wave a.
Minute wave b may be a complicated time consuming correction. B waves within B waves exhibit a huge variety in structure and behaviour. Minute wave b, when it arrives, does not present a trading opportunity, so this is a time to step aside and wait patiently for it to end. It is often the trades that you don’t take that make a difference to your account.
ALTERNATE HOURLY CHART
Click chart to enlarge.
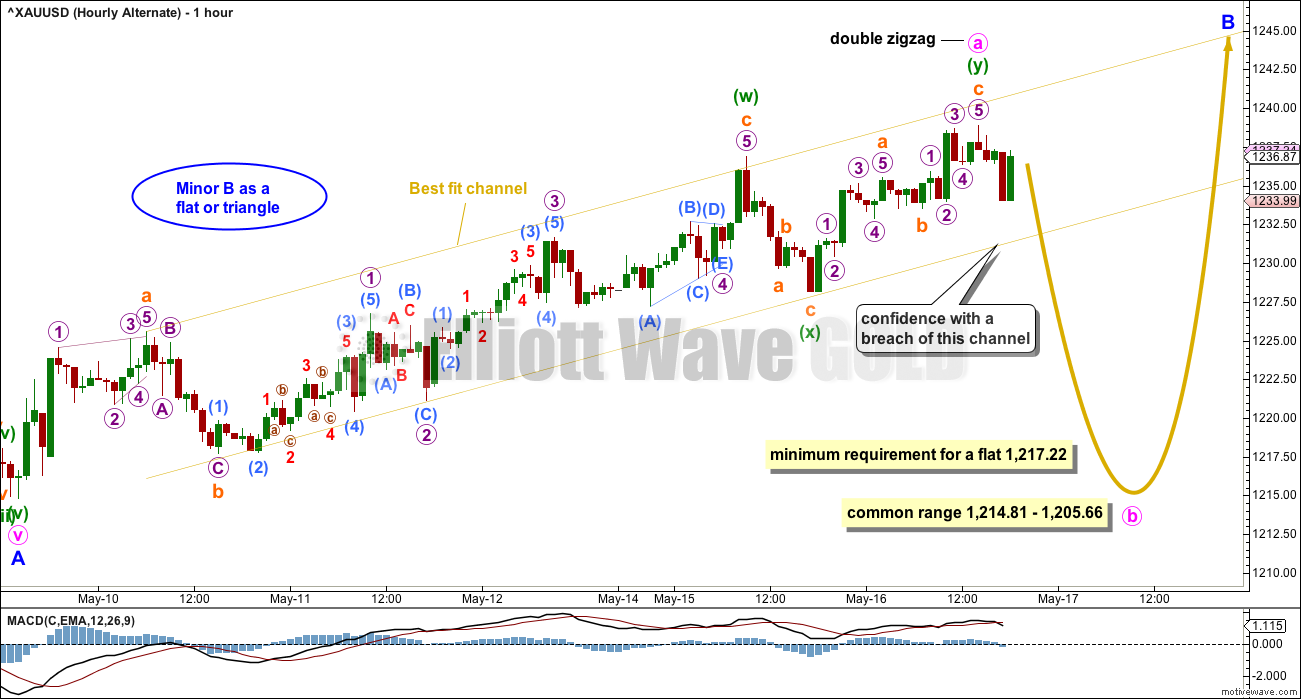
An alternate idea which sees minor wave B as either a flat or a triangle is still viable. The upwards wave labelled minute wave a will subdivide as either an impulse (main wave count) or a double zigzag (this alternate). Both possibilities should be considered.
If minute wave a has subdivided as a double zigzag, then minor wave B may be a flat or a triangle. Both of those structures require the A wave to subdivide as a three. Minor wave B may not be a combination because the maximum number of corrective structures within a combination is three. To label multiples within multiples increases the maximum beyond three, violating the rule.
Within expanded flats and running triangles, minute wave b may move below the start of minute wave a at 1,214.81. There is no lower invalidation point for this wave count.
While minute wave b must retrace a minimum 0.9 length of minute wave a for a flat correction, there is no minimum requirement for minute wave b within a triangle.
The bottom line for this alternate too is that while price remains within the best fit channel (which is drawn almost the same as the main wave count) then allow for the possibility that price may continue higher. Only when price breaks below the lower edge of this channel may any confidence in a trend change for minute wave b be had.
TECHNICAL ANALYSIS
WEEKLY CHART
Click chart to enlarge. Chart courtesy of StockCharts.com.
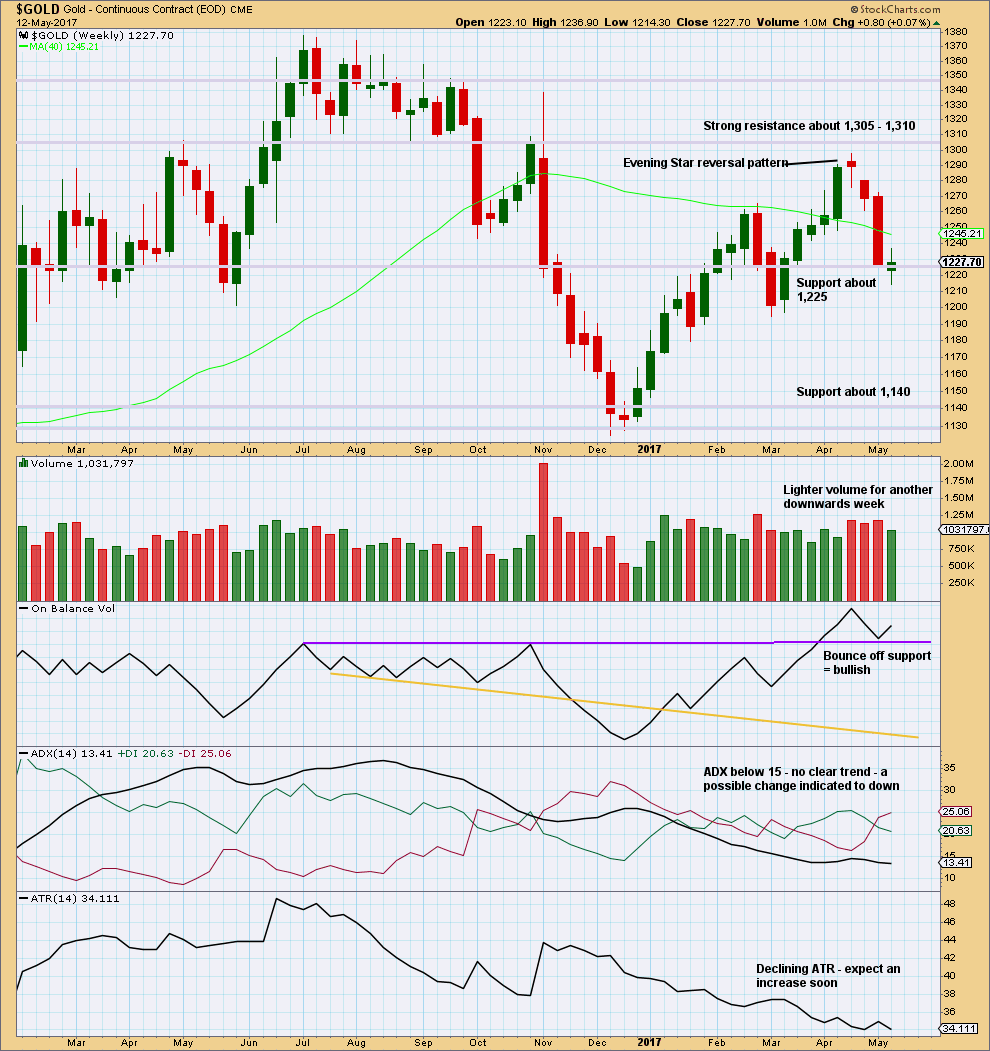
Another downwards week closes green with a small real body. This is a spinning top candlestick that shifts the trend from down to neutral.
The balance of volume is upwards and shows a decline. Upwards movement may be a counter trend movement if it does not have support from volume.
The bullish signal from On Balance Volume suggests this week may see upwards movement.
DAILY CHART
Click chart to enlarge. Chart courtesy of StockCharts.com.
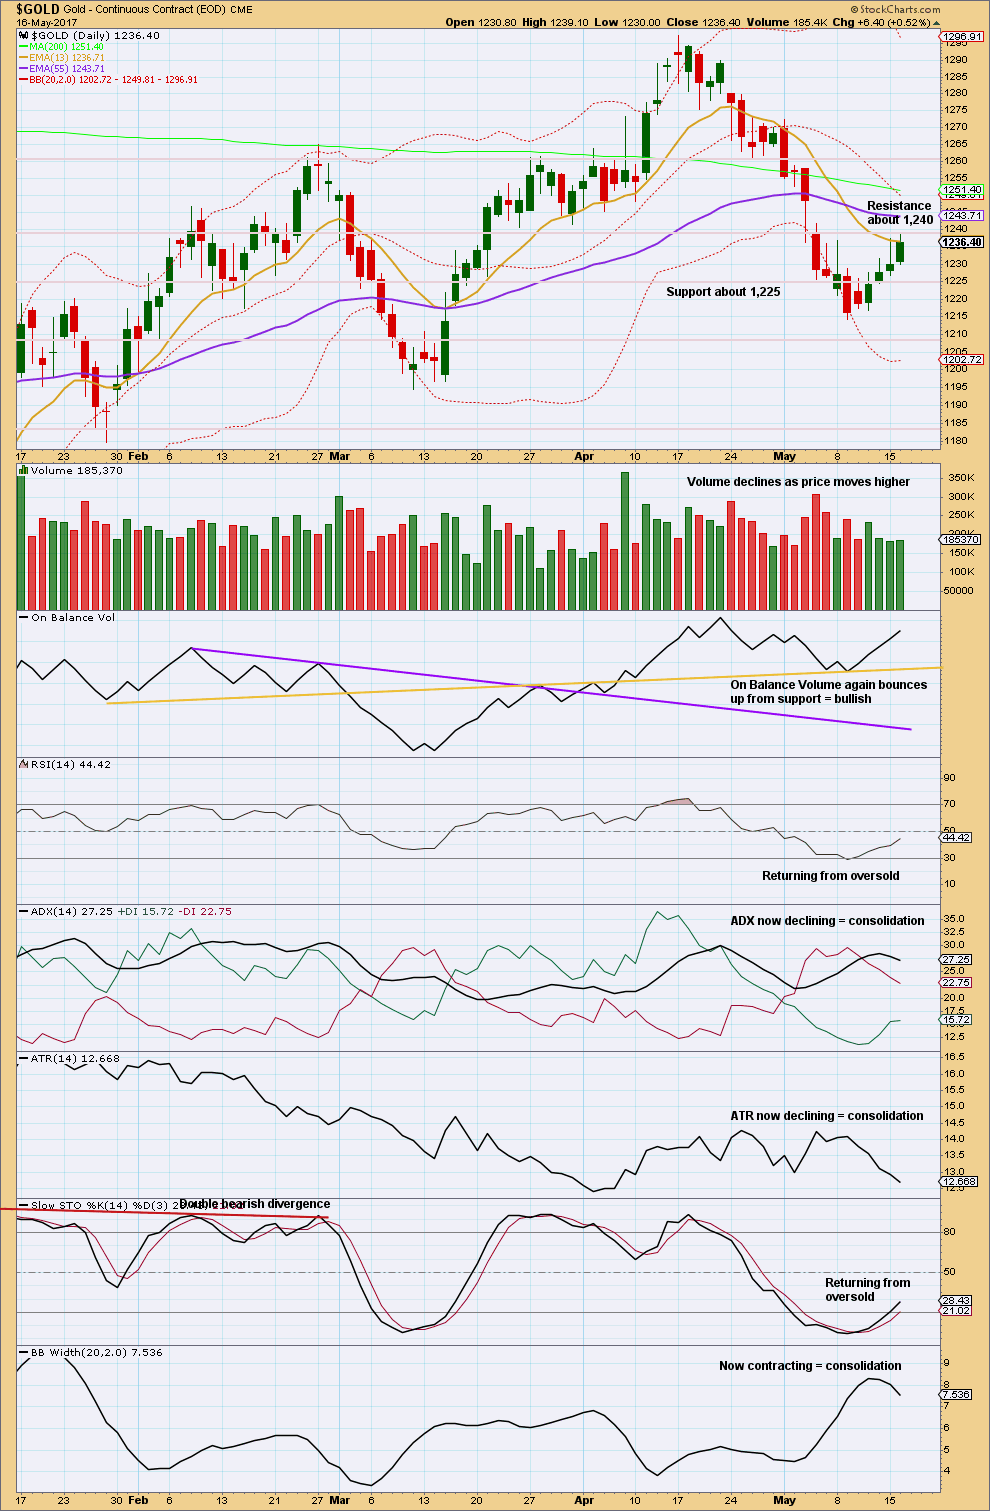
Resistance about 1,240 continues to be strong. A slight increase in volume today offers a little support for upwards movement, but volume remains relatively light.
At this stage, this upwards movement of the last five sessions still looks weak and so is most likely to be a consolidation or bounce within a larger downwards trend. It is entirely possible that upwards movement may strengthen and the conclusion could change, but for now we must evaluate the data that we have today in front of us.
Volume particularly indicates quite strongly that this bounce lacks support.
The bounce may end when price finds resistance and Stochastics reaches overbought at the same time. If price can break through resistance at 1,240, then there is next strong resistance about 1,260.
GDX
DAILY CHART
Click chart to enlarge. Chart courtesy of StockCharts.com.
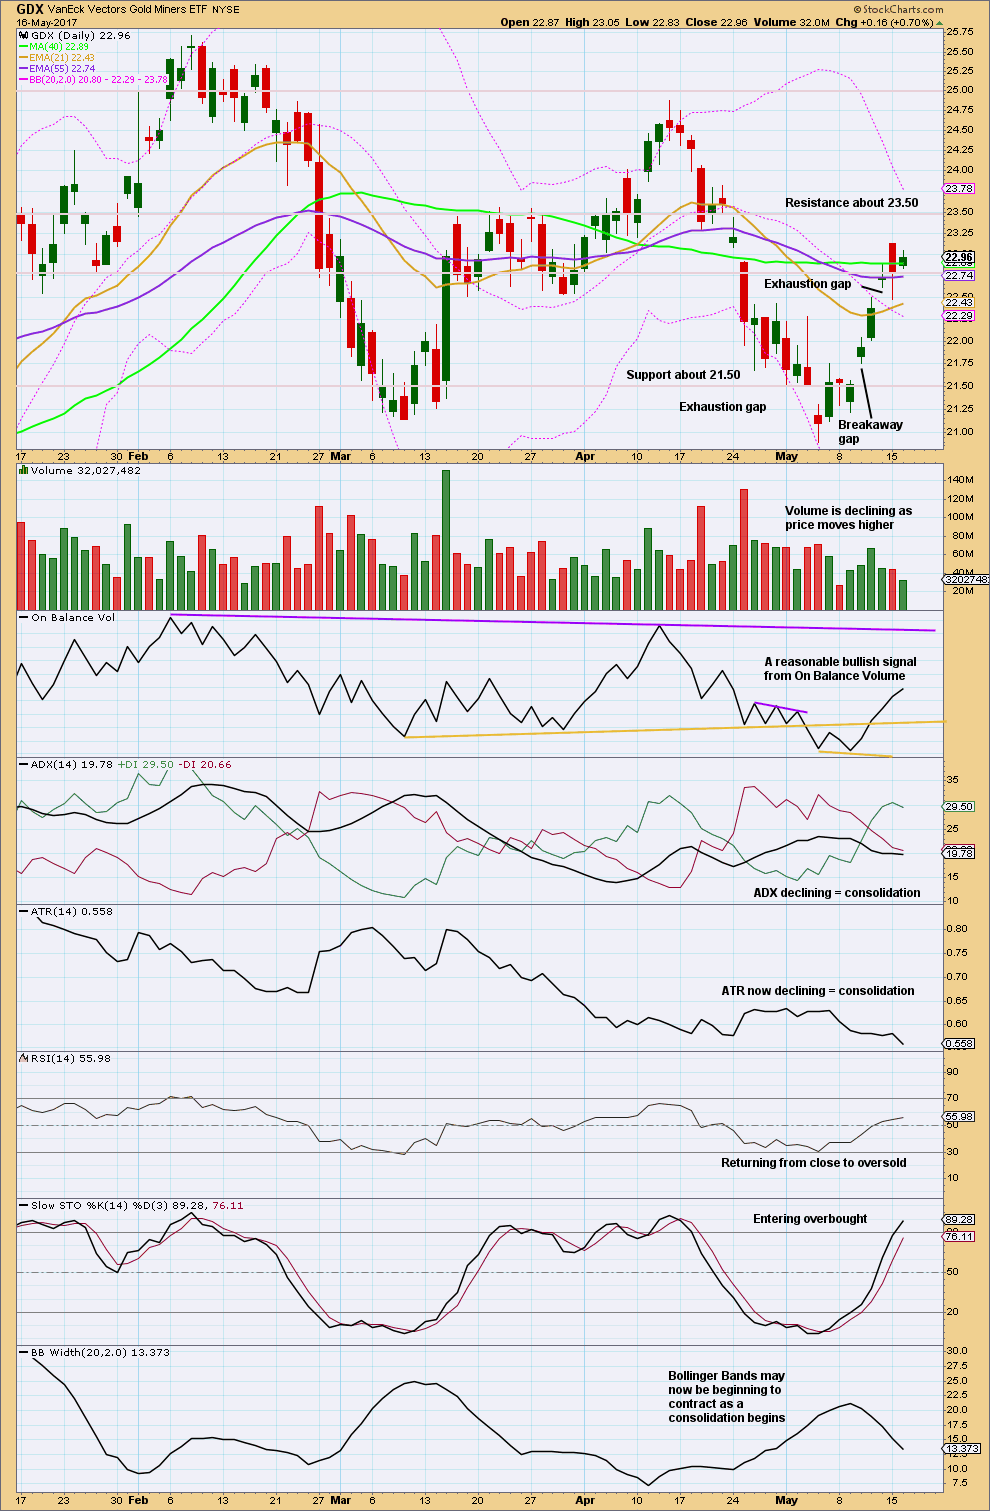
Today’s candlestick has a small real body. After the large real body of yesterday these two together complete a Harami pattern. The market is “losing it’s breath” (Nison, page 82). The bulls upwards drive has weakened, a trend change is possible.
Declining volume for the last three sessions also indicates weakness. The closure of the last gap also indicates a consolidation has likely begun.
There is resistance now here about 23.15 and support close by about 22.75.
This analysis is published @ 07:03 p.m. EST.
Imo Gold price is looking to rally. It probably has made its low for the day already at 1257-56. Silver is bottomy.
Maybe this is a quick sharp zigzag for minor B?
This sure is the strongest movement for a day (largest range anyway) that we’ve seen in months.
The 0.618 Fibonacci ratio is now very close. Target 1,264.
And this right there is the problem with B waves. While they’re more often than not very choppy, complicated and time consuming, they can also be quick, sharp and steep 🙁
could it also be a five wave up indicating a bull trade, the begining of a third wave up?
It’s possible. If cycle b is a double zigzag and X was unusually deep.
A bit of caution as the miners are not really buying this move, looks like we are closer to an intermediate top than start of a bull market. The fact that the market is down 300 points may have something to do with miners being muted. Silver really not popping and still not overbought like the miners are, as far as stochastics go.
Volume will be interesting today. Unfortunately, if volume is heavy for Gold it can be interpreted in two ways:
it could be a blowoff top
OR
it could be an indication of a new bull move
Volume was very strong today, as it was for the corresponding (for now) down move in the S&P. Gold stocks were disappointing, but they already made a big move in anticipation, and could have been muted a bit by the general market. Nevertheless NUGT had big up volume. Dollar was down but UUP had so-so volume. I’m in cash now because i was forced to take profits today but eagerly watching the action and next opportunity for something
It really does look like a blow off top today.
I’m going to go with that as more likely. Volume is so very heavy compared to the prior upwards days.
At least some sideways movement here, if not a trend change.
Will be very interesting to see what happens next. The issue is gold has been inverse to the market lately, and from where i sit the market is in a very precarious position. Even the Nasdaq just confirmed the sell signal today and the trade has been so lopsided and vix so beat up that a one day sell off like today might trigger something much worse. And financial stock charts look very scary, and they tend to lead. However, i’m not messing with calling tops in the massive stock market bull. I always get my hat handed to me when i do that. For now this is a one day wonder until we see further action and confirmation. In cash but would not want to be long stocks or short gold at this moment
Whew, quite an up move by Gold price. Appears to be basing off 1255 for now with no let up and looking unlikely to break below 1250; probably heading on up for 1268-77 range. Lets wait for Lara’s update. Quite fantastic Lara’s target 1260 met. Brilliant!
Syed
If you look at 4 hour chart gold hit the resistance at 1260 bottom of 4/25 to 5/1 side way consolidation. AND there after gold fell with red candle.
If gold manages to cross this consolidation it can move higher??? may be.
Also GSR is back testing the breakout from 74.70.
AT 74.70 if it turns than gold will resume upward movement.
To be safe raised some cash for up coming correction Lara is writing about.
Other than the “normal” helpful commentators, I was thinking that gold’s upward push well past expectations in a poor trading B wave environment would stimulate more conversation. Hmmmm?
Looks like gold reached resistance at 1260, but then again, the VIX created an island breakaway and appears to possibly be able to reach 20 over time. If this is the case, than gold would certainly move higher too.
Regarding the S&P, I recall someone saying we’re in a 4th wave? If so, the 5th wave would move things up, right? Ultimately, I’m trying to gauge the action in the stock market with gold’s expected path which is indicating a sizeable drop to come.
Watch GDX at 23.40 today. Should it drop below 23.40, it’s on it’s way to making lower lows and could signal a further drop is expected.
The RSI for gold is very high on the 1 hr and 4 hr, but on the daily, it’s not that high. This is also signaling a pull back in gold is likely, but who the heck knows. Political uncertainty and the louder talk of impeachment combined with delays in Trump’s tax plan is certainly playing havoc now in the markets. In addition, the Fed expectations for a June rate hike have been lowered triggering a flight to bonds.
I’m currently in cash and am waiting only because I have no idea which way things will go. Intraday trading has been tough and it appears that all the action is taking place overnight which means jumping in at business close and holding your breath.
Miners have been the tell on all the recent rallies and corrections in gold. Pretty clear, miners lead.
1260-62 CLVN resistance could temporarily stall the rally in gold. Still long miners and /GC.
Gold is still going strong. It has already gone past my target at 1247.28 (explained in the 4-hourly analysis). It looks like it is bent on testing the 1250 level, having successfully breached the 1245-1246. If momentum still carries it forward, then the daily kijun-sen at 1255.85 (please refer to the chart posted with the Daily Ichimoku Analysis) will be next.
I am still holding a few downside hedges though considerably lighter than a week ago.
We could get a golden cross soon for the yellow metal and Silver will certainly follow if that happens with its own. Very bullish! 🙂
GDX bullish count shown. There are of course more bearish options if a new low is made on a pullback.
https://www.tradingview.com/x/HwpKmX2D/
Tremors?
I reloaded my short oil positions on Monday including my short on APC, Anadarko Petroleum. I tried last night to get an after hours quote and kept getting a site error notice which I found strange as I was able to get quotes for other symbols. I went looking for some clues as to what might be going on and discovered that a class action lawsuit has been filed against the company after the close! I suspected something strange was going on and that certainly explains it. It closed at over 51 per share yesterday and the fact that one cannot get a quote of any kind on the shares right now is quite ominous. I imagine it will be the first of many casualties in the sector. It would seem the lawyers are moving early as they know what is coming with the huge bond float issued to finance the sector and bond-holders are generally first in line when there is trouble. Of course a precedent may have been set with what they did to GM bond holders during the last financial crisis.
Wow. Thank you very much Verne for the information on Anadarko. Most helpful here to any members holding shares there.
Possible update to Lara’s hourly count
https://www.tradingview.com/x/Q48cl2Vb/
Yes. This ought to be it. Gold might test 1250 next, but again it might just fizzle out.
Gold has very bullish candlestiks chart pattern in 4 hour. A solid green candle followed by two doji and the current green candle above red cloud.
This is bullish. No target can be estimated from this. All it tells us that it is bullish.
Silver is already above cloud and ” not touching”. A break out above cloud.
GSR is at mid point of reverse symmetry to target 70.
It was looking pretty bleak for these patterns a week ago, but with Trump’s daily antics distracting from growing the economy, they might just have a chance.
The dollar may be breaking down. Gold is nearing some resistance.
https://www.tradingview.com/x/cZ7R92Qn/
Ichimoku 4-Hourly Analysis
Data as at 3:30 am ET today
=======================
Gold price is hugging the top boundary of the (red) cloud in an attempt to break above it. The tenkan-sen lies above the kijun-sen, providing fuel for the climb, but the red coloured cloud gives a suitable warning that all is not a bed of roses yet. If prices do manage to break free of the upper cloud boundary, then the test of 1245, maybe followed by 1250 could be in the offing. However, if prices do get rejected, then the first inkling of a drop in Minute B would be signalled.
Yesterday, I had considered that Minute A would end at minuette 5 = 0.618 * minuette 3. Price had since risen above that. My next consideration would be equality of minuette 5 with minuette 3, at 1247.28. The larger implication of this is that Minor B could then become a 0.618 retrace of Minor A, targeting 1264. Extrapolating, this could indicate that Intermediate B might be a zigzag instead of a flat or triangle. The good news then is that the drop in Minor C would then become more benign, targeting around the 1180s.
My apologies for the error. Instead of “Extrapolating, this could indicate that Intermediate B might be a zigzag instead of a flat” I meant Primary Y. It was just a thought. This would bring Primary Y to the 1420s, instead of 1374-1375. I might be overthinking; it’s just that it’s too tempting to question assumptions, to look at possibilities, unless they are impossible beyond a shadow of a doubt. Although the most common structures in a double combination are a zigzag and a flat, I don’t think two zigzags are precluded.
Ichimoku Daily Analysis
Data as at the close of May 16
=========================
Gold markets rallied during the session on Tuesday, for the fifth consecutive day. The price rise has been very modest so far because it appears that investors are largely ignoring global headline risks. But, there are still a lot of issues with Syria and North Korea, and it’s probably only a matter of time before they became central focus again. The market is building up a considerable amount of bullish pressure, so under the proper conditions a price rise could be rather swift, targeting the 1250 level or more. On a fundamental level, this rise could be attributed to the recent drop in the US dollar together with the lethargic grind of the stock market. What this means is that should these contributing factors abruptly change, gold price will again head southwards, and that quickly too. Nowadays, without the de facto safe haven status that it had enjoyed in the past, largely due to the dissuasion, castigation, and even denouncement by the corrupt media with an obvious agenda, gold is very much subject to capricious sentiments. That is the reason why I have recently looked at sentiment along with the technical aspect in trying to make sense of gold’s price movements.
Gold price now lies snugly within the (green) cloud, which is seen to be on a rising uptrend. If not for the fact that the tenkan-sen is still below the kijun-sen, the rise would have been much more dramatic. Anyway, I am inclined to think that gold has sufficient stamina to test the 1245 level, and if successful, the 1250. Until it runs out of steam, the trend is still up, although a persistently irritating slow climb.
Love your posts Alan. I get a vocabulary lesson daily as well as great analysis!!!
Just wondering: gold price got a pop up due to an upturn in MacdMA & perhaps due to 5dma crossed above 10dma. Not too sure if want to remain long Gold in overboght conditions and with 20dma having crossed below both 200dma & 50dma. Gosh price retaining above 1242 is very tempting to look for further upside 1250-52. . .hmm interesting!
Syed. Perhaps we could consider the short-term trendline (shown in pink in the graphic). A drop below the line could signify that the uptrend is likely to be over. If price still follows the trendline, then the climb is still ongoing.
Thanks a lot Alan. Good day. Your views and analysis mean a lot! Staying long on this pup for 1250-52 with a stop at 1238 or may consider drop the stop to 1235. Let’s see what happens. 🙂
*this will be a real whopper if gold price can break through 1246-47; very suspicious of the upside with 4-hourly RSI in 70+ region* lol. . .GL all!