
Last analysis expected it was most likely that price would move sideways and slowly higher. An inside day closing green fits this description exactly.
Summary: It looks like next week price may continue sideways or slowly higher towards a target about 1,276 (which may be too high) before a final upwards wave. Only a new low below 1,214.81 at this stage would indicate upwards movement is over.
New updates to this analysis are in bold.
Last historic analysis with monthly charts is here, video is here.
Grand SuperCycle analysis is here.
MAIN ELLIOTT WAVE COUNT
For clarity I have decided at this time it may be best to publish on a daily basis weekly charts I, II and IV. Both weekly charts I and II expect a zigzag down to complete and the difference is in the expected depth. Weekly chart IV has a very low probability and will only be given serious consideration if price makes a new high above 1,294.96.
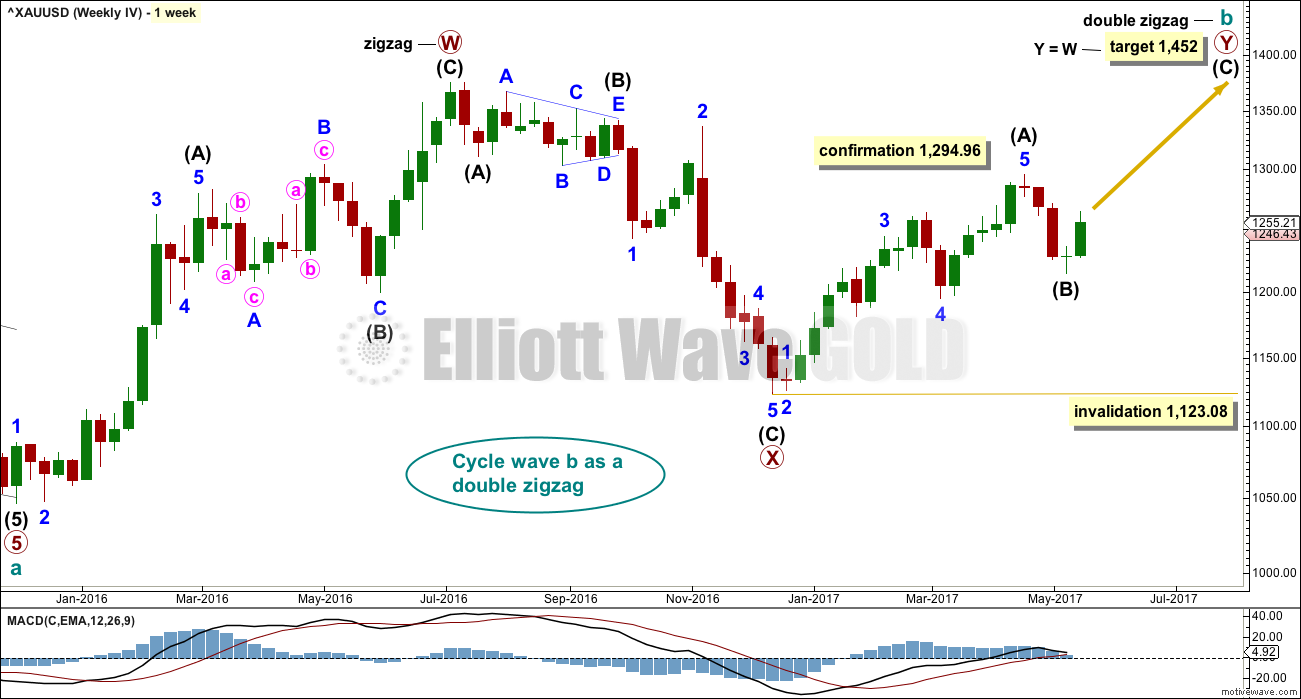
WEEKLY CHART I
Click chart to enlarge.
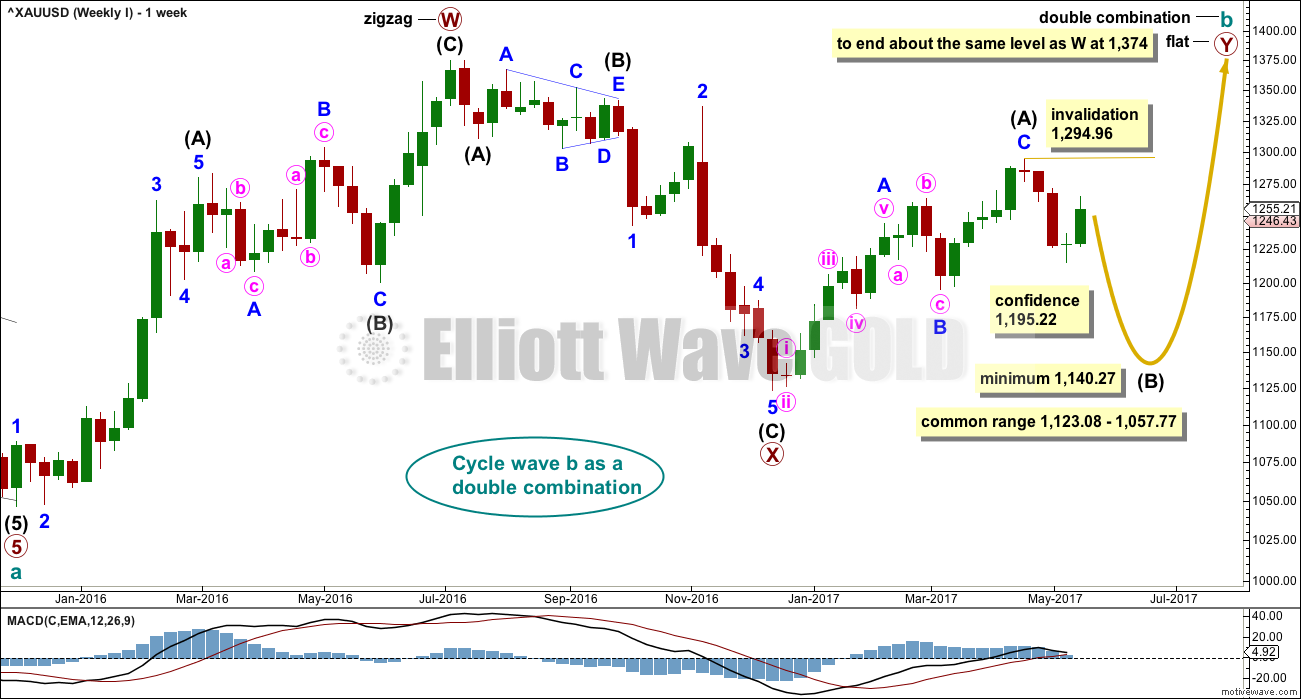
Combinations are very common structures. Cycle degree waves normally last one to several years, and B waves do tend to be more time consuming waves than all other waves. Given these tendencies the most likely scenario at this point may be that cycle wave b is an incomplete double combination.
The first structure in the double labelled primary wave W fits as a zigzag. This upwards movement will subdivide as either a three (zigzag) or a five (impulse). It does have a three wave look to it.
The double is joined by a deep three in the opposite direction labelled primary wave X, which is a 0.77 depth of primary wave W. X waves within double combinations are normally very deep; this one looks right.
The second structure in the combination may be either a triangle or a flat correction. Both of these structures have A waves which subdivide as threes.
At this stage, the upwards wave from the low in December 2016 does now look best and subdivide best as a completed zigzag. This may be intermediate wave (A) of a flat correction or a triangle. Because a triangle for primary wave Y would look essentially the same as the second weekly chart below, only a flat correction is considered here. The most common two structures in a double combination are a zigzag and a flat.
This wave count follows the most common scenario and has the best fit.
Within the flat correction of primary wave Y, intermediate wave (B) must retrace a minimum 0.9 length of intermediate wave (A) at 1,140.27. The most common length for intermediate wave (B) is from 1 to 1.38 times the length of intermediate wave (A), giving a common range from 1,123.08 to 1,057.77.
Intermediate wave (B) may subdivide as any corrective structure, but the most common structure for B waves within flats is a zigzag. At this stage, on the hourly chart it looks like a five down is now complete, which would indicate intermediate wave (B) is a zigzag subdividing 5-3-5.
The daily and hourly charts will follow this weekly chart. That does not mean the other three weekly charts aren’t possible, they are, but the number of charts must be kept reasonable on a daily basis.
WEEKLY CHART II
Click chart to enlarge.
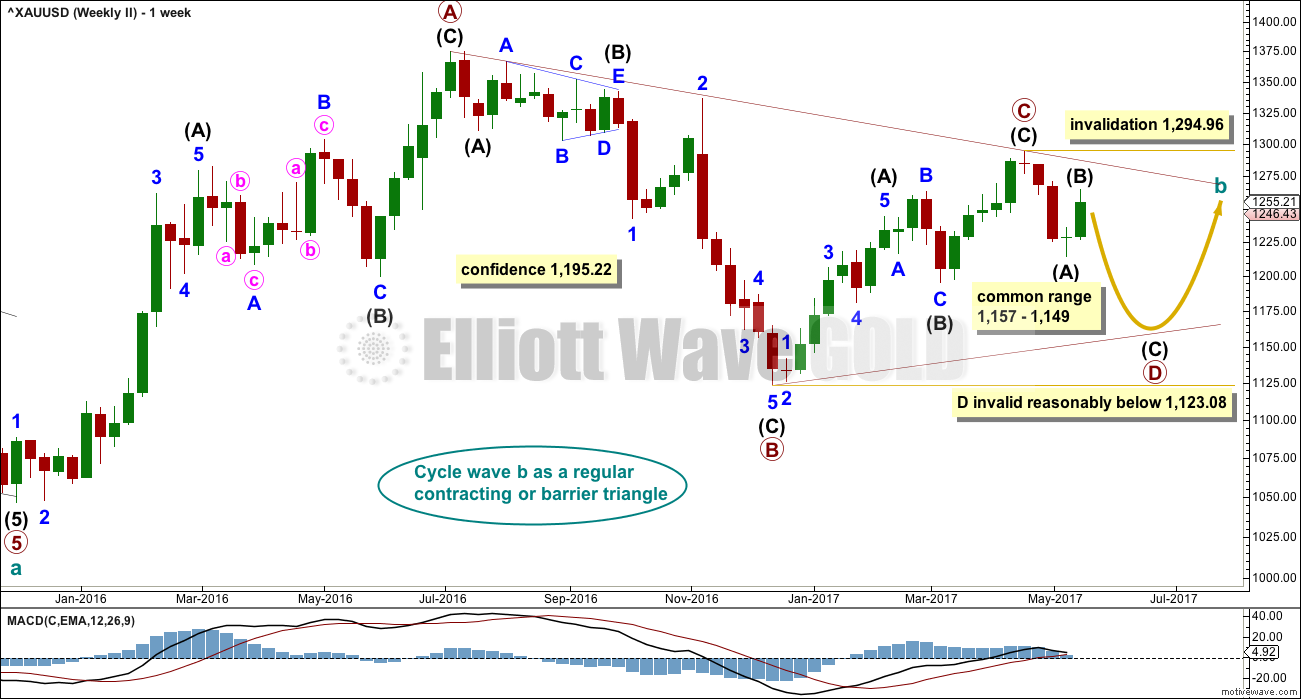
What if cycle wave b is a triangle? This is also entirely possible. Triangles are not as common as double combinations, but they are not uncommon.
Within the triangle, primary waves A, B and C are all single zigzags. One of the five subwaves of a triangle normally subdivides as a more complicated multiple, usually a double zigzag. This may be what is unfolding for primary wave D.
Primary wave D of a regular contracting triangle may not move beyond the end of primary wave B below 1,123.08.
Primary wave D of a regular barrier triangle should end about the same level as primary wave B at 1,123.08, so that the B-D trend line is essentially flat. What this means in practice is that primary wave D may end slightly below 1,123.08 and the triangle would remain valid. This is the only Elliott wave rule which is not black and white.
Thereafter, primary wave E should unfold upwards and would most likely fall a little short of the A-C trend line. If not ending there, it may overshoot the A-C trend line.
At this stage, the structure on the hourly chart is still the same for both this weekly wave count and the first weekly wave count: a zigzag downwards is unfolding. However, they now diverge in how far down the next wave is expected to go. This second weekly wave count expects a more shallow movement to not end reasonably below 1,123.08.
DAILY CHART
Click chart to enlarge.
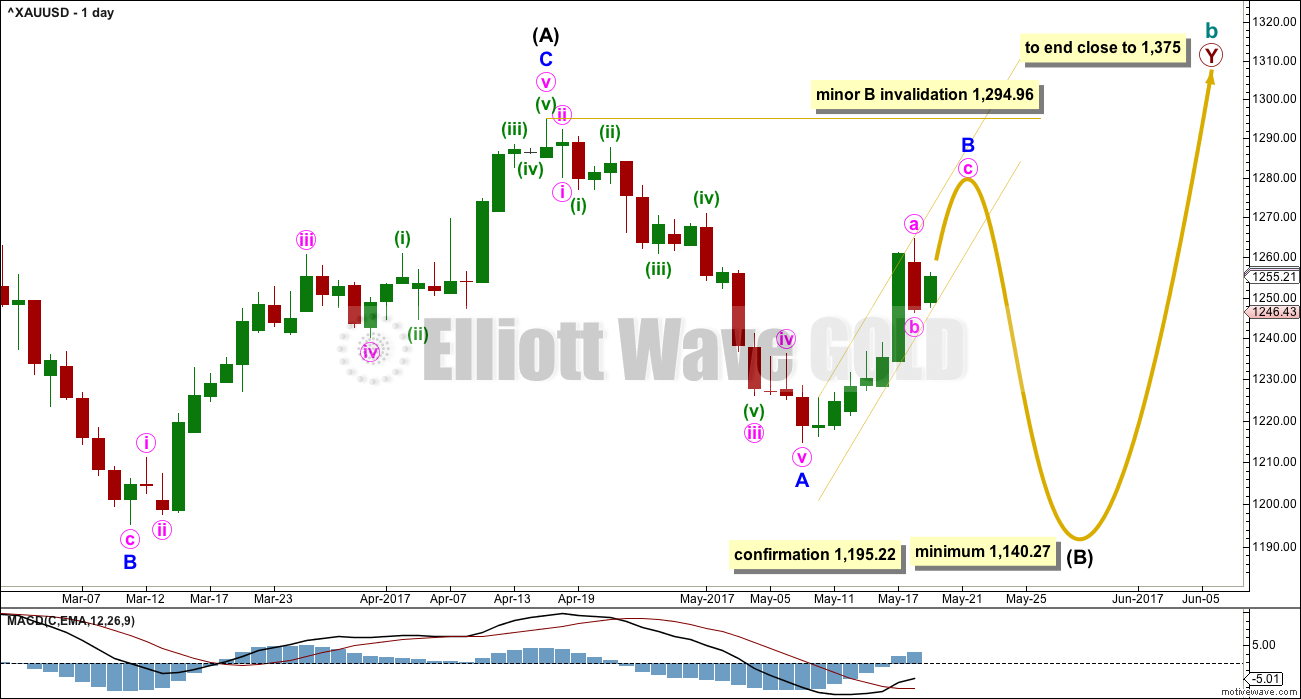
This daily chart will suffice for both weekly charts above, although the labelling follows weekly chart I.
Both weekly charts expect a zigzag downwards. Weekly chart I expects a deep zigzag for intermediate wave (B) to a minimum at 1,140.27. Weekly chart II expects a zigzag down for primary wave D to not move below 1,123.08 and most likely fall well short of that point.
The daily chart follows the expectations for weekly chart I, but the structure for weekly chart II would be exactly the same.
Within the flat correction of primary wave Y, intermediate wave (B) must retrace a minimum 0.9 length of intermediate wave (A) at 1,140.27. The most likely corrective structures to achieve the deep correction required for B waves within flats are single or multiple zigzags. These begin with a five, then a three in the opposite direction.
Minor wave A is complete. Minor wave B may be an incomplete zigzag. The first two hourly charts below look at how minor wave B may be completing. The third hourly chart below looks at the less likely possibility that minor wave B is over.
Minor wave B may not move beyond the start of minor wave A above 1,294.96.
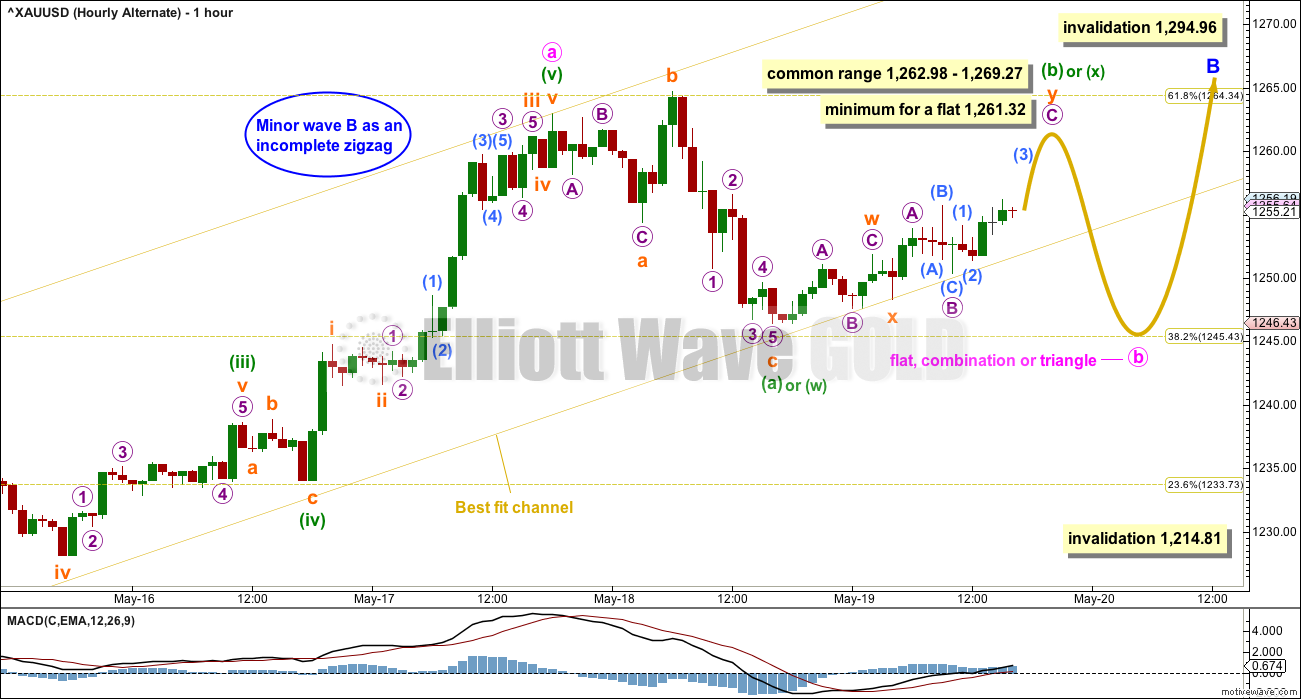
HOURLY CHART
Click chart to enlarge.
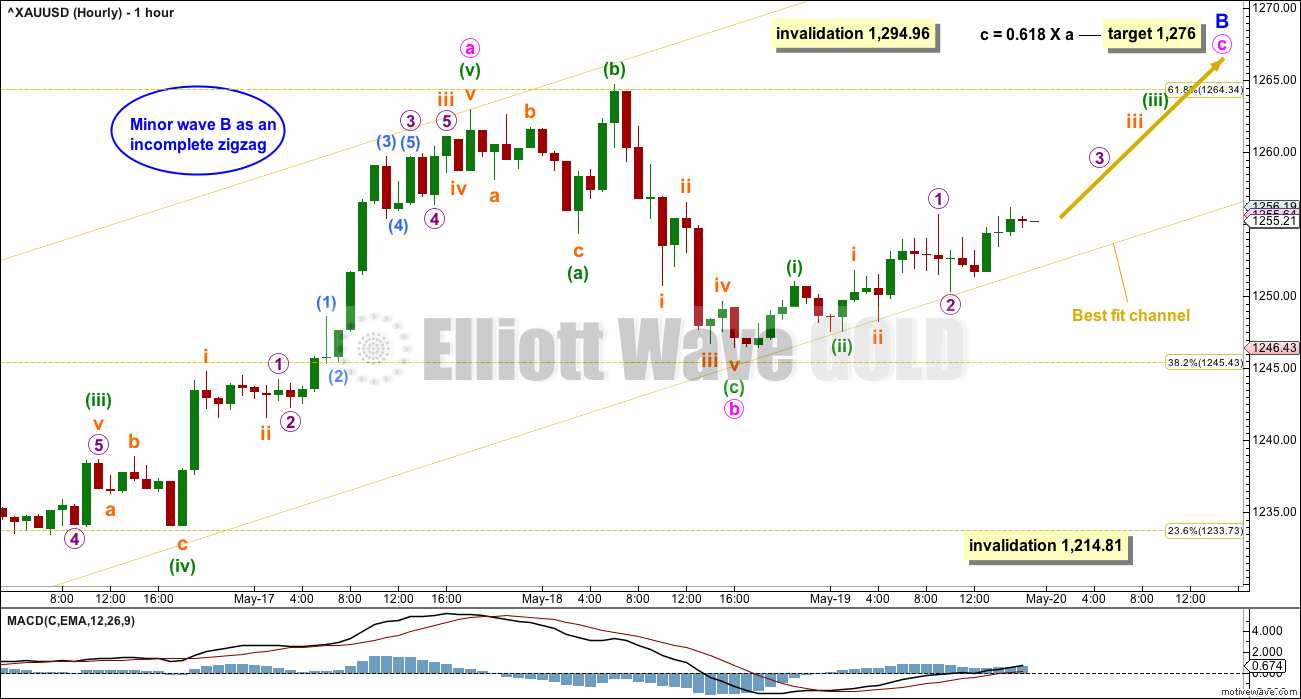
Minor wave B may be a simple and relatively quick zigzag. Within minor wave B, minute wave b may now be a complete expanded flat correction.
The lower edge of the best fit channel is pulled down very slightly to show where price found support along the way up during Friday’s session. This will remain the main wave count while price remains within this channel. If price breaks below the lower edge of this channel on Monday, then the next hourly wave count below will switch to the main wave count.
If minute wave c is underway, then it may have begun with a series of three overlapping first and second waves. This wave count expects to see an increase in upwards momentum when markets open on Monday.
It is my judgement that this first hourly wave count is very close to even in probability with the next count below labelled “alternate hourly chart”.
The third “alternate hourly chart II” has the lowest probability buy not by very much.
ALTERNATE HOURLY CHART
Click chart to enlarge.
It is also entirely possible that minute wave b is not over as a single, relatively quick, expanded flat correction. That may have been only minuette wave (a) within a continuing flat or triangle, or minuette wave (w) within a continuing double combination or double flat correction.
All these structures (flats, triangles, double combinations and double flats) are sideways movements (with the sole exception of expanded flats). If minute wave b is to continue sideways next week, then it may be in choppy overlapping movement with a range of resistance about 1,265 and support about 1,245.
If minute wave b does continue sideways next week, then it may be only at the end that the structure is clear. Labelling within it will change as the structure unfolds.
Because minute wave a looks very much like a five wave structure, minute wave b may not move beyond its start below 1,214.81.
ALTERNATE HOURLY CHART II
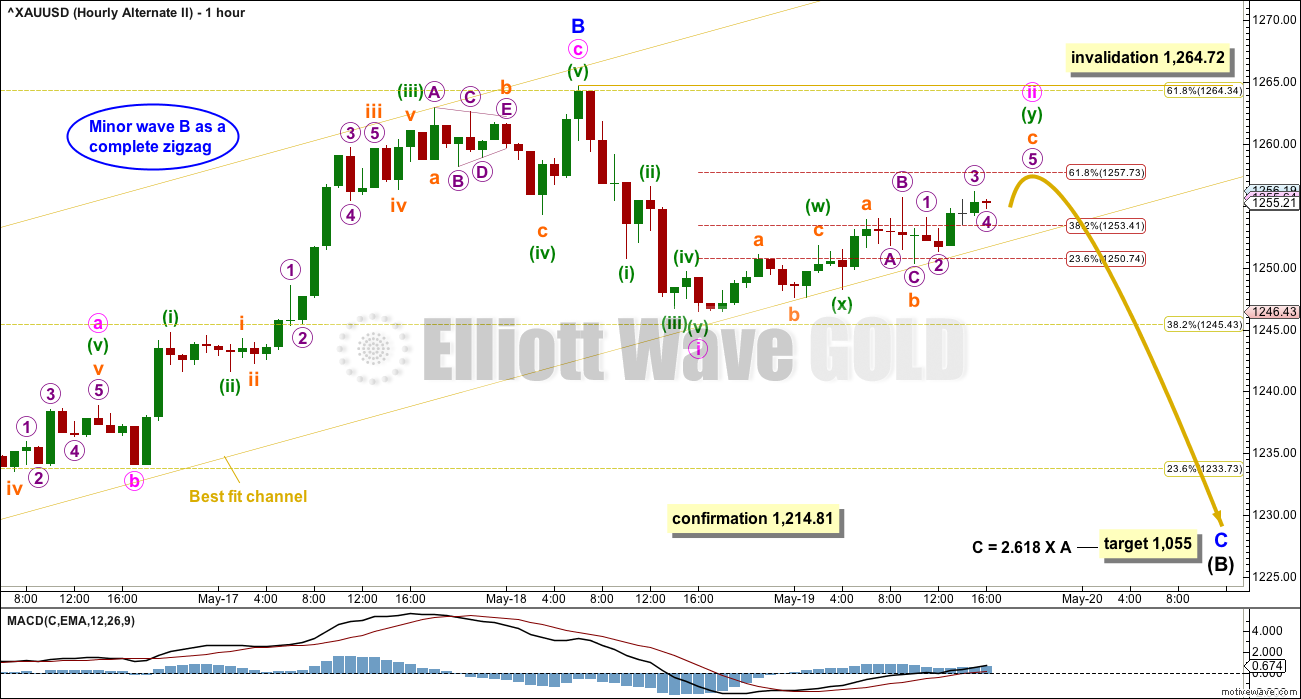
Click chart to enlarge.
It is also still possible, but less likely, that minor wave B is over as a very quick and sharp zigzag.
B waves exhibit a huge variety in structure and price behaviour. It is important to consider all possibilities when B waves unfold.
Minor wave C downwards must subdivide as a five wave structure, either an impulse (more common) or an ending diagonal (less common). So far, with what looks like a fairly clear five down for minute wave i, it looks like minor wave C may be an impulse.
The second wave may not move beyond the start of the first wave within both an impulse and diagonal. This wave count would be invalidated with a new high above 1,264.72.
A new low below 1,214.81 would invalidate the first two hourly charts and provide price confirmation of this second alternate wave count.
WEEKLY CHART IV
Click chart to enlarge.
What if the bull market beginning in December 2015 remains intact? Price has essentially been moving sideways since that date, so all possibilities should be considered.
After further consideration, the Morning Doji Star at the low labelled intermediate wave (B) will not be considered as a reversal pattern here because it comes in what is essentially a sideways movement. It does not come after a downwards wave, so there is nothing to reverse.
This wave count requires confirmation above 1,294.96. That would invalidate the first three weekly charts (the third is seen in historic analysis only).
It is possible that cycle wave b is continuing higher as a double zigzag. However, double zigzags normally have brief and shallow X waves. The purpose of the second zigzag in a double (and the third when there is one) is to deepen the correction when price does not move deep enough in the first (or second) zigzag. Thus double (and triple) zigzags normally have a strong and clear slope against the prior trend. To achieve this look their X waves normally are brief and shallow.
In this case, primary wave X is neither brief nor shallow. It is a 0.77 depth of primary wave W and lasted 0.74 the duration of primary wave W. Overall, this does not have a typical look of a double zigzag so far.
This wave count also must see the rise up to the high labelled intermediate wave (A) as a five wave impulse, not a three wave zigzag. This looks a little forced, so it reduces the probability of this wave count.
This wave count should only be used if confirmed with a new high above 1,294.96. Low probability does not mean no probability, but should always be given less weight until proven.
TECHNICAL ANALYSIS
WEEKLY CHART
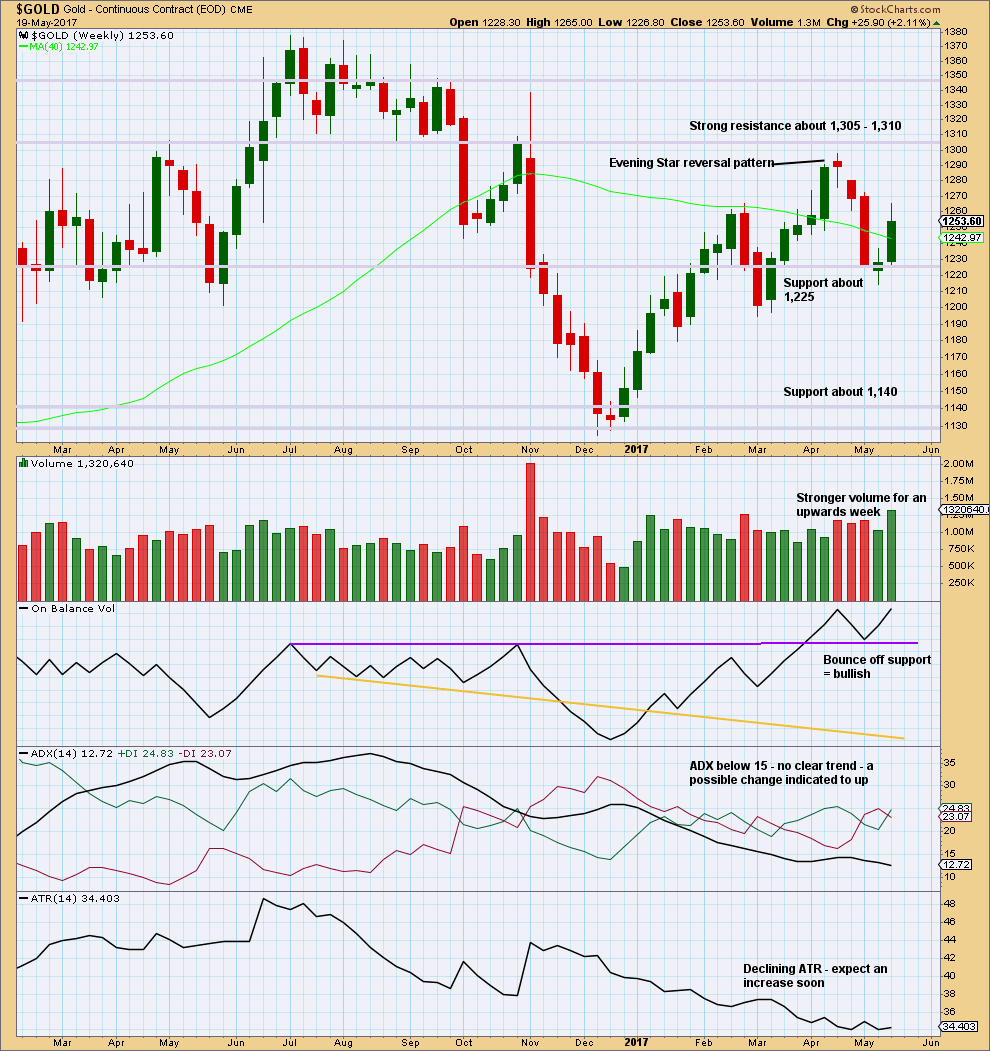
Click chart to enlarge. Chart courtesy of StockCharts.com.
Volume this week strongly supports upwards movement. This is bullish.
Since the low in December 2017, price has still made higher highs and higher lows. This upwards trend would be indicated as possibly over only if price makes a new low below 1,194.50.
On Balance Volume is bullish.
ADX and ATR both indicate an unclear and weak trend.
DAILY CHART
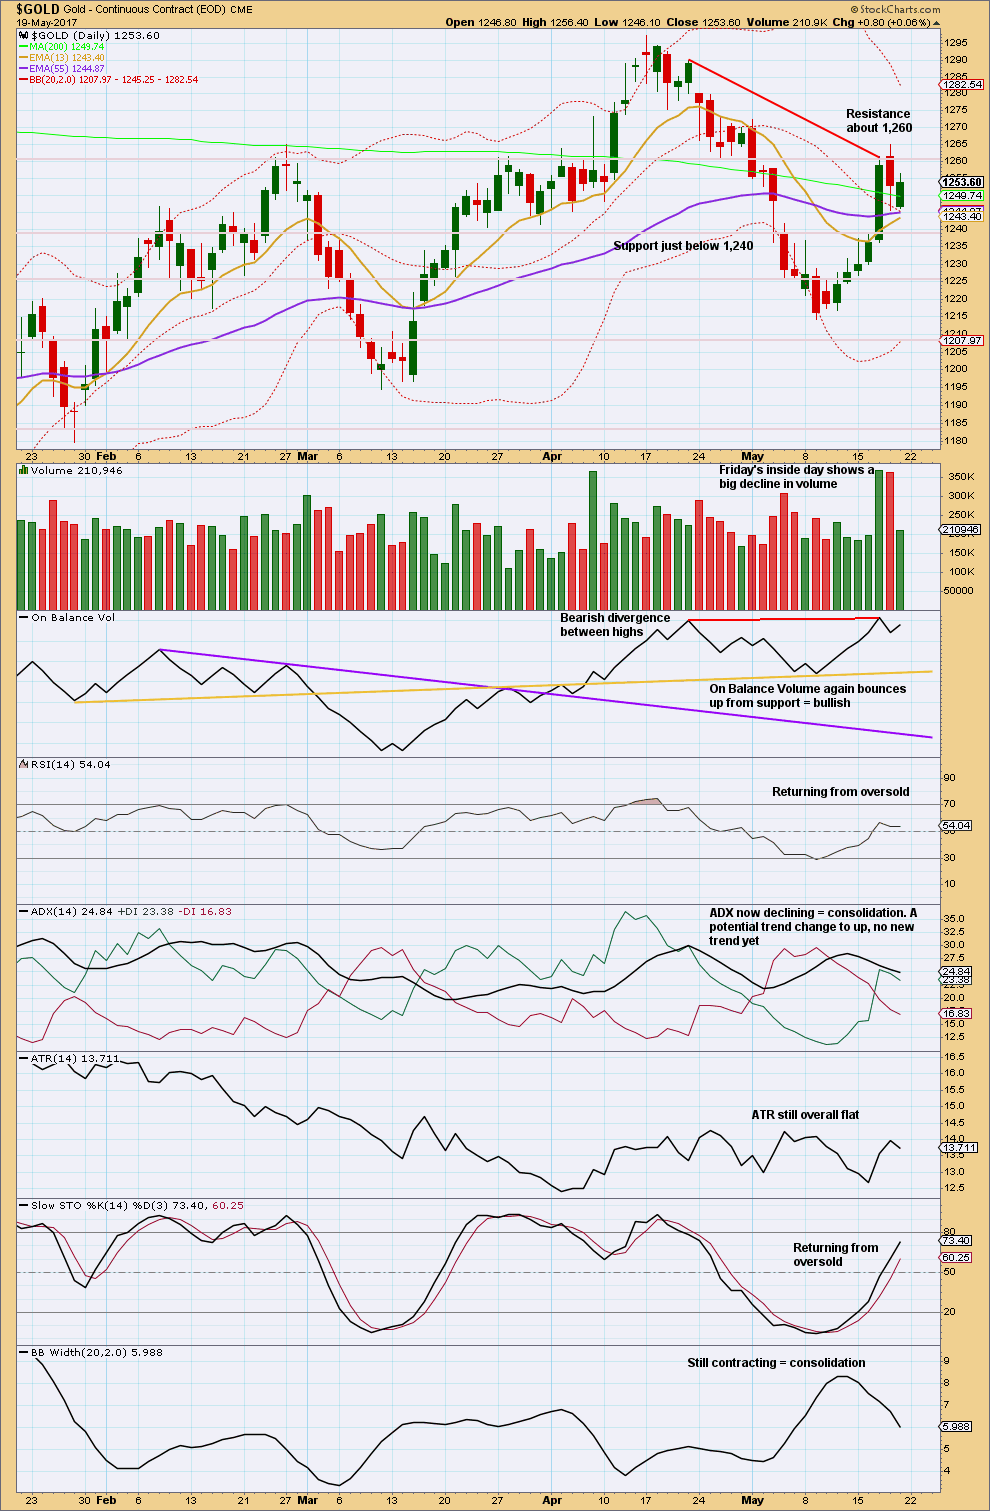
Click chart to enlarge. Chart courtesy of StockCharts.com.
Price is finding support on the mid term Fibonacci 55 day moving average.
During Friday’s session, the balance of volume was upwards and volume showed a strong decline. Upwards movement did not have support from volume. This looks like a counter trend movement or small consolidation is underway after the blow off top.
On Balance Volume at the daily chart level is mixed. There is bearish divergence and the last signal given was bullish. Overall, it is more bearish than bullish because the last signal given was bearish divergence.
ADX, ATR and Bollinger Bands all indicate a consolidation. Price lacks volatility and range, which is more normal for a consolidating market than a trending market.
Strongest volume for recent days are the two upwards days of the 7th of April and the 17th of May. This suggests an upwards bias and fits with the trend at the weekly chart level. That would fit Weekly chart IV best, but it may also fit Weekly chart II.
GDX
DAILY CHART
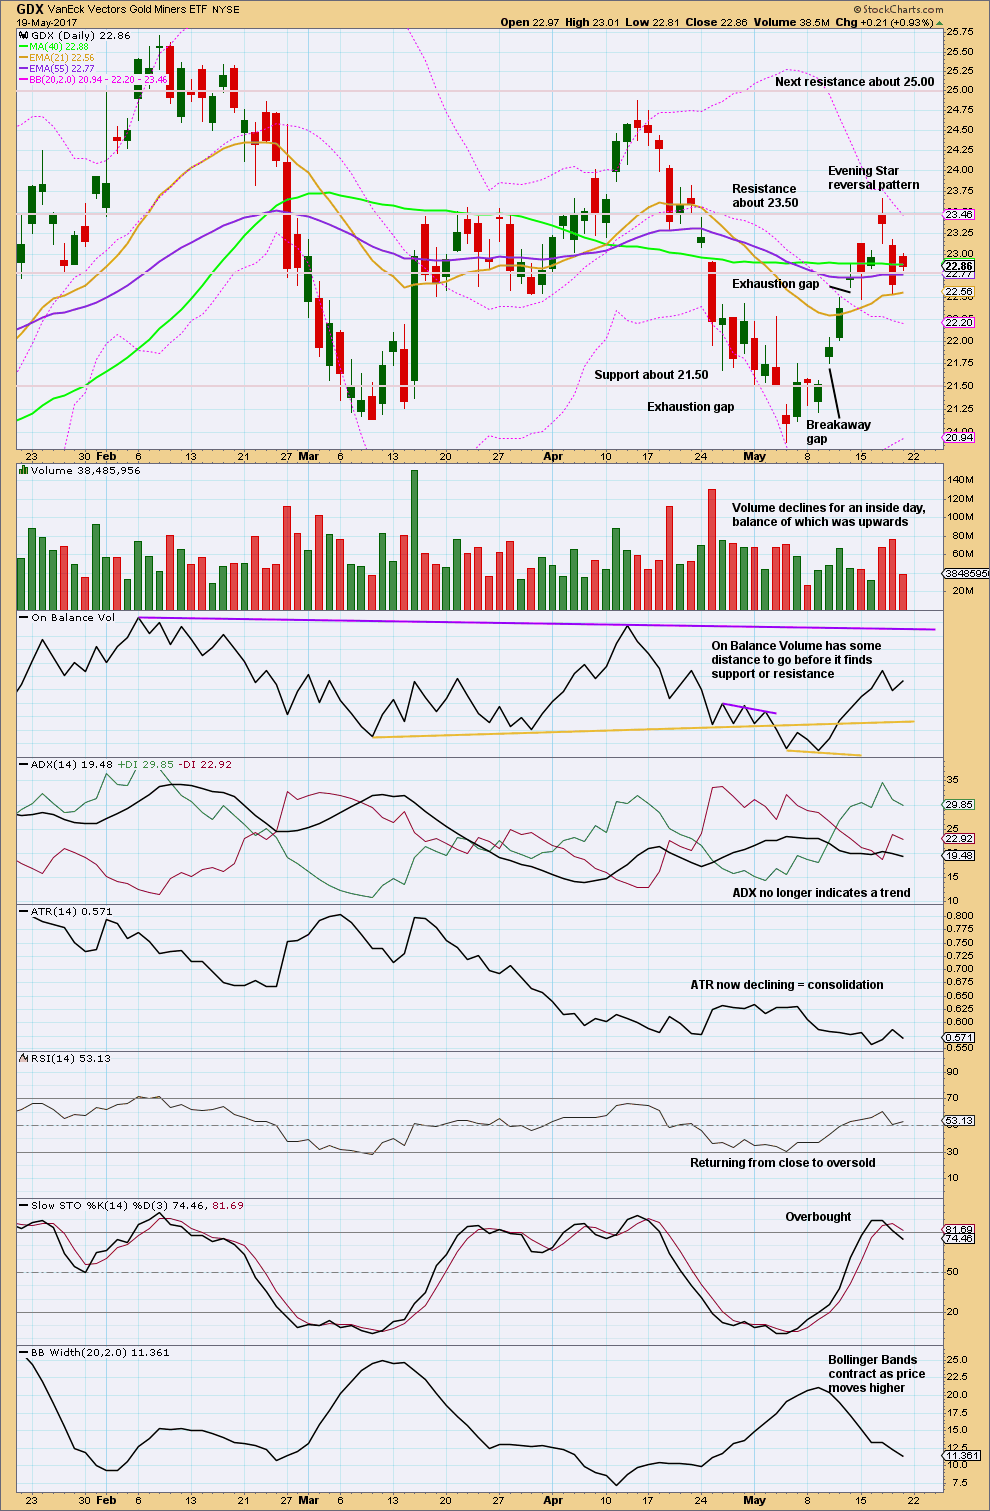
Click chart to enlarge. Chart courtesy of StockCharts.com.
The Evening Star candlestick pattern is supported by heavier volume on the last candlestick. This supports the idea of a high in place now for GDX.
Bollinger Bands expand when markets trend and contract when they consolidate. With the bands contracting as price has moved higher, it looks like this is a counter trend movement. It may now be over. ADX and ATR agree that upwards movement is more likely a counter trend movement than a new upwards trend.
The small inside day for Friday does not change the short term outlook for GDX.
This analysis is published @ 08:20 p.m. EST on 20th May, 2017.
We got the “Golden Cross” today…
http://www.cnbc.com/2017/05/22/golds-golden-cross-the-metal-just-formed-a-chart-pattern-that-can-signal-a-breakout.html
…. imo the bulls have this neck & crop; hard to see a break below 1257 for 1254-53 in a hurry; lets see if Gold price can carry on up to get to and break above 1265 today….(Main count Minute C as mentioned by Alan below?)
Has anyone been following the chart of oil?
It is starting to look like a five up off the last lows.
I guess it could also be a 5,3,5 but I am not sure at this point.
I am still expecting this move is corrective, but price would have to reverse fairly quickly if that is indeed the case.
Look at volume. It’s quite light and declining for this upwards trend.
I’ve just posted an updated chart on Oil.
Thanks. Lara. I think I saw some huge topping charts and did not think my price expectations were nullified by the recent run-up.
Thank you to Papudi, Dreamer, Alan, Verne for your excellent contributions- getting everyone off to a good start. Now, I’m going to bed. 😉 Spun around a bit much, waiting on price. The GSR is my big picture, thanks to Papudi’s enlightenment. Alan’s analysis is my detailed pic. I’m not positioned well atm so am following detail closely in case I need to alter position. Once again, thank you everyone for your excellence.
Rest well.
Thanks. Yes indeed GSR has been very reliable indicator among few more.
In 2 hour it is showing free fall from 75.72 to currently at 73.625.
It appears it is going down to 70 area.
Once again when GSR falls nominal price of gold/silver goes higher and vice a versa.
Ichimoku Gold Update
Data as at 6:00 am ET today
=======================
On the daily level, gold is hugging the green cloud climbing higher. Price has not broken clear above the cloud meaning that the movement is still one of consolidation. The tenkan-sen lies below the kijun-sen signifying that the rise is subdued.
I would expect a pullback to at least the 1242 area (cloud bottom at 1241.85); this is the first support. This was already discussed in the Daily Analysis posted on Sunday. At the same time, price must not breach the brown support line drawn in the End of Week analysis (circa 1230) for the rebound scenario to occur. To me, this is the final defence for the uptrend. Should this line fail to hold the price drop, then gold is headed way south and the H&S scenario will then kick in.
Folks, I have not abandoned the EW count. On the contrary, all the price movements described are in step with the various EW scenarios. It is just that I’m using price analysis to determine movements on an intraday basis.
(1) The pullback to max 1230 before a HUGE rebound is the Weekly IV scenario playing out. There, the 1230 area is the termination of Minute 2 of Minor 1 before the huge rise in Minute 3.
(2) The drop to max 1230 (Minute 3 of Minor C) before a SHALLOW rebound (Minute 4) followed by the large drop toward 1133 (Minute 5) is the Alternate Hourly II scenario playing out.
(3) If the drop does not materialise yet, but price continues on a sustained rise toward 1276, that is obviously the Main Count, Minute C.
Hope this clarifies.
Thank you Alan X2. Excellent clarification. 🙂
It’s my honour to be of help.
Gold has formed a flat top triangle in 30 min chart. It needs to clear 1257.5 in next few hours.
Watching the action on upside.
Gold is working of inverted HnS.
Watch the NL. It is Lara’s upper gold price point for a game changer once again. If it happens.
Next there is another powerful inv HnS in next post.
GDX bull count
https://www.tradingview.com/x/U3iolBEk/
Dreamer. I love the count.
If this is correct, then it means that gold price should not drop to 1130s, but rather the bottom was already in.
I was deliberating for some time that should gold drop to the 1130s, the miners would sink much more.
From SurfCityCycles: “Based on the breakdown of its 2014 uptrend line, I believe the USD’s 15 Year Super Cycle has topped. If I am correct, this should be bullish for Gold and the broader Commodity complex.”
http://www.talkmarkets.com/content/commodities/us-dollar-cycle-deep-dive?post=135965
The demise of the dollar while it may come slowly, will come surely. Very quietly and mostly unreported in Western media has been the gradual abandonment of the Petro-Dollar by Russia and China. They now conduct oil and other sales between their countries, and other BRIC nations in the local currency, by-passing the dollar altogether. Of course Iran has already been accepting payment in Gold and Euros for their oil, and as one of the few remaining countries not under the boot of the IMF and the Rothschild banksters, bear the wrath and saber-rattling of Nato allied countries. The “nuclear proliferation” whining is nothing but a canard. I don’t know if a final top is in for the dollar. The vast majority of global debt is denominated in dollars, and with the onset of deflation and the accompanying debt destruction, fewer dollars will mean more valuable dollars, at least for a time. We could see both Gold and the dollar rise.
The implosion of Western economies will ultimately force central banks to try and paper over sovereign debt resulting in hyper-inflation…but not quite yet…first deflation.
History says that the USD will lose it’s reign as the world’s reserve currency. The question is when? Likely still many years into the future… now that will be some fireworks in the financial and gold markets.
The loss of reserve currency status will be a devastating blow to the US. If even the rumour of it going to happen is in the air, I’m sure the many foreign buyers of US Treasury bonds will want to cash out. This will cause a downward spiral to the US dollar value. It is akin to a run on banks, this time the Central Bank. To detract from this event, US will very likely start more wars. The stock market and bond market will plunge, and gold will soar to unprecedented heights. Perhaps $5000 will be surpassed then. But then, people would want to buy gold denominated in Chinese renminbi or Japanese yen.
Break from bearish rising wedge with lower wedge line re-test.
Rambus has two interesting charts. Both portend a near-term bearish move. I think a projected move that is very similar, when arrived at by different chart analysis is noteworthy; in this case the possible head and shoulders developing pattern, and the break from a bearish rising wedge with re-test of the wedge underside. Here is the H&S potential. Will post wedge next.
Yep. I think we are headed to the neckline, around 1,235ish. What happens there will be key.
Does the H&S play out toward Lara’s target? -or- will the coiling of the Symmetrical triangle win, causing the H&S to abort and up we go?
See my analysis below on the H&S possibility: time stamped May 21, 7:15 am..
Alan, do you have a preferred count? Does the H&S play out or does gold drop “somewhere between the bottom boundary of the cloud and the support line before taking off like a rocket”?
At the moment, classical analysis still leans towards a drop. The H&S portends a huge drop. I will use the trendline I drew, which is also the neckline, as the final stand. If breached, the huge drop scenario becomes very likely. If it holds, I think the drop is already done. The 1230s area has also many adherents among analysts.
You can read about Symmetrical triangles here if desired. The problem is that an upwards breakout is far from a sure thing. Also, sometimes you get a false breakout and then a reversal…
http://thepatternsite.com/st.html
Here’s GDX
https://www.tradingview.com/x/LkmAnrC6/
I keep looking at the symmetrical triangles in Gold and GDX. There’s a lot of coiling going on and the trend into the triangles is up. Something to watch carefully.
https://www.tradingview.com/x/4ZdHd0Tc/
Dreamer. This gives us hope that the Weekly IV is likely to play out. The possible targets I have are Lara’s 1452 where Primary Y = Primary W, or 1529 where Primary Y = 1.236 * Primary W. The latter is close to what your graph shows.
GSR on watch again. GSR is dropping after a backtest or some fluke run up last week to new high.
This is warning again that both metals will rise with GSR as drops.
Once again I respect the EW counts price points: 1294 and 1214.
Ichimoku Daily Analysis
Data as at the close of May 19
=========================
The daily Ichimoku chart is painting a slightly positive picture. The cloud is still green, with a slight tilt higher, offering some hope for a bullish rebound. But, all is not clear. Prices had attempted to break out of the top cloud boundary only to drop back inside the cloud. A weak attempt was made on Friday, and the market closed with the daily candle peeking just above the top of the cloud boundary. The tenkan-sen is still lying below the kijun-sen, indicating caution remains the constantly nagging heckle. The next week would be telling. If gold does manage to drop back into the cloud and falls below the bottom cloud boundary, then it will trigger a sharp decline. But if price clears the top of the cloud boundary, the shallow retracement on Friday may augur bullishness.
With this lethargic grind upwards on Friday, I feel it is important to remain skeptical of the market movements. Unless stronger momentum asserts itself in the beginning of next week, gravity might take its toll. Together with the looming head-and-shoulders pattern, the inevitable drop might take place sooner than expected. My strategy is watch the bottom cloud boundary, currently at 1241.85, for the first sign of trouble with the bull. I will still go along with the ride up the support line shown in the End of Week Analysis. But once that line is breached to the downside, I will switch to comfortable shorts (pun may be intended as it means a more relaxing time, without the burden of micro-managing price movements).
End of Week Analysis
Data as at the close of May 19
=========================
Gold markets broke out to the upside during the week, slicing easily through the 1250 level. Although a large portion of the gains were given back on Thursday, gold had a slightly positive session on Friday as prices rebounded, grinding higher. The market continues to find buyers underneath as gold is perceived as a bit of a “safety trade”. Corruption problems in Brazil are starting to take headlines, and of course we have the persistent issues with a certain President in the United States. People are just buying a bit here and there to protect themselves.
The brown line drawn on the appended graph could be taken as a mid-term support line. As long as prices lie above the line, gold will continue to go higher. It does appear that the support line forms the neckline of a head-and-shoulders pattern. The right shoulder may have formed at 1265, or it could move a bit higher as Lara’s Main Count suggests. Once the pattern completes, prices should head south to the estimated low of the 1130s. It would provide a good shorting opportunity. However, chart patterns are not cast in stone. Should prices rise above the “head” at 1297.40, the pattern naturally aborts and the Weekly IV scenario would have gained in probability. This setup calls for a drop somewhere between the bottom boundary of the cloud and the support line before taking off like a rocket.
Lara,
Nice analysis. Would you be updating USD Index, it broke down supports? TIA
At some stage this week, yes.