
Another strong downwards day was not expected to break below a support line that extends back to December 2016. Price action today suggests the weekly alternate count, or a variation thereof, now is more likely.
Summary: The outlook is now fairly bearish. Expect a little sideways movement to complete a small correction today, to be followed by another wave down which may be about 13.18 in length. After a new low, then look out for a deep bounce that may offer an opportunity to join the new downwards trend, and it may offer some profit to the upside.
New updates to this analysis are in bold.
Grand SuperCycle analysis is here.
MAIN ELLIOTT WAVE COUNT
MONTHLY CHART
Click chart to enlarge.
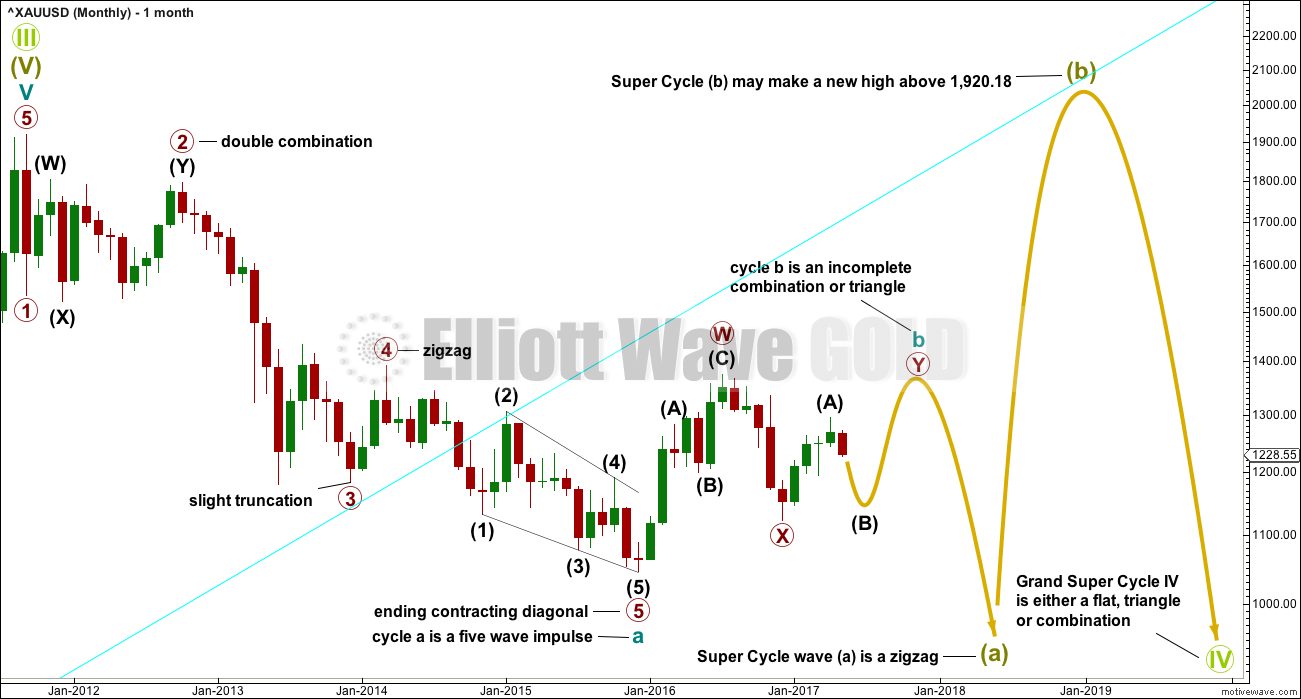
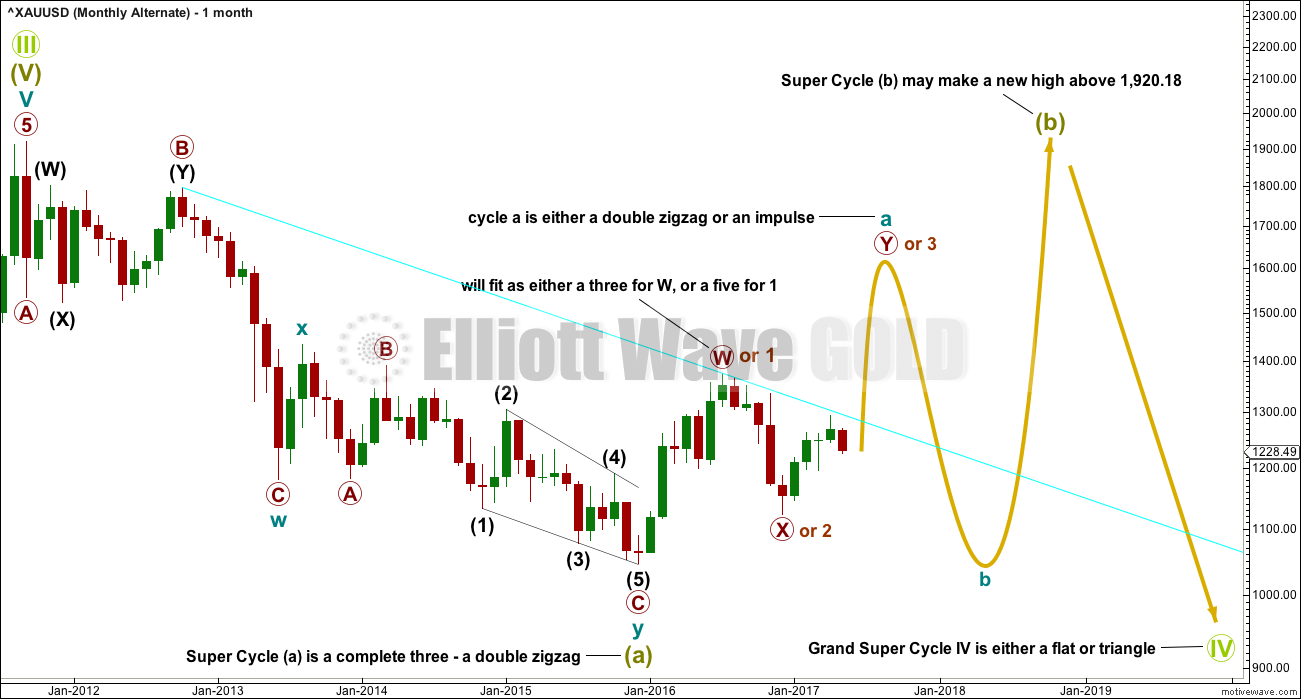
The large downwards wave from September 2011 to December 2015 will fit as a five wave impulse.
Within the impulse, primary wave 3 ends with a truncation. This is acceptable, it came after a movement which may be described as “too far, too fast” for the middle of the third wave.
There is alternation between the double combination of primary wave 2 and the brief zigzag of primary wave 4. Zigzags are usually more brief structures than combinations, so this disproportion is acceptable.
Primary wave 5 is an ending contracting diagonal, meeting all rules for diagonals.
If the downwards wave labelled cycle wave a is a five, then the correction cannot be over there. This also suggests that the correction is a zigzag, or the first wave within it is a zigzag. Because of the expected duration of Grand Super Cycle wave IV, it looks best if Super Cycle wave (a) is seen as an incomplete zigzag.
The problem now becomes what to make of cycle wave b? Three possibilities are presented below in order of probability, labelled I, II and III.
It is most likely that cycle wave b is not over. It looks most likely that the first wave up within it was a zigzag, so cycle wave b may be either a combination, triangle or double zigzag. Due to structure of recent upwards movement labelled intermediate wave (A) subdividing best as a three and very poorly as a five, we can all but eliminate a double zigzag for cycle wave b. This leaves a combination or triangle.
WEEKLY CHART I
Click chart to enlarge.
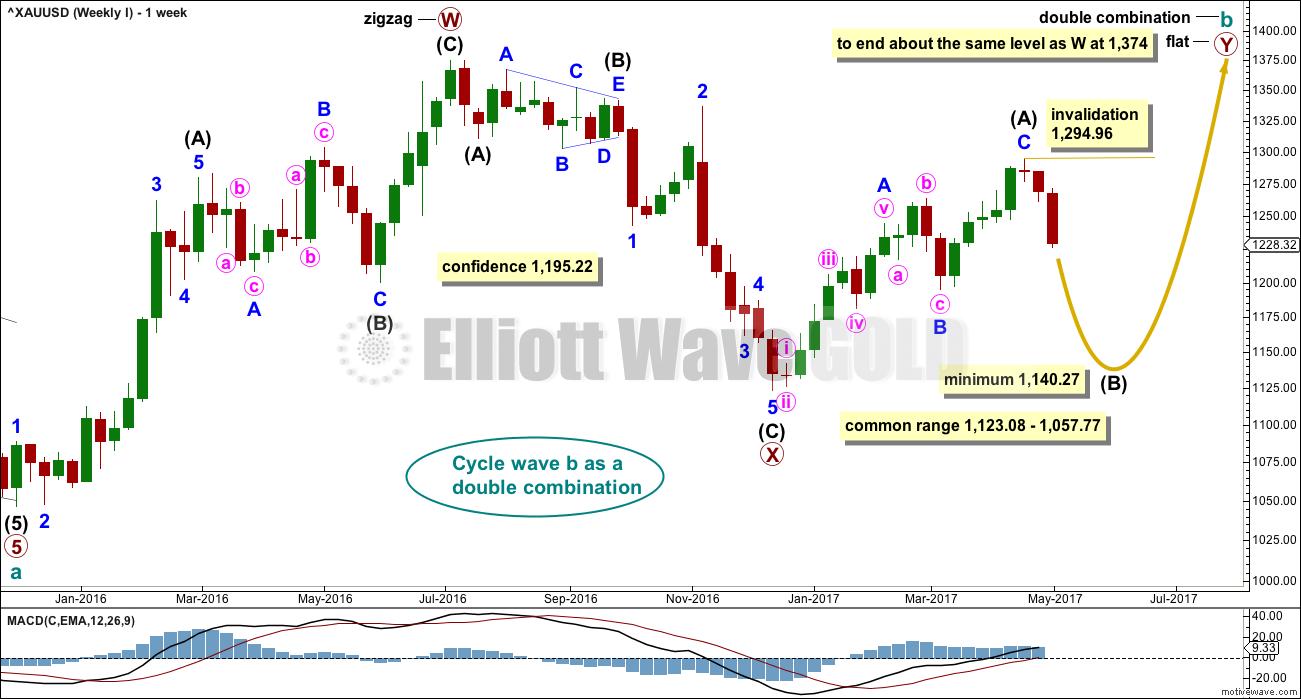
Combinations are very common structures. Cycle degree waves normally last one to several years, and B waves do tend to be more time consuming waves than all other waves. Given these tendencies the most likely scenario at this point may be that cycle wave b is an incomplete double combination.
The first structure in the double labelled primary wave W fits as a zigzag. This upwards movement will subdivide as either a three (zigzag) or a five (impulse). It does have a three wave look to it.
The double is joined by a deep three in the opposite direction labelled primary wave X, which is a 0.77 depth of primary wave W. X waves within double combinations are normally very deep; this one looks right.
The second structure in the combination may be either a triangle or a flat correction. Both of these structure have A waves which subdivide as threes.
At this stage, the upwards wave from the low in December 2016 does now look best and subdivide best as a completed zigzag. This may be intermediate wave (A) of a flat correction or a triangle. Because a triangle for primary wave Y would look essentially the same as the second weekly chart below, only a flat correction is considered here. The most common two structures in a double combination are a zigzag and a flat.
This wave count follows the most common scenario and has the best fit.
Within the flat correction of primary wave Y, intermediate wave (B) must retrace a minimum 0.9 length of intermediate wave (A) at 1,140.27. The most common length for intermediate wave (B) is from 1 to 1.38 times the length of intermediate wave (A), giving a common range from 1,123.08 to 1,057.77.
Intermediate wave (B) may subdivide as any corrective structure, but the most common structure for B waves within flats is a zigzag. At this stage, on the hourly chart it looks like a five down is almost complete, which would indicate intermediate wave (B) is a zigzag subdividing 5-3-5.
The daily and hourly charts will follow this weekly chart. That does not mean the other two weekly charts aren’t possible, they are, but the number of charts must be kept reasonable on a daily basis.
WEEKLY CHART II
Click chart to enlarge.
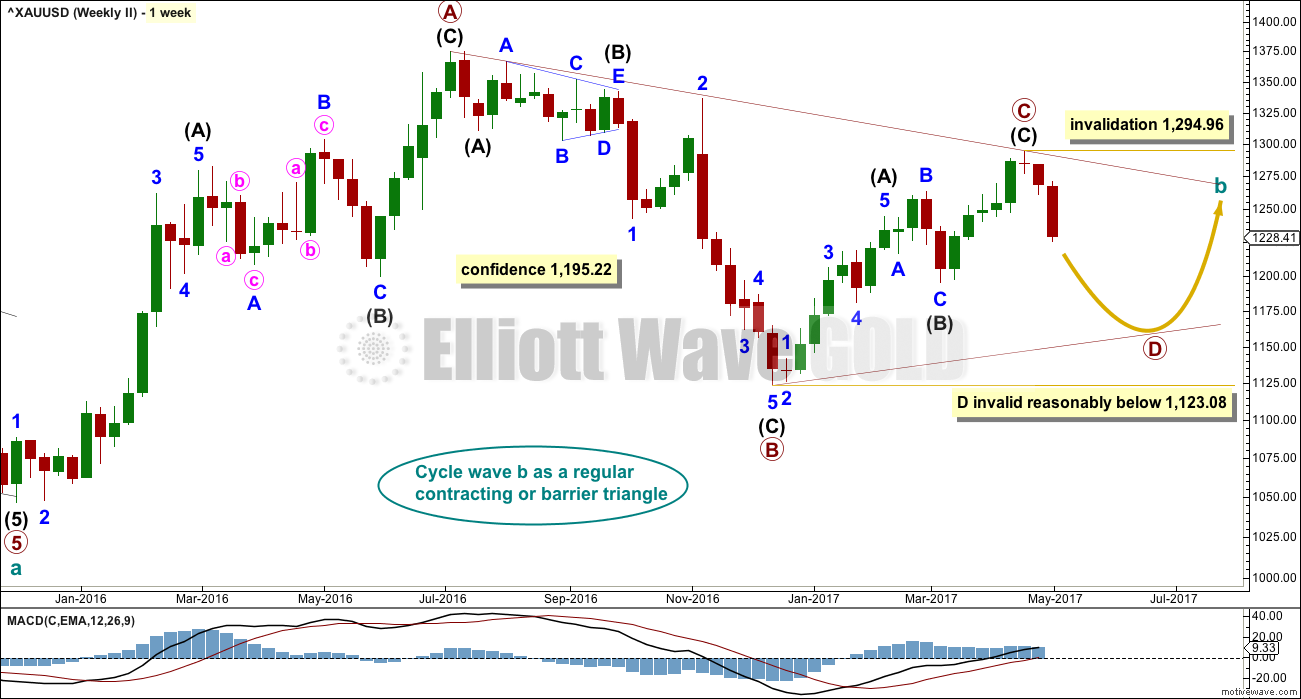
What if cycle wave b is a triangle? This is also entirely possible. Triangles are not as common as double combinations, but they are not uncommon. This wave count will be followed but not published daily. If it begins to diverge from the first weekly chart, then it will be published daily.
Within the triangle, primary waves A, B and C are all single zigzags. One of the five subwaves of a triangle normally subdivides as a more complicated multiple, usually a double zigzag. This may be what is unfolding for primary wave D.
Primary wave D of a regular contracting triangle may not move beyond the end of primary wave B below 1,123.08.
Primary wave D of a regular barrier triangle should end about the same level as primary wave B at 1,123.08, so that the B-D trend line is essentially flat. What this means in practice is that primary wave D may end slightly below 1,123.08 and the triangle would remain valid. This is the only Elliott wave rule which is not black and white.
Thereafter, primary wave E should unfold upwards and would most likely fall a little short of the A-C trend line. If not ending there, it may overshoot the A-C trend line.
WEEKLY CHART III
Click chart to enlarge.
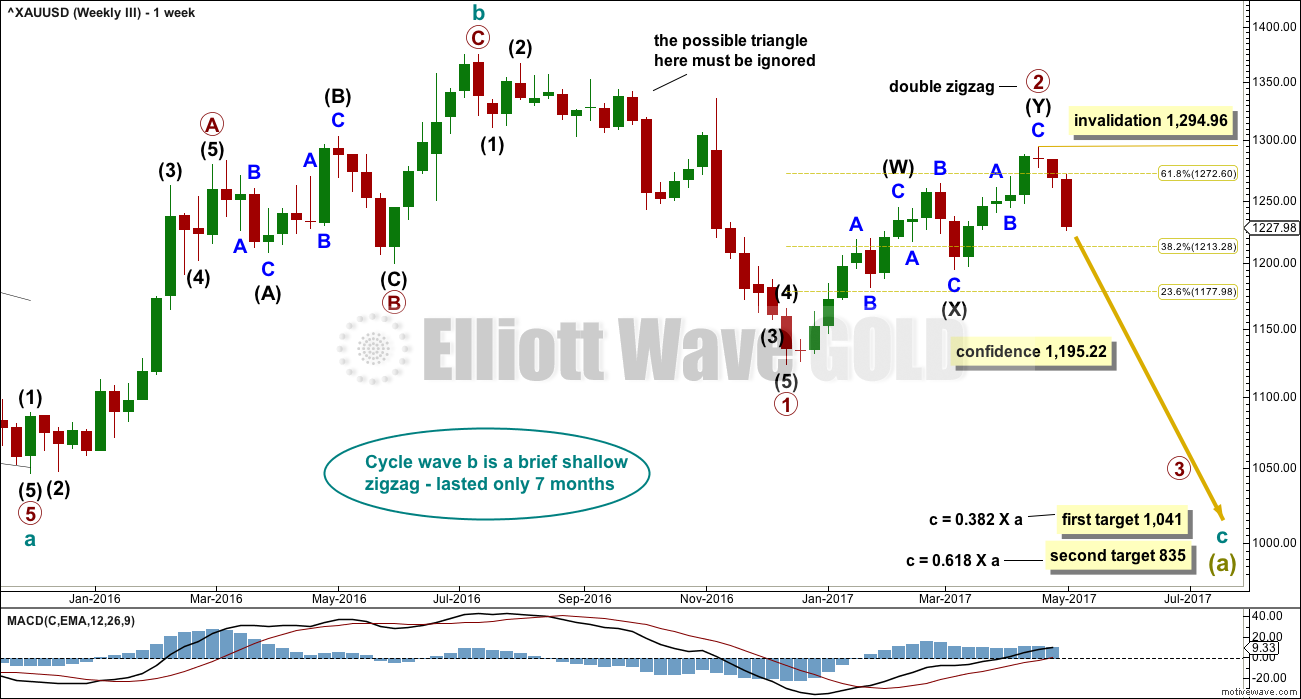
It is possible that cycle wave b is a complete zigzag, correcting to 0.376 the depth of cycle wave a.
If this is correct, then cycle wave c downwards has begun.
Cycle wave c must subdivide as a five wave structure and it would be extremely likely to make at least a slight new low below the end of cycle wave a at 1,046.27 to avoid a truncation. Two targets are given for cycle wave c.
Cycle degree waves usually last one to several years. Here, cycle wave b may have lasted only seven months and would be more brief than cycle degree waves usually are. However, flexibility is essential regarding B waves. They do exhibit a huge variety, so all possibilities must be considered.
This weekly chart has a lower probability due to the brevity of cycle wave b. It also must ignore what looks like a triangle (noted on the chart) because intermediate wave (2) may not be seen as a triangle. This also slightly reduces the probability of this wave count.
DAILY CHART – DETAIL
Click chart to enlarge.
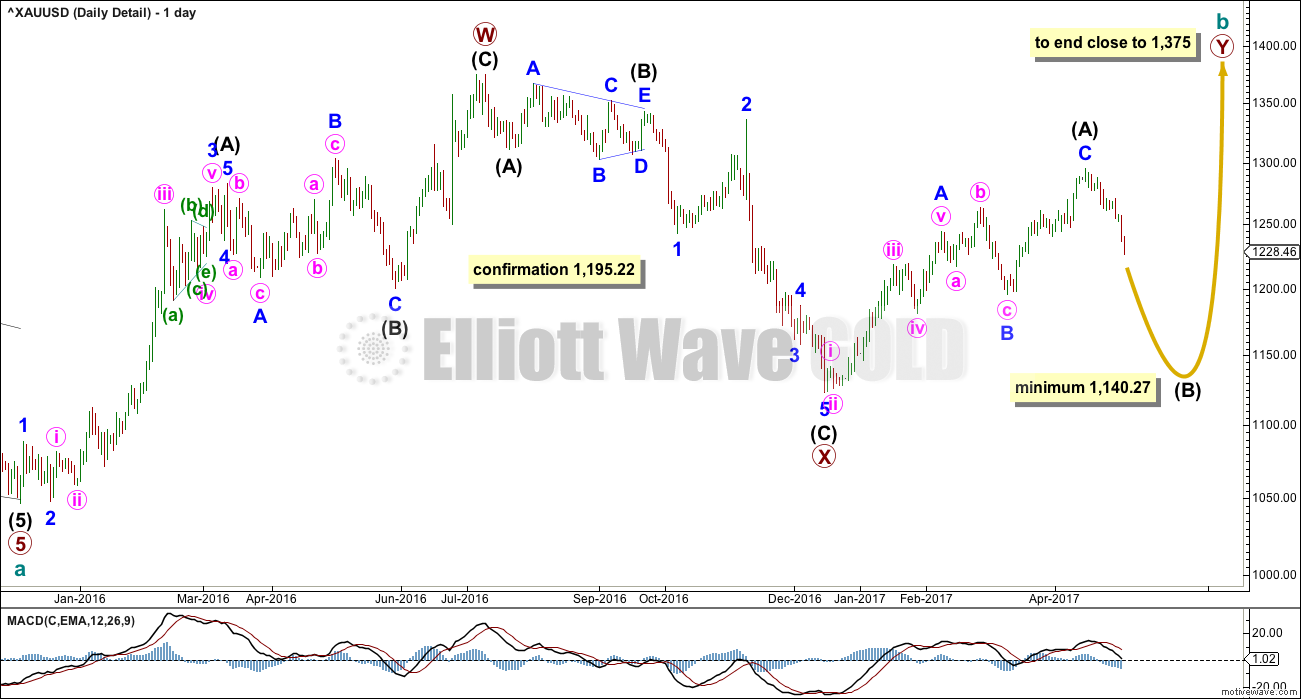
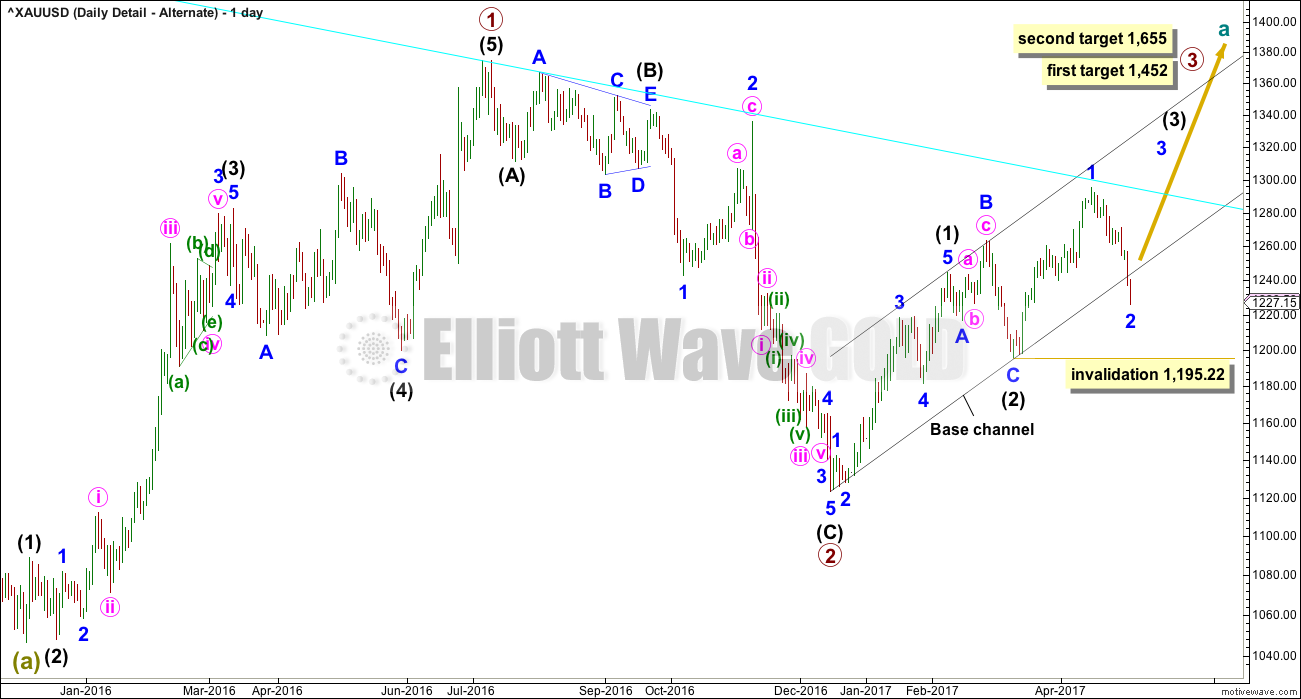
The upwards wave labelled here primary wave W will fit neatly as a zigzag.
The downwards wave labelled here primary wave X does fit best as a zigzag. This allows a triangle to be seen in the position labelled intermediate wave (B).
Now the upwards wave from the low of December 2016 to the last high on the 17th of April fits best and looks like a zigzag. This indicates primary wave Y is most likely subdividing as a flat correction.
DAILY CHART
Click chart to enlarge.
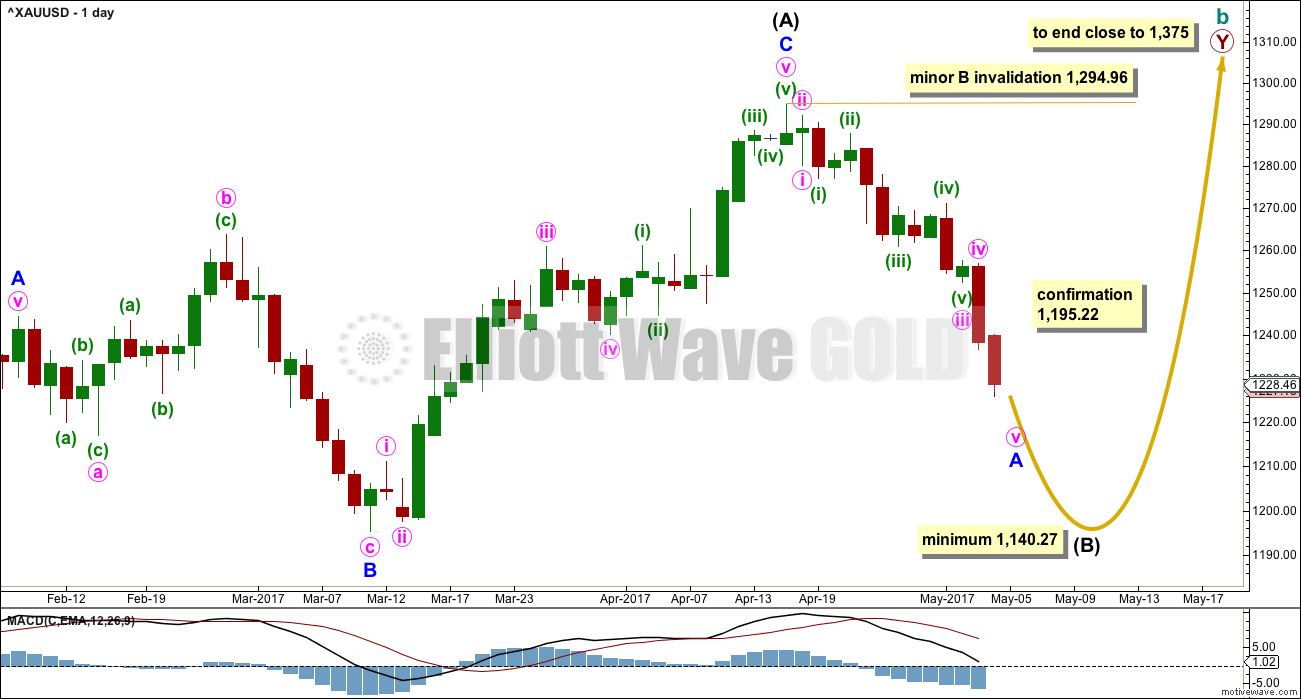
Within the flat correction of primary wave Y, intermediate wave (B) must retrace a minimum 0.9 length of intermediate wave (A) at 1,140.27. The most likely corrective structures to achieve the deep correction required for B waves within flats are single or multiple zigzags. These begin with a five, then a three in the opposite direction. So far a five down looks close to completion; when complete, it should then be followed by a three up.
Minor wave B, when it arrives, may be deep but may not move beyond the start of minor wave A above 1,294.96.
When minor wave A is complete and is confirmed so by a breach of the channel on the hourly chart, then the 0.382 and 0.618 Fibonacci ratios will be used as targets for minor wave B.
When minor waves A and B are complete, then a target may be calculated for minor wave C downwards to end the zigzag of intermediate wave (B), using the Fibonacci ratio between minor waves A and C. That cannot be done yet.
A new low below 1,195.22 by any amount at any time frame would invalidate the alternate wave count below and provide confirmation of this main wave count (all three weekly versions of it).
2 HOURLY CHART
Click chart to enlarge.
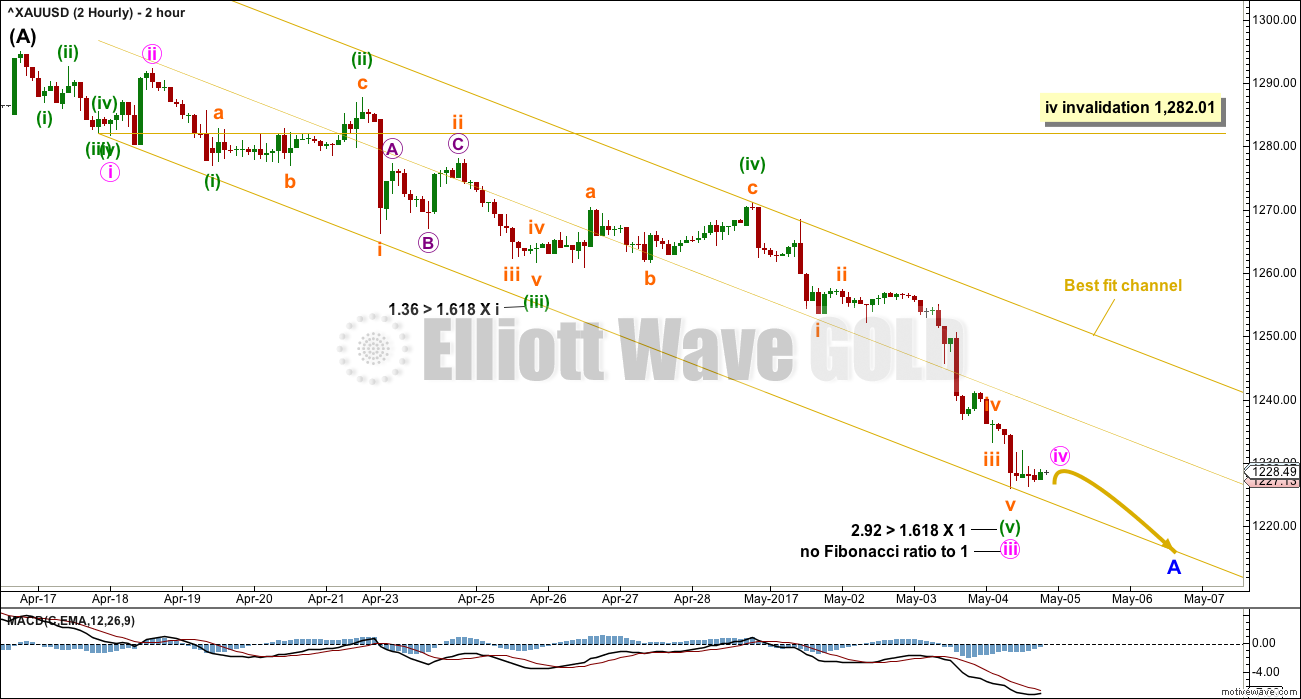
This downwards movement so far looks very much like an impulse. Fibonacci ratios at minute and minuette degrees are noted.
A small correction for minute wave iv may be unfolding today. So far it looks like a small triangle. When it is complete, then a final fifth wave down may unfold.
Because it is not known where minute wave iv ends and so where minute wave v begins, no target may be calculated for minute wave v to end minor wave A. Minute wave v would most likely be about equal in length with minute wave i, which was 13.18.
The best fit channel is very important. Add a mid line. Expect price to continue down while price remains within the lower half. When price breaks into the upper half, it would most likely be the end of minor wave A and the start of minor wave B. A breach of the upper edge of the channel would provide strong indication that minor wave A is over.
Minute wave iv may not move into minute wave i price territory above 1,282.01. However, Gold’s fourth waves are typically very shallow; minute wave iv is not expected to get anywhere near the invalidation point.
HOURLY CHART
Click chart to enlarge.
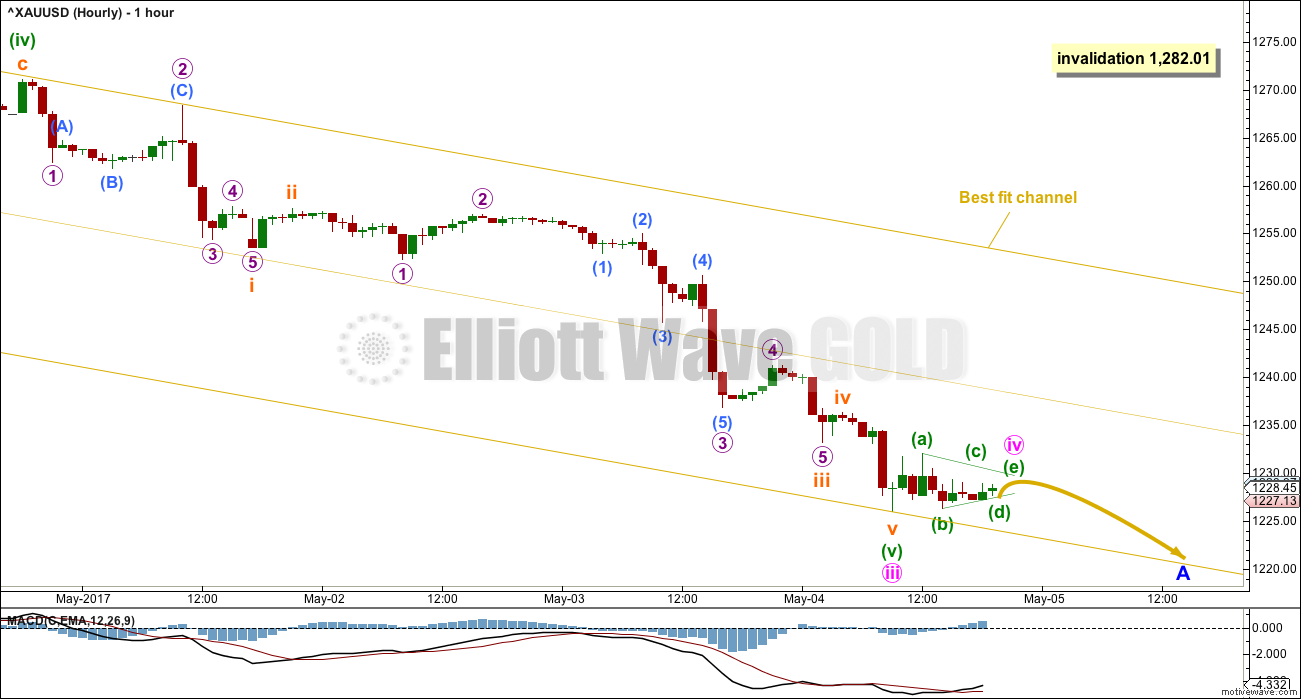
This hourly chart shows more detail of the end of minute wave iii.
If members are choosing to enter short here, then stops may be placed just above the mid line of the channel. Understand though that the short side may be somewhat limited: the next wave down may be only just a bit longer than $13. The risk / reward ratio may not be acceptable to all traders.
Gold often exhibits swift strong fifth waves, but this is much more common for its fifth waves to end third wave impulses and not very common for its fifth waves to end A wave impulses. Minute wave v may be a strong extension, but that is not very likely.
ALTERNATE MONTHLY CHART
Click chart to enlarge.
Up until today this was the main wave count, but today it is switched to an alternate.
It is possible that Super Cycle wave (a) is already complete as a double zigzag. This downwards wave has a very good fit as a double zigzag and the problem of a small truncation on the main wave count is avoided.
If the first wave of Super Cycle wave (a) is a three, then Grand Super Cycle wave IV may be either a flat, combination or triangle. It may not be a zigzag.
However, a combination may be eliminated if the first wave is a multiple. The maximum number of corrective structures within a multiple is three, so to label multiples within multiples increases the number of structures beyond three and violates an Elliott wave rule.
Grand Super Cycle wave IV may be only a flat or triangle. Within both of these structures, Super Cycle wave (b) may make a new high above the start of Super Cycle wave (a) as in an expanded flat or running triangle. Super Cycle wave (b) would be very likely to be a very deep correction. It would most likely be a zigzag to achieve the depth required for a flat correction, but it may also be an expanded flat. If it is a zigzag, then cycle wave a would have to subdivide as an impulse.
ALTERNATE WEEKLY CHART
Click chart to enlarge.
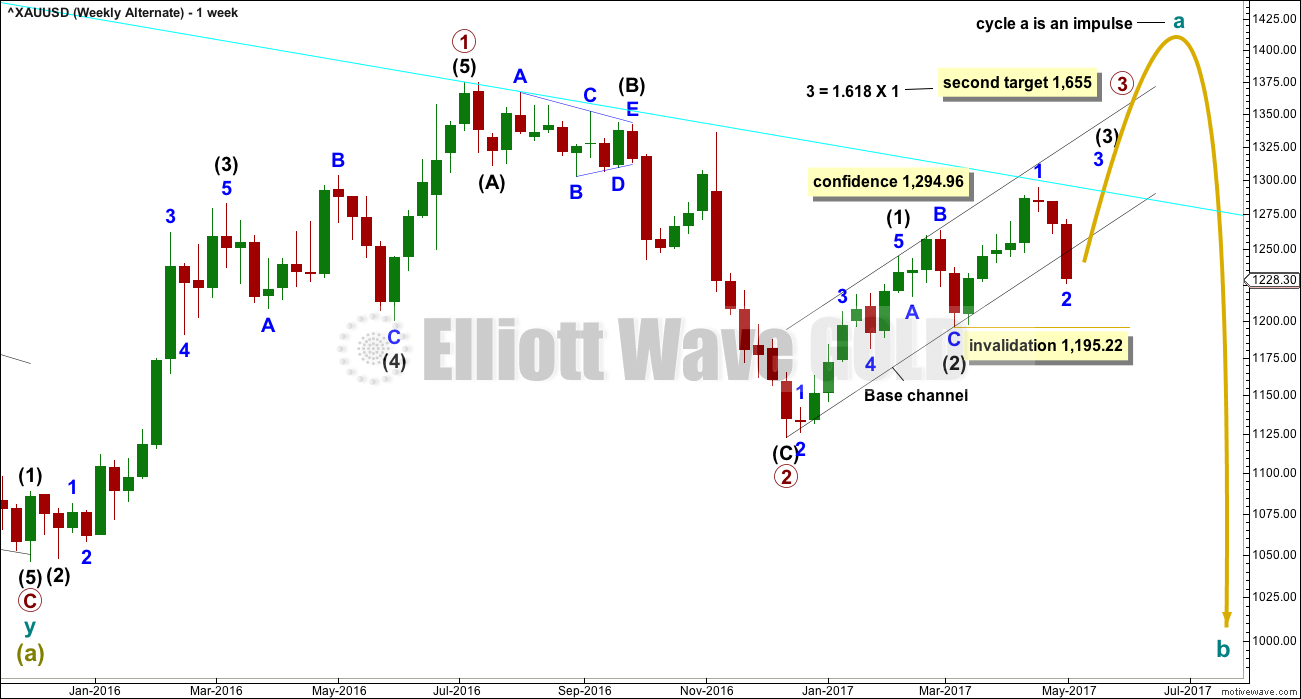
If cycle wave a is subdividing as an impulse, then it should now be entering the middle of its third wave. The strong breach of the lower edge of the base channel substantially reduces the probability today that a big third wave is imminent.
It does not have a good fit to try and see intermediate wave (1) over at the high labelled minor wave 1; to see the upwards wave from the low in December 2016 to the last high in April as a completed five wave impulse is very forced. I would not want to publish such a wave count; it would be publishing what is wanted not what looks right.
SECOND ALTERNATE WEEKLY CHART
Click chart to enlarge.
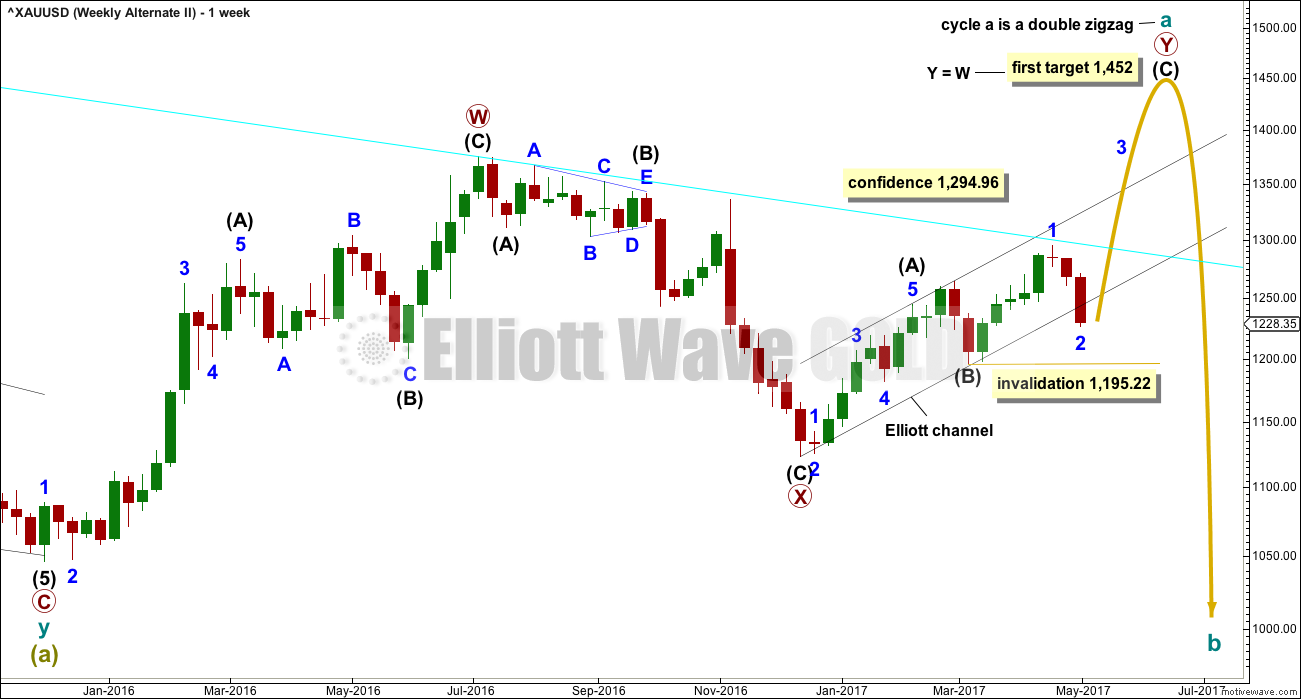
It is also possible that cycle wave a is subdividing as a double zigzag. The upwards wave from the low of December 2016 may be the second zigzag in a double.
The problem here is not a base channel, although it is drawn the same. The problem here is price has now substantially and clearly broken below the lower edge of the Elliott channel, which should provide strong support for primary wave Y as it moves higher.
Although technically cycle wave a could be labelled as complete at the April high, that would look very wrong. The purpose of the second zigzag in a double is to deepen the correction when the first zigzag does not move price deep enough. This second zigzag has not reached beyond the end of the first. This would not correctly be termed a truncation but the effect is the same. Here, it would be too severe for reasonable consideration.
ALTERNATE DAILY CHART – DETAIL
Click chart to enlarge.
There is now a full daily candlestick below and not touching the lower edge of the base channel (or Elliott channel). This daily candlestick is a clear strong downwards day, not at all sideways. This now substantially reduces the probability of this alternate wave count.
This wave count will remain technically valid while price remains above 1,195.22. It will be followed but not published again on a daily basis.
TECHNICAL ANALYSIS
WEEKLY CHART
Click chart to enlarge. Chart courtesy of StockCharts.com.
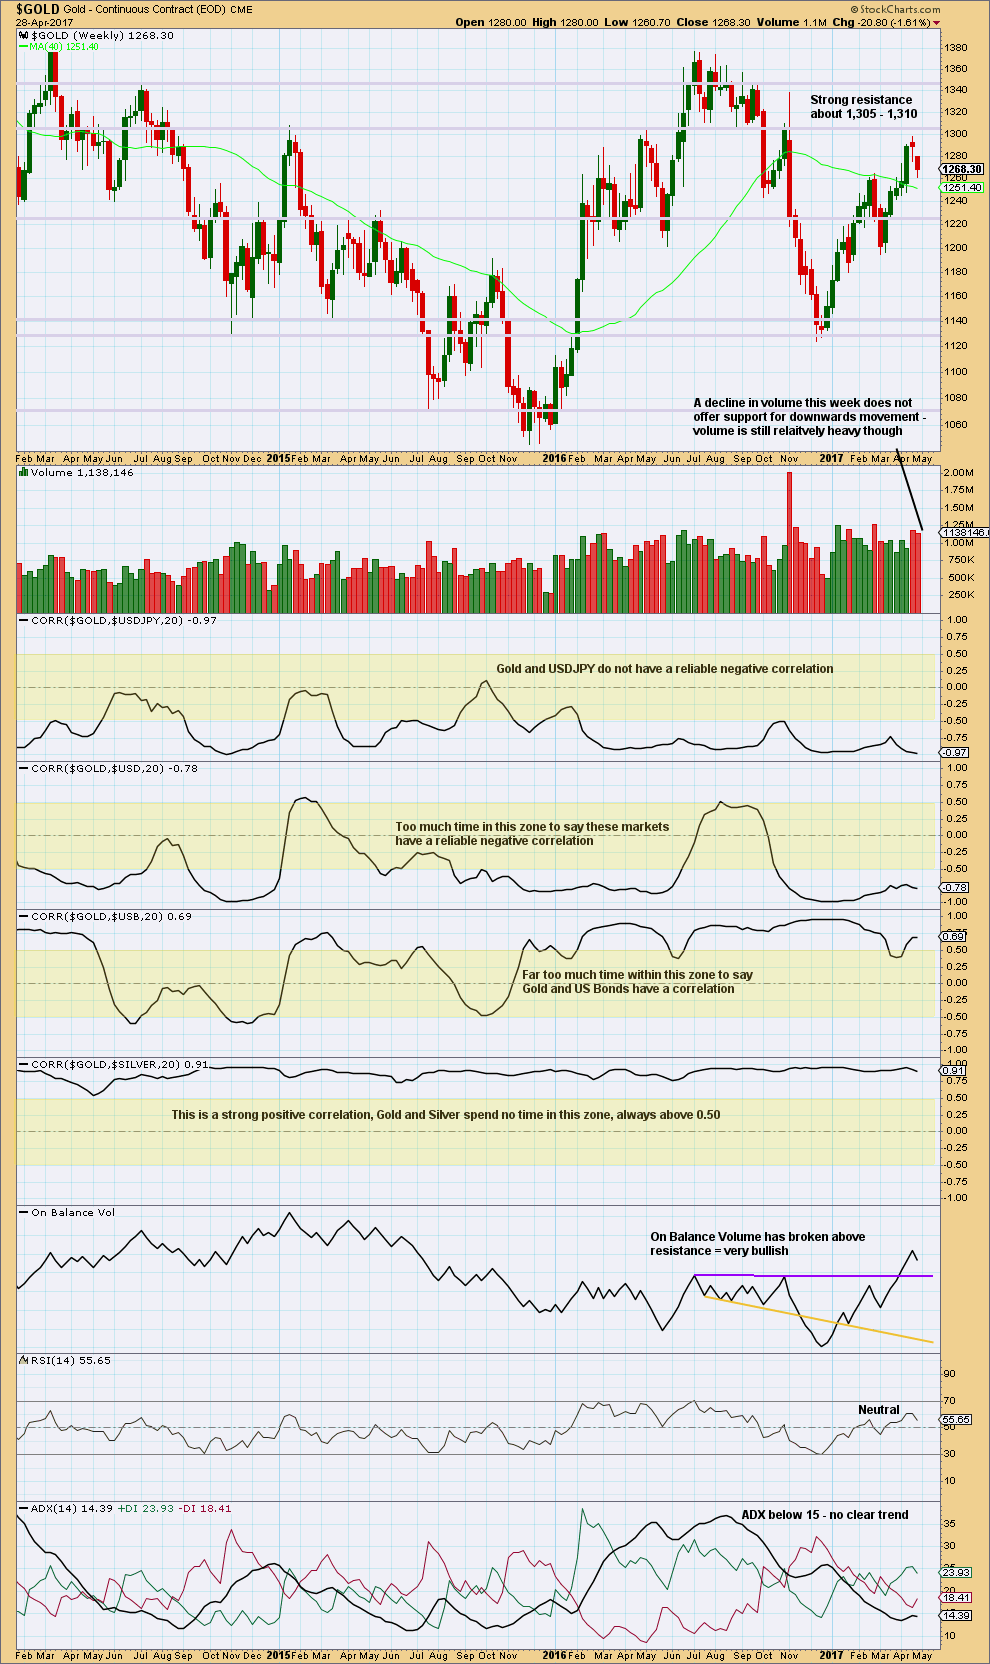
There are a lot of assumptions out there about Gold and its relationships to various other markets. Happily, there is a quick and easy mathematical method to determine if Gold is indeed related to any other market: StockCharts have a “correlation” option in their indicators that shows the correlation coefficient between any selected market and the one charted.
The correlation coefficient ranges from -1 to 1. A correlation coefficient of 1 is a perfect positive correlation whereas a correlation coefficient of -1 is a perfect negative correlation.
A correlation coefficient of 0.5 to 1 is a strong positive correlation. A correlation coefficient of -0.5 to -1 is a strong negative correlation.
Any two markets which have a correlation coefficient that fluctuates about zero or spends time in the 0.5 to -0.5 range (shown by highlighted areas on the chart) may not be said to have a correlation. Markets which sometimes have a positive or negative correlation, but sometimes do not, may not be assumed to continue a relationship when it does arise. The relationship is not reliable.
For illustrative purposes I have included the correlation coefficient between Gold and Silver, which is what strong and reliable correlation should look like.
Volume for last week suggests the downwards movement is a pullback, and it may still continue further as volume remains fairly heavy.
Gold has made a series of higher highs and higher lows since the low in December 2016, the definition of an upwards trend. Assume the trend remains the same until proven otherwise.
This weekly chart still remains mostly bullish with some neutrality.
DAILY CHART
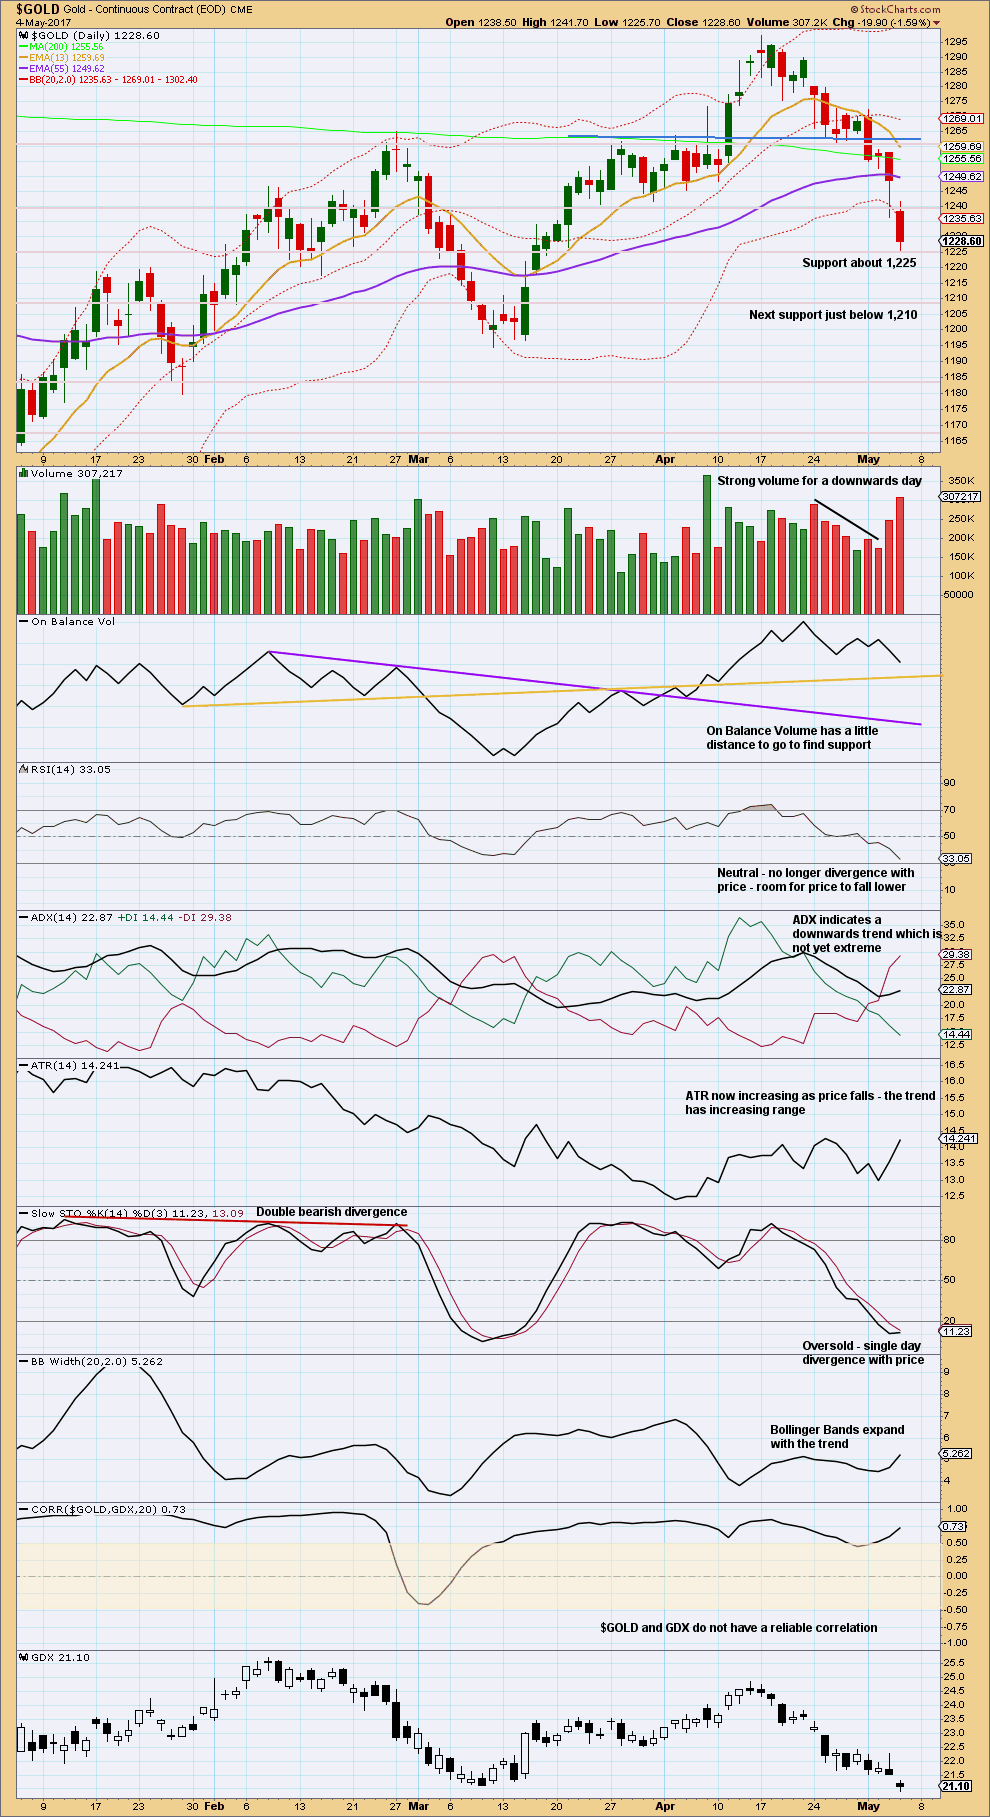
Click chart to enlarge. Chart courtesy of StockCharts.com.
A strong gap down below prior support at 1,240 is bearish. The increase in volume is bearish. This could be either a selling climax, or a strengthening downwards trend.
On Balance Volume is looking less bullish and may find support at the yellow line.
If RSI reaches oversold and then exhibits divergence with price, then we should expect a low is in. That is not the case yet.
This chart is looking very bearish.
GDX
DAILY CHART
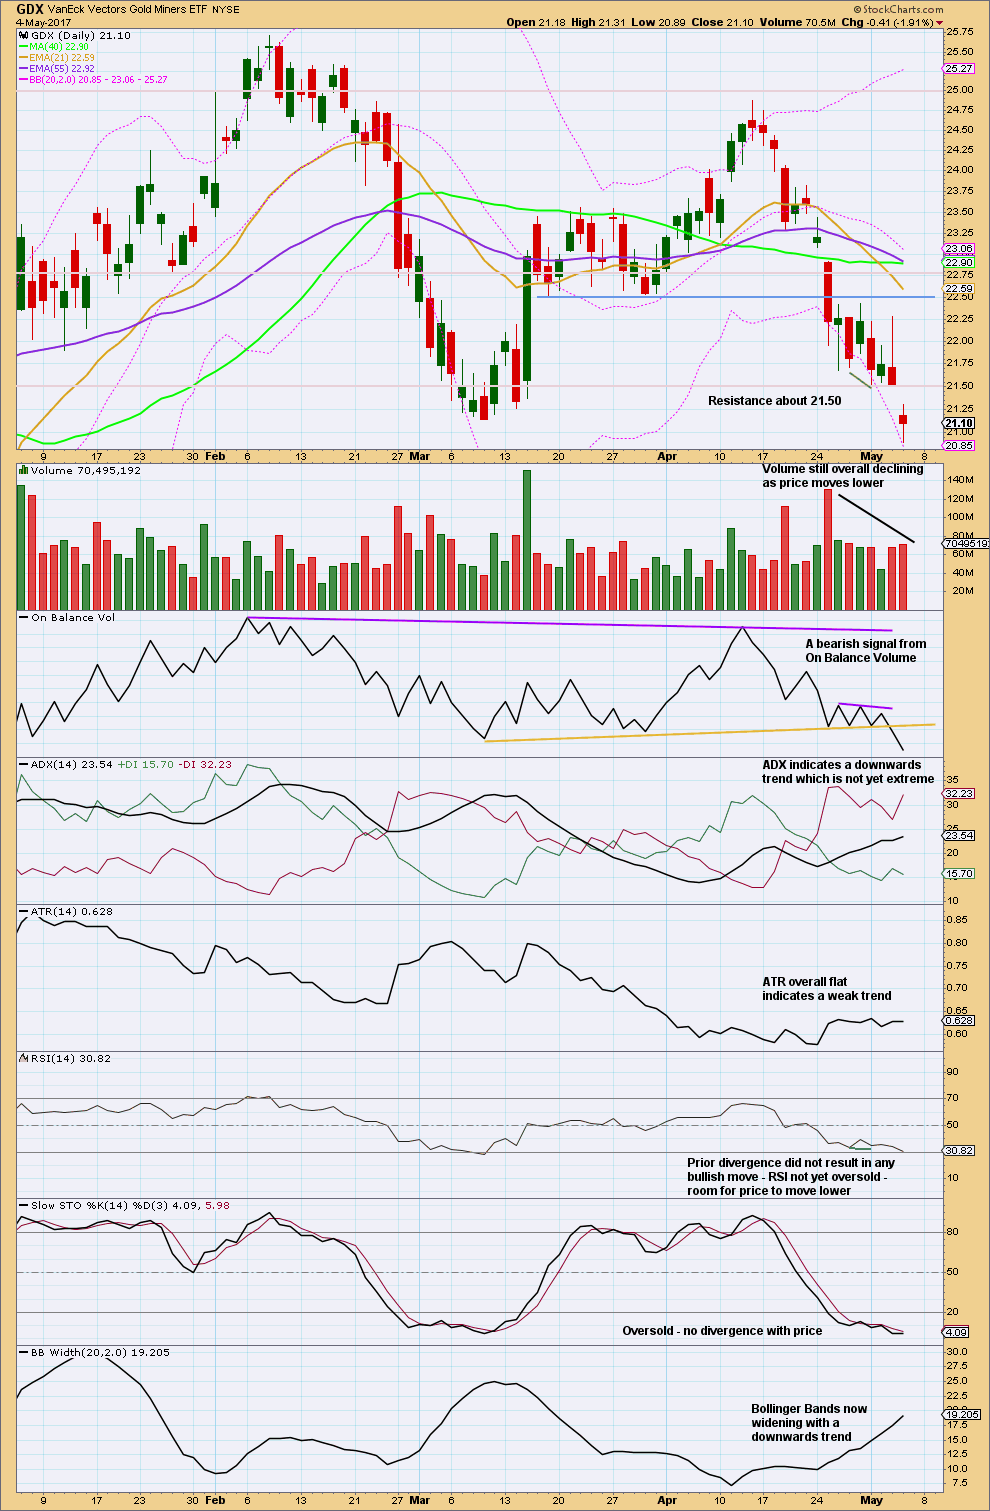
Click chart to enlarge. Chart courtesy of StockCharts.com.
This chart is still very bearish. The only concern would be flat ATR not supporting the trend.
A new low below the low for the 9th of March is important.
The gap down today may be a breakaway gap from a prior small consolidation. Using the measured rule gives a target about 17.94. If this gap is a measuring gap, it should offer resistance; measuring gaps are not normally closed for the short nor mid term. If the gap is closed, then it would be correctly labelled an exhaustion gap. If that happens, expect the downwards trend is over for now.
This analysis is published @ 10:09 p.m. EST.
Test of patience with an inside day. Resilient bulls with 1225 holding so far. Sentiment: Bearish with a likely rally for Monday 1234/43 limiting; pullback for the week expecting, bring me another bear, lets short this and look for value in 1216-1208 range possibly down to 1199. // Better to follow the technical and other analysis of the experts, I am just a frisky bear for now; time-price changes everything on the spin of a coin // GL folks!
What’s up with the strange pop of futures in SPX into the close?
I was literally in the process of rolling some upside hedges on SPY when the chains exploded like fireworks a minute or two before the close. Now futures up 12 handles!
Wassup wid dat? Macron won already?! Have a great and restful week-end everybody. As the lady said, if you are in Oil, hold onto your shorts! 🙂
There are some very ominous signs in the oil market. A failed top (that also looks like a massive head and shoulders pattern). A series of daily declines that decisively breaks previous support. A “one-day-wonder” rally that signals “all clear”.
The COT report is still bearish, with expanding open interest during the price decline…this is bearish.
If the oil rally fails Monday/Tuesday, then you might see sub $40 very quickly. With that, I think all markets suffer near-term.
I purchased some near-term USO puts expecting at least a test of the overnight CL_F lows.
That multi year H&S pattern can be seen throughout the entire commodities complex. It heralded the end of a 30 year cycle.
Good morning everybody. Again, thanks all for your patience this week.
Looking at the larger picture Gold still has higher highs and higher lows from the December 2016 low. So until 1,195.22 is taken out that is the definition of an upwards trend.
My revised weekly charts though now expect it is in a larger downwards trend and will take out 1,195.22, but along the way down there’s going to be a B wave bounce.
The structure of this wave down still looks like the last fourth wave needs to finish, then a fifth wave down should follow. The fourth wave is showing up with a small range green daily candlestick, a long upper wick on it is bearish.
Updated hourly chart:
Minute iv looks done, finding resistance about the mid line of the channel. It looks like it may have been a zigzag, but it could’ve also been a regular flat.
Anyway, now we can have a target for minute v. If the target is wrong it may be not low enough.
Within minute v no second wave correction may move beyond the start of it above 1,235.52. So any shorts may set stops close now, just above that point. If price breaks above 1,235.52 it would now have to move back into the upper half of the channel, that would be a strong warning that a low may be in. Price breaking above the upper edge of the channel would offer good confidence that a low is in and a bounce has arrived.
Interesting. Apparently rumor has it that part of the reason for the PM sector meltdown is liquidation to meet margin calls on long oil positions that blew up…funny how related these things all are…
Watch the weekend read once today’s report is posted by Lara.
Looking at the EW picture today, the high of 1235.52 ought to be Minute 4 in the Main Count. We are now in the 4th wave of Minute 5. A minor drop would end Minute 5, and it would be a sizeable retrace in Minor B. Really adventurous guys might want to buy into that rally.
The targets would definitely change, but as an estimate, if you look back at the posted Daily Ichimoku chart, the resistance levels are currently 1252.85 (blue tenkan-sen), 1257.20 (upper cloud boundary) and 1261.55 (red kijun-sen) respectively.
Happy trading guys. I am setting an alarm for when the bottom is reached today, and nibble into Minor B. Other than that, I’ll just call it a day.
Have a great weekend Alan, and thank you again so much for sharing your charts and expertise.
I agree, that area about 1,257 – 1,260 is now going to be good resistance.
I was thinking of all the shenanigans the banksters have been pulling to keep the market afloat. Is it possible that now that they have juiced the pairs trade of short the Yen and Volatility and buy equities for all they are worth, they have now turned their attention to another fairly liquid market that was experiencing the beginnings of a nice uptrend – Gold and Silver? You’ve got to admit, this decline was a bit un-natural in its persistence and ferocity. especially Silver. Just wondering out loud… 🙂
The commercial short positions in Oil is absolutely massive. Black Gold has a very long wave to fall it would seem, very much in keeping with the EW count.
BTW, if the above theory is right and precious metals and miners execute a reversal near term, the markets are going to fall and fall hard…boy are they going to fall…!!
Primary 4 for the S&P maybe?
My thinking exactly! 🙂
My only wonder was that I would expect it to begin with an impulsive five down but I think P2 was already a Zig Zag so we should see some alternation I would expect.
I guess we could get an impulse at less than intermediate degree….
GDX made a lower low than the 3-9 low with positive RSI divergence. Now back above the 3-9 low so the big boys shook out the weak longs so they can rally it up without them?
Of course! What else? 🙂
I am glad I hedged. When you do it right you can do as well as if the uptrend continued without a hiccup.
I did not surrender a single share in my long term trading account!
We will probably see another spike down in the miners to spook any early birds just for good measure! lol!
Nice chart David. GDX may have bottomed today, but we need to see upside follow-through for confirmation. Downtrend channel is not broken yet to the upside.
OK people, if you are smarting from any Gold trade bruises Oil is probably in a corrective three wave move against the larger down-trend. You know what to do! 🙂
Keep an eye on the Oil analysis, I’ll be posting a chart in comments there.
I’ve set a trailing stop now to hold onto profits.
For those of you who like the fractal nature of gold, do note the Ichimoku cloud structure at the start to the middle of March, and the past two weeks or so. The pattern looks strikingly similar. (The RSI 14 also is identical in both cases, not shown as I can’t get both in the same graph). Note what happens to the price. In March, price rose from 1123 to 1295. The bulls among us would hope that history repeats itself.
I am watching JDST carefully. It just moved back below its upper BB and is printing a red candle today. A new or slightly higher high on Monday with a close back under should present an opportunity for a quick long trade on both the metals and the miners methinks…that price action is typical of fourth and fifth wave completions…
Middle of Mar correction from top was 5% and today the correction from top is 5.5%.
Two corrections of small % on way up is bullish. That is how gold behaves in bull trend.
Good stuff! Thx for sharing, Alan!
Market reaction to the 211K jobs report muted. More pressure on Yellen to hike. Maybe market getting nervous? After all the sluggish first quarter GDP means we could already be starting a recession.
The construction market is starting to boom in the US. No way we are heading for a recession anytime soon.
Verne. In economics, a technical recession is defined as one in which there are two consecutive quarters of negative economic growth. So, perhaps the US is not yet primed for one. However, there are economists who think the US is headed for one within two years of Trump’s presidency.
On a side note, the latest data indicate that one is looming in Singapore.
Yes indeed Alan. That is the reason I said “starting”, as the numbers are always backward looking. Considering our penchant for revising previously reported numbers, who knows…? 🙂
Recession — yes it is coming in a few qtrs. Funny part is that a lot of the new wall street darlings have never witnessed a recession since going public (Facebook etc)
A friend of mine who owns a very successful business in town just told me he had moved everything into the FANG stocks. I just about spewed my coffee but bit my tongue. I never mix business and pleasure! 🙂
OK here is how I am positioned for the week-end. I was going to do a simple options straddle but I figure I would let them pay me instead so I opted for an Iron Condor on SPY – 240/241 call spread, 237/238 put spread. Yeah, I know its boring but what the heck; let’s see what unfolds without loosing too much sleep…If things take off like a bat out of you-know-where on Monday one can easily make adjustments on the fly…. 🙂
Just plain TA for gold.
An inverse Head and shoulder just under the major resistance line. In order to break that s/r line it needs lot of energy.
Lets see what happens???
There is lot of positive energy here on this wonderful forum.
There sure is 🙂 Positive energy that is.
Sometimes I think I should be paying you guys for the work you do and knowledge you share here.
We sure are stronger together.
I’m amazed at the depth of knowledge and experience here, I learn from you all too. And I thank you all very much for your kindness and decency, especially when I get it so wrong like I did this week.
It makes me hunker down and work harder to get it right.
No, Lara. I for one do not blame you for getting the count wrong. Like I said, each one of us have to do our own due diligence. We can’t depend too much on any one analysis to place our trades. Every count is an exercise in probability, an attempt to unravel the true nature of the price movement, an effort to make sense of what is actually happening. Judgement calls we do make, using the best interpretation of whatever information that we have. If anyone is too lazy to attempt any of these, he has only himself to blame.
Thanks Lara.
No you do not get it wrong. What I like is your discipline of applying EW rule and guidelines to the analysis without any bias for bearish/bullishness.
If correction for RS is same as LS than low should be 1219. Which fits well with your wave v target.
I love it.
While your chart has an inverse H&S, I can also see a big regular H&S too.
Will look at that on the weekly chart today for Gold.
People. The NFP report is due at 8:30 am, 15 minutes from now. It could provide an accelerated impetus for prices to move forward. I will give an update after the market opens if there are major upheavals.
You are absolutely right Papudi ! The negative energy has left this forum, You know, Verne showed up about the same time John left, now that was a great trade!
Ha ha. Talking of a change in trend.
Awww… Shucks!! You are too kind! 🙂
As Verne said, the NFP report seemed to be a non-event. Prices only moved very slightly, nothing violent. I guess with the jobs figure surpassing estimates, the buoyant economy is a given. Along with a strongly alluded-to rate hike in June, plus the silence over the asset allocation, gold had already been pummeled.
So, on the fundamental level, I think that we would need some strong push to send gold up again, things like increasing geopolitical tension (read Le Pen win, North Korea flare up), inflationary environment, withdrawal of a rate hike. The longer these are lacking, the more daring the bear becomes.
Speaking of the Le Pen situation , could it be that we are seeing the proverbial calm before the storm? 500 year cycles would actually presage a Le Pen win and the reverberations would be global. If she wins, Juncker is literally going to have to invade France to keep them in the EU. This is one of those situations where holding a straddle going into the weekend is a no-brainer. There will be fireworks – a relief rally based on false hopes that all will be well, or……RUN FOR YOUR LIVES!!!! (in Olga’s case as if her hair were on fire!) 😀
But seriously. if she wins the EU is finished. If she looses, it will take a bit longer.
Ichimoku Hourly Analysis — data as at 7:59 am ET today
The hourly chart shows that:
(1) The cloud is red, meaning that the bear is gaining traction.
(2) Price had fallen below the cloud earlier today, meaning the bear is now established. The bearish trend is now strong. I would say the bear is now firmly entrenched, unless price decides to re-enter the cloud.
The current status is that the blue tenkan-sen had crossed above the red kijun-sen. Price is trying to rise, and this may be interpreted as a backtest after the bearish breakout. The bottom boundary of the cloud, the green senkou span A should provide strong resistance. It is currently just above 1240, and so this is the price point to watch today. A break above would mean another period of consolidation (yawn!). Failure to do so would mean a good opportunity to short.
Happy trading, folks.
Alan,
How did you managed to save the image from PMBull site?
It will not allow me.
Papudi. The TradingView site only allows us to save to the Cloud. I simply took a screen capture, opened the image under MS Word, “save image as”, and then do some editing from there. Hope this helps.
Same ? below: Tradingview does not have cloud indicator. Where did you find on the chart?
Cloud indicator is on PMbull site.
Thanks.
I opened up pmbull site, and asked for Ichimoku indicator. It drew the graph on TradingView. On that web page there are two Cloud indicators on the top right corner. One is for uploading and the other is for downloading. You can plainly see those in the captured image I posted above.
Ichimoku Daily Analysis — data as at the close of May 4
The following facts are now established:
(1) The negative crossover of the faster blue tenkan-sen and the slower red kijun-sen two days ago indicates a death cross.
(2) Gold price had cleanly sliced through the top of the cloud on its way south yesterday. The first indication of a trend change from bullish to neutral was sounded when price entered the cloud.
(3) The cloud is still green, which means the bull has not been slaughtered yet. As prices are inside the cloud, the strength of the trend is neutral. The bull is still hanging on.
(4) Prices lie below the tenkan-sen, kijun-sen and the top boundary of the cloud (technically named senkou span A), and is just touching the green lagging chikou-span. The first three lines now changed from support to resistance. So, the bull has many hurdles to overcome before it can re-assert itself.
(5) On a daily basis, the time spent inside the cloud indicates a period of consolidation.
The overall view is undoubtedly one of a struggling bull. But, what are the signs to look out for to pinpoint it being replaced by the bear?
(1) The chikou span falls from above and crosses the price.
(2) Prices pierce through and under the bottom of the cloud (technically named senkou span b).
Let’s see what happens today. I will follow up with an hourly analysis in the next post. I managed to work on TradingView successfully, many thanks to the tip from Papudi.
I was searching cloud on Tradeingview under indicators. Where did you find this on that site?
Thanks
I took this from StockCharts. Their image can be saved using right click on the mouse, “save image as”. Not so TradingView. I was lazy to do the editing, so …
Lara, NatGas might be a good short here? Chart by EagleSeagle
Thanks Dreamer, will look at that for sure this weekend for Trading Room.
Lara, with the substantial update today, maybe you could add this to “gold historical”? 🙂
Why yes, a good idea 🙂
Thanks Lara for your patience for this analysis. Great commitment.😊👍
What will be the count on silver lara ?
Will it be the same bearish one.?
But my instinct still saying that this is a deep minor 2 correction and what we are seeing as a breach on trend line is a false breach. A bear trap. If price rise sharply today i will be confident in my assumption. But will surely wait for your guideline to get confirm. WAVE QUEEN😊
And what a analysis on oil lara.
Woowwwwwww.
Silver has been written and is being proofed now. Will be published shortly.