
A little sideways movement followed by another wave down was expected in last analysis. This is what has happened.
Summary: The new target for Monday is 1,214. If this is wrong, it may be too low because price is at strong support and On Balance Volume is at support at the weekly and daily chart levels. Look out for a bounce to begin next week.
New updates to this analysis are in bold.
Last historic analysis with monthly and weekly charts is here, video is here.
Grand SuperCycle analysis is here.
MAIN ELLIOTT WAVE COUNT
DAILY CHART – DETAIL
Click chart to enlarge.
It is important that members keep weekly and monthly charts in mind when viewing daily charts. Elliott wave is fractal; be aware of the bigger picture.
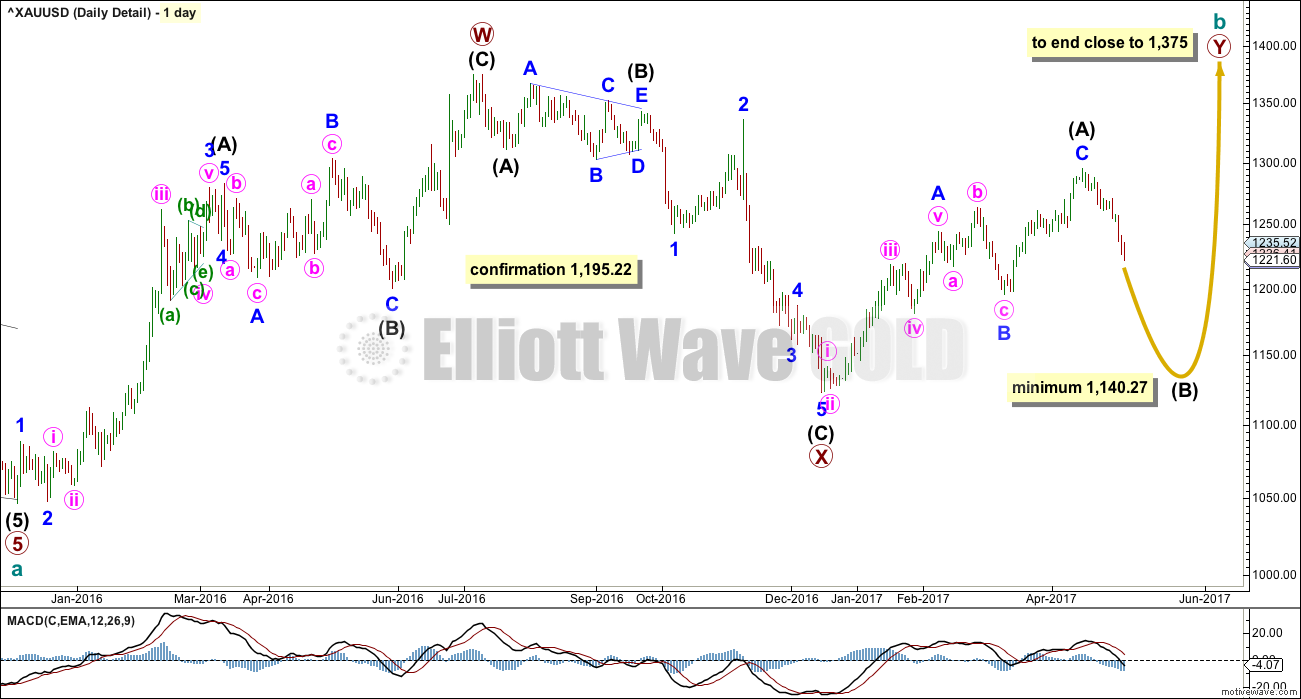
The first two weekly charts for cycle wave b continuing will be followed on a daily basis. This first wave count sees cycle wave b as a combination: zigzag – X – flat.
The second structure in the combination, a flat for primary wave Y, is incomplete.
The upwards wave labelled here primary wave W will fit neatly as a zigzag.
The downwards wave labelled here primary wave X does fit best as a zigzag. This allows a triangle to be seen in the position labelled intermediate wave (B).
Now the upwards wave from the low of December 2016 to the last high on the 17th of April fits best and looks like a zigzag. This indicates primary wave Y is most likely subdividing as a flat correction.
DAILY CHART
Click chart to enlarge.
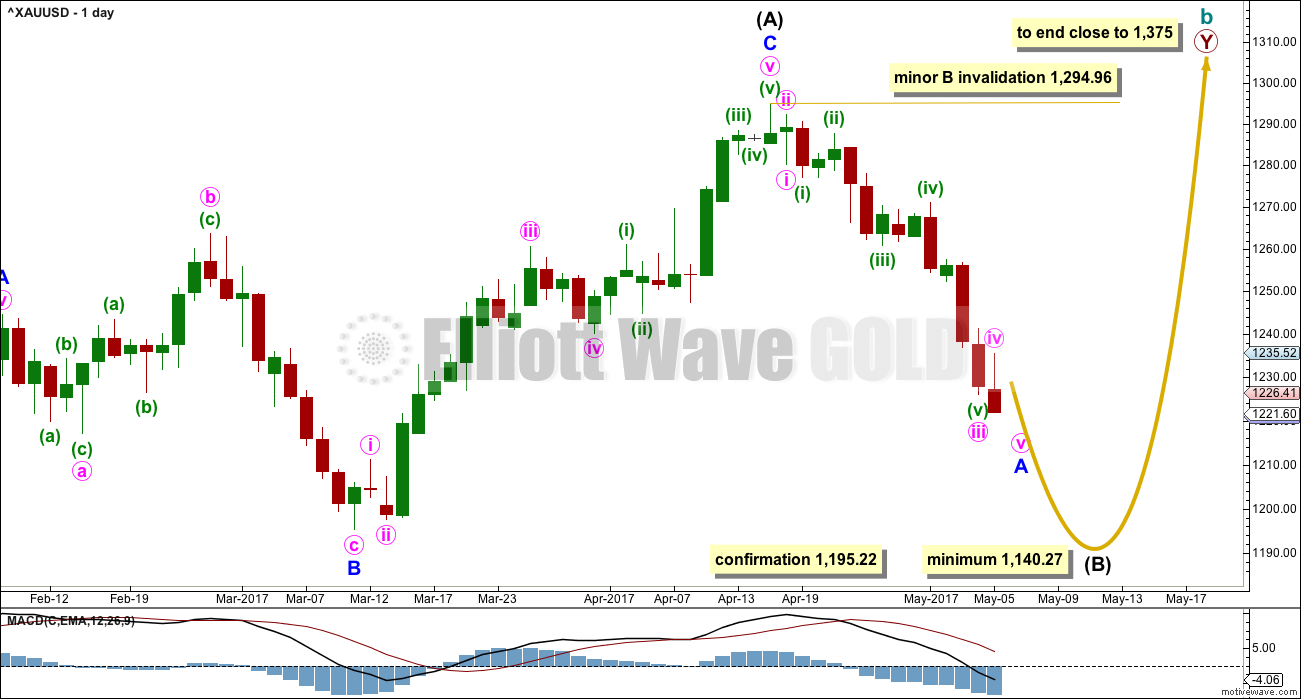
Within the flat correction of primary wave Y, intermediate wave (B) must retrace a minimum 0.9 length of intermediate wave (A) at 1,140.27. The most likely corrective structures to achieve the deep correction required for B waves within flats are single or multiple zigzags. These begin with a five, then a three in the opposite direction. So far a five down looks close to completion; when complete, it should then be followed by a three up.
Minor wave B, when it arrives, may be deep but may not move beyond the start of minor wave A above 1,294.96.
When minor wave A is complete and is confirmed so by a breach of the channel on the hourly chart, then the 0.382 and 0.618 Fibonacci ratios will be used as targets for minor wave B. Neither target can be favoured because B waves exhibit the greatest variety in form and behaviour; they may be shallow or very deep.
When minor waves A and B are complete, then a target may be calculated for minor wave C downwards to end the zigzag of intermediate wave (B), using the Fibonacci ratio between minor waves A and C. That cannot be done yet.
A new low below 1,195.22 by any amount at any time frame would invalidate the alternate wave count below and provide confirmation of this main wave count (all three weekly versions of it).
2 HOURLY CHART
Click chart to enlarge.
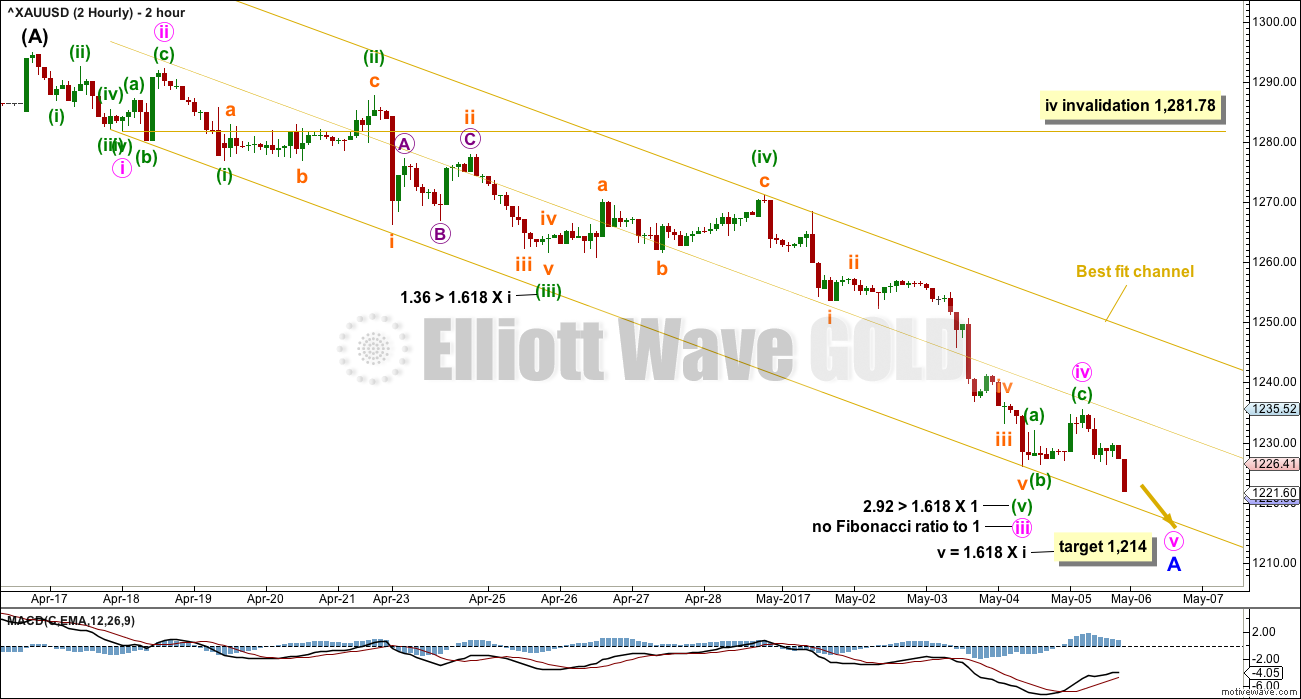
This downwards movement so far looks very much like an impulse. Fibonacci ratios at minute and minuette degrees are noted.
The best fit channel is very important. Add a mid line. Expect price to continue down while price remains within the lower half. When price breaks into the upper half, it would most likely be the end of minor wave A and the start of minor wave B. A breach of the upper edge of the channel would provide strong indication that minor wave A is over.
Minute wave iv may not move into minute wave i price territory above 1,282.01. However, Gold’s fourth waves are typically very shallow; minute wave iv is not expected to get anywhere near the invalidation point.
HOURLY CHART
Click chart to enlarge.
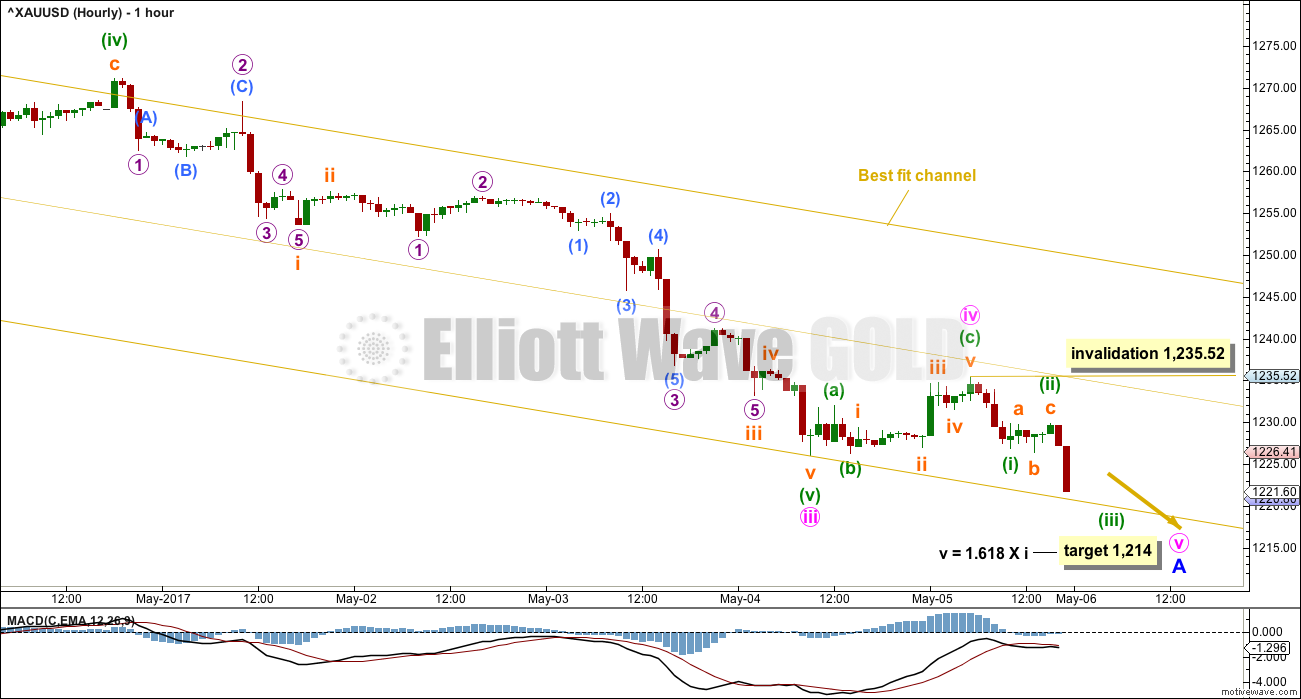
This hourly chart shows more detail of the end of minute wave iii.
The first target given at the end of Friday’s session, which was 1,222, has been met and slightly exceeded at the close. But the structure of minute wave v is incomplete, so a new target is calculated. If this target is wrong, it may be too low. There is strong support here for price and from On Balance Volume, which may halt the fall in price temporarily.
In the short term, a new high above 1,235.52 could not be a second wave correction within minute wave v, so if / when that happens minute wave v must be over. That would also bring price up into the upper half of the best fit channel. A new high above 1,235.52 would be a strong signal that a low is in place and a bounce has begun.
The upcoming bounce is expected to be a B wave. These do not usually present the best trading opportunities. However, a movement at minor degree usually last weeks and can present some trading opportunities, but members are warned that minor wave B may be very choppy and overlapping. Only more experienced members are advised to trade a minor degree B wave. Risk management is especially critical and traders must be nimble and take profits more quickly.
TECHNICAL ANALYSIS
WEEKLY CHART
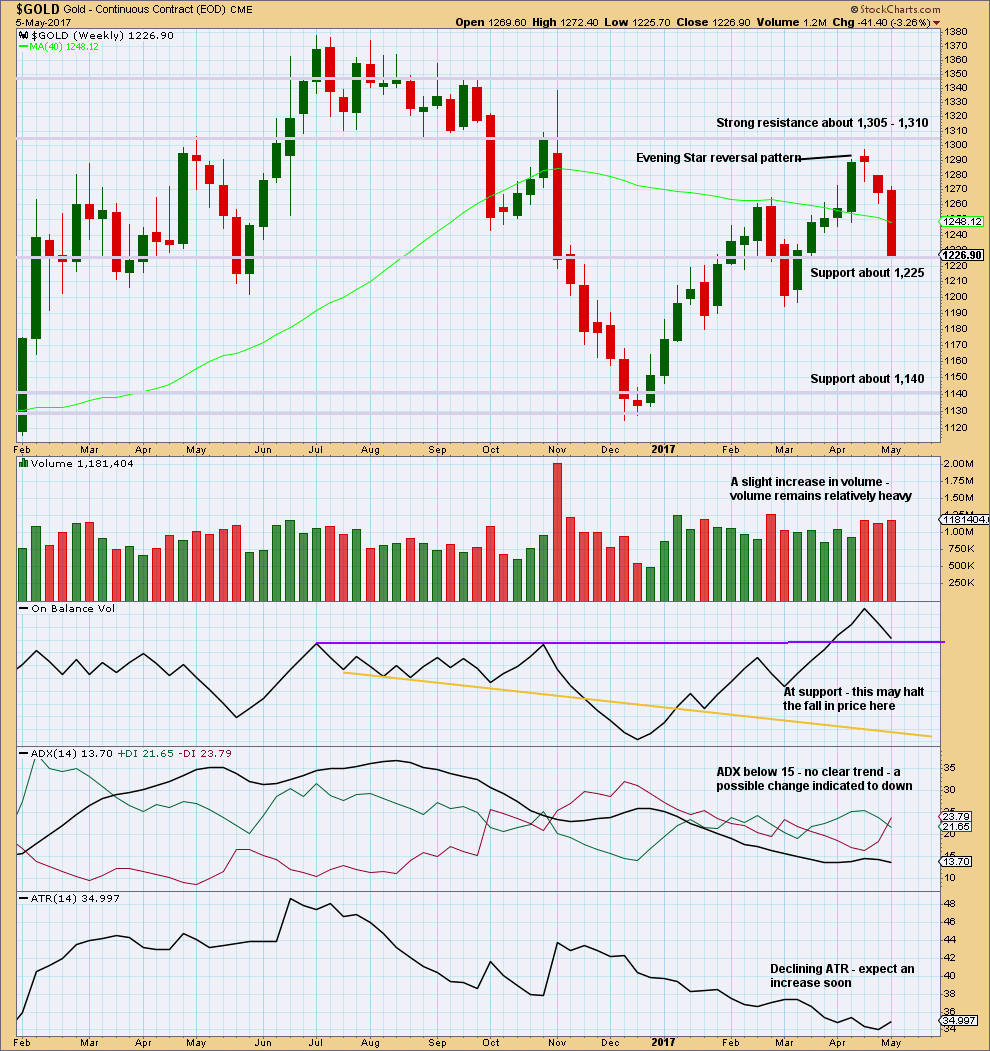
Click chart to enlarge. Chart courtesy of StockCharts.com.
This weekly chart now looks bearish. Volume is bearish. The strong weekly candlestick looks very bearish.
Support for price and On Balance Volume may halt the fall in price temporarily, a bounce about here looks like a very reasonable expectation.
DAILY CHART
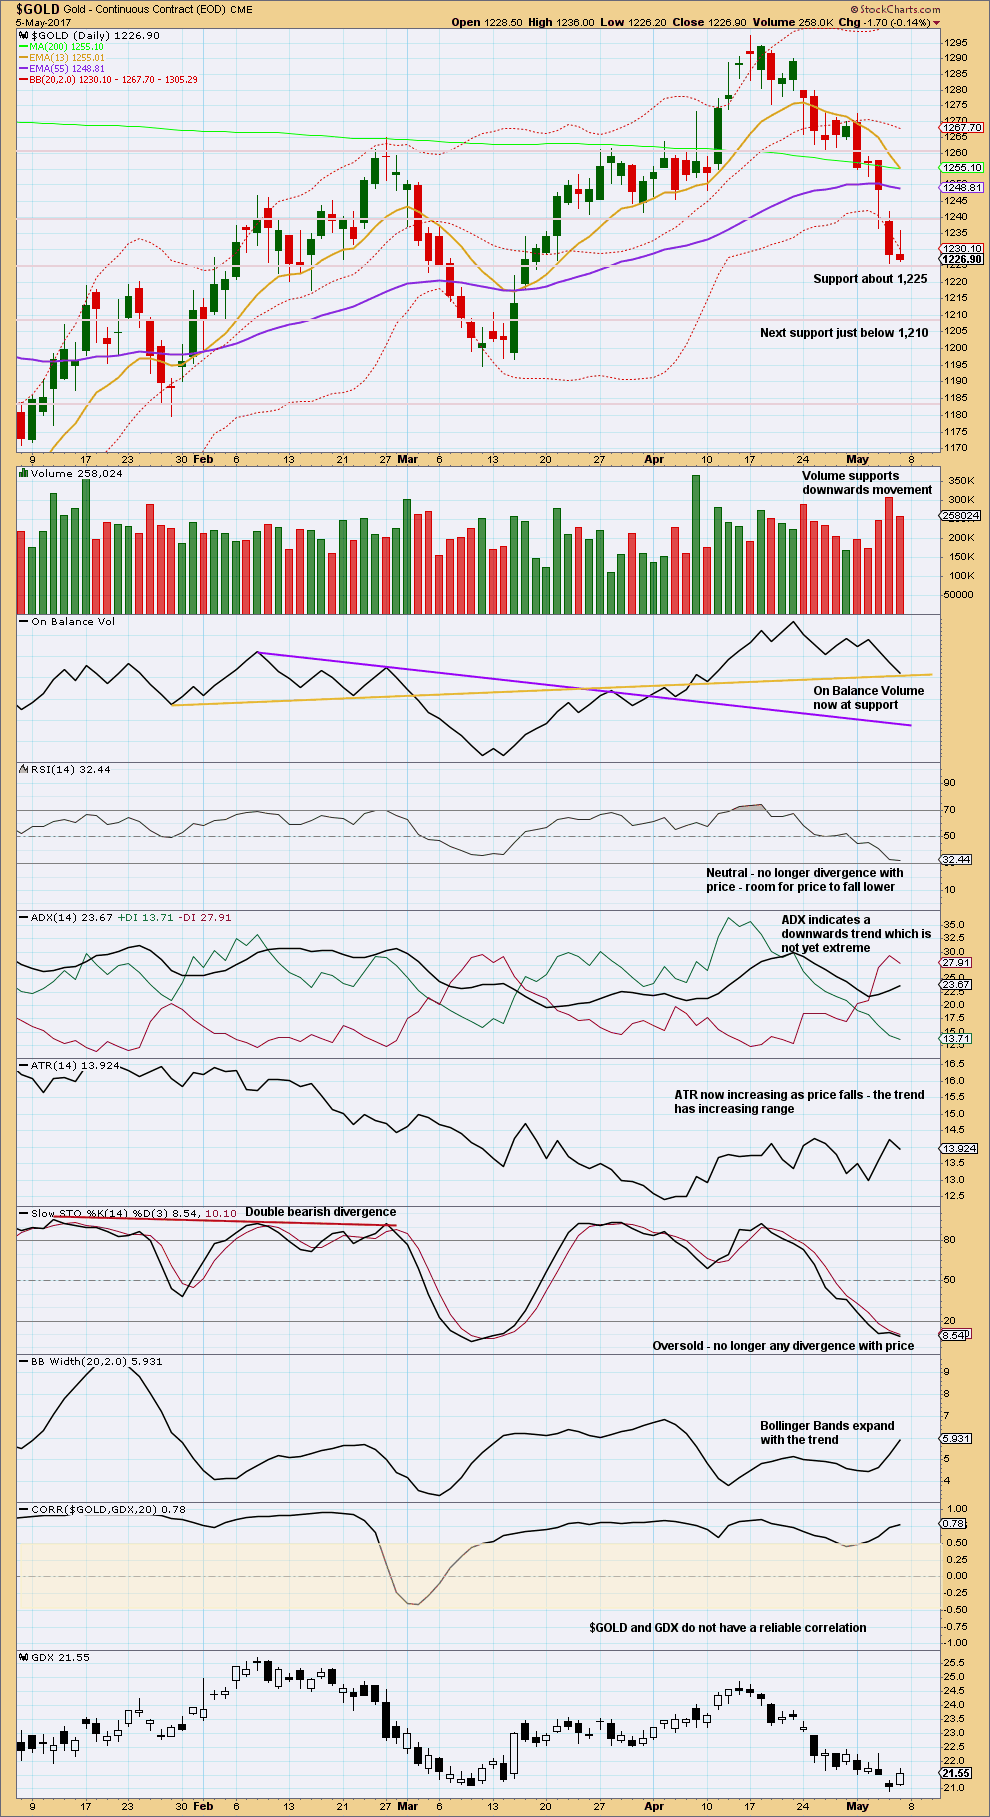
Click chart to enlarge. Chart courtesy of StockCharts.com.
Support for On Balance Volume at the daily chart level may also assist to halt the fall in price here. If it does not, there is room for price to fall further. RSI is not yet oversold and there is no divergence yet between price and Stochastics.
The long upper wick on the last daily candlestick is bearish.
GDX
DAILY CHART
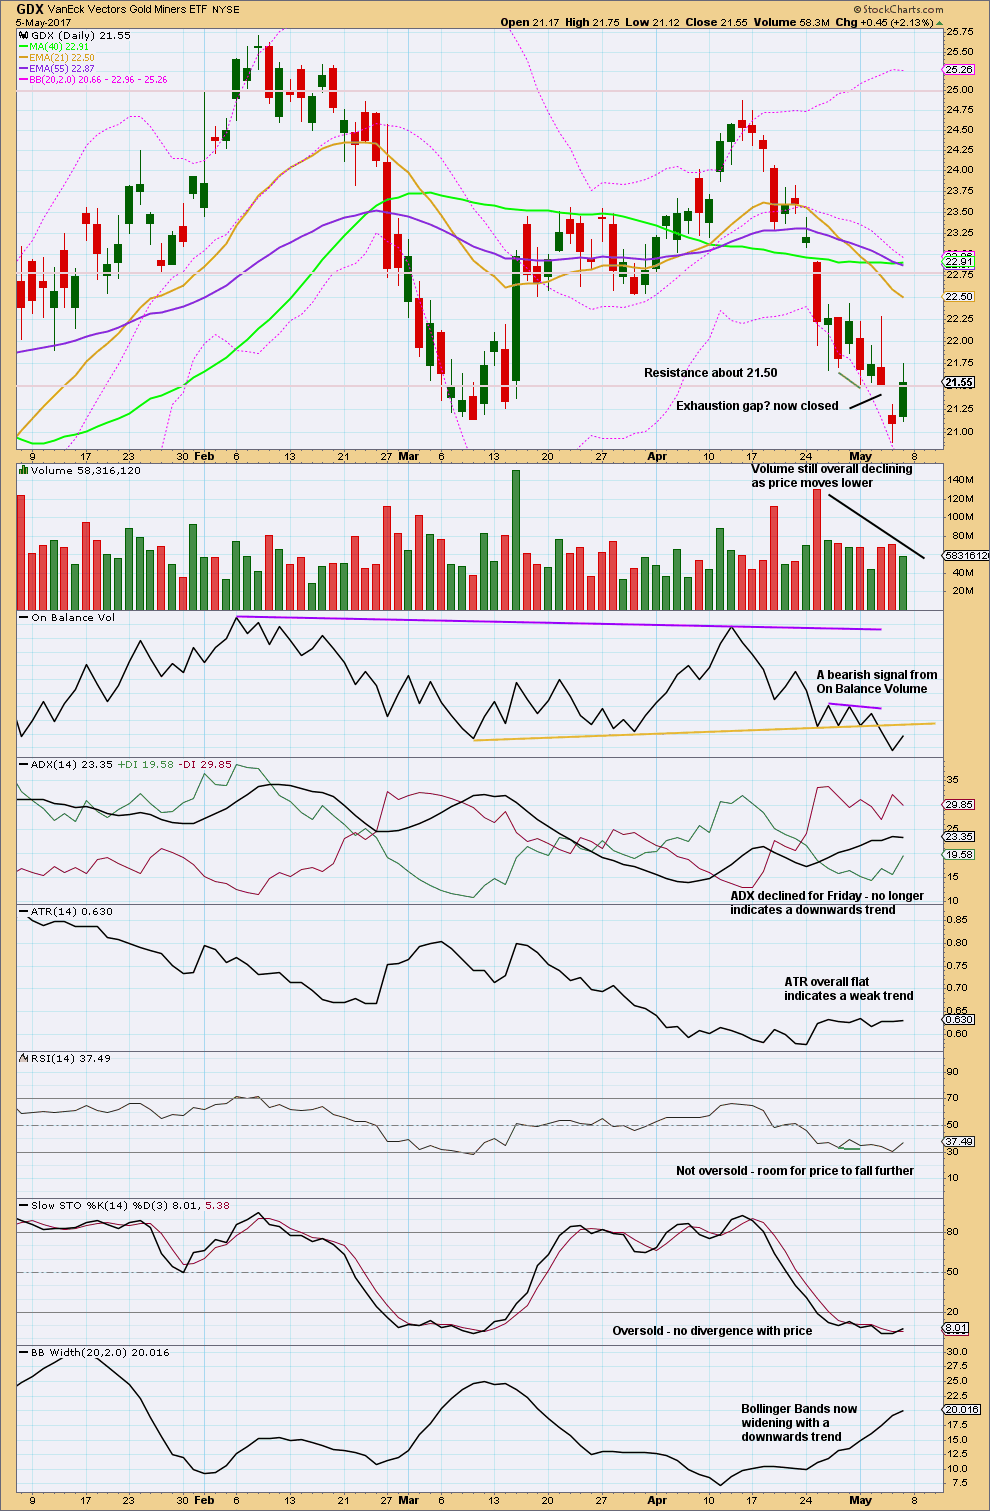
Click chart to enlarge. Chart courtesy of StockCharts.com.
The gap down noted in last analysis is now closed. It is not a breakaway gap. It is now an exhaustion gap.
The strong bullish candlestick for Friday completes a Morning Star reversal pattern, albeit not a perfect one. The bullish candlestick for Friday does not have support from volume.
A bounce may be seen beginning here for GDX. There is strong resistance about 22.75.
This analysis is published @ 09:45 p.m. EST on 6th May, 2017.
While the invalidation point was taken out, just, price remains within the lower half of the channel.
I think my invalidation point was too close. Minute iv may have continued sideways as a combination.
If I’m wrong here it would be in expecting one more low before a bounce begins. The count expects that to happen, but it may not.
I see a discussion on BitCoin below. I’ve asked Cesar to give me updated data for it so I can update my EW analysis of it.
I also accept membership fees in BitCoin 🙂
LOL!!! Sorry Lara.
The problem with bitcoin is accurate price discovery. There are several exchanges which publish prices. It is hard to know a legitimate /consistent price???
I like to know your thought on this.
Below is the site which charts Bitcoin and other cryptos. Beside this there are many others.
But in this particular case look at the top bar. There are several exchanges have wide price parity??? Bitstamp. BTC etc.
https://bitcoinwisdom.com/
For Elliott wave analysis as long as I use the same data source consistently, I can get an idea of the wave count.
It won’t be so good for targets and invalidation points as they’ll be different, but it may be okay for a bigger picture analysis.
The short the Yen and Volatility and buy equities continues unabated, but with rapidly diminishing returns. New 52 week lows in vol instruments and another sub 11.00 visit by VIX still has not produced new highs. I caanot help but wonder if the beat down in the precious metals was also a frantic play for revenue to keep equities aloft. A strong move out of the sideways mamba probably just ahead.k
I am amazed at how many analysts are calling for a reversal and strong rally in oil. Many are citing the “hammer” candlestick from Friday’s session as evidence of a bottom. A look at the long term chart and a long held support shelf that was decisively broken recently seems to me hard to miss. It looks to me like price is moving back to test that area of former support and we are finishing a b wave of an abc upwards correction. I seriously doubt it is time to go “long & strong” oil, as some are suggesting! 🙂
I will reload shorts if we get to 49-50 area.
I think it’s time to produce a TA chart for Oil of the last big downwards trend.
The hammer puts the trend from down to neutral. A reversal means a reversal to the opposite direction OR sideways. And a candlestick reversal pattern makes no comment on how far the next trend may go.
Today puts the bullishness of the hammer to neutral, today is printing a doji.
Oil can remain extreme for long periods of time when it trends.
I’m simply scanning my daily and weekly feed of CL_F and can only decipher that hammers (daily or weekly) provide almost zero useful information – in fact, they almost always precede a move back in the opposite direction. FWIW.
Yep. Reversal signals don’t necessarily mean reverse from down to up or vice versa.
They can also mean reverse from down to sideways… for a day or two or three. Then down continues.
Indeed! 🙂
The gargantuan commercial shorts seem to be settling in for a long winter’s nap…they are not budging. As long as we stay under that broken support shelf neither am I…
Lara’s Bitcoin wave analysis: Target for wave b is on the mark. Minimum 1000+. It is trading at 1780 or lower. Wave b ratio to wave a is 1.60. It has more room to rise to 2.0 level.
Bitcoin ripe for short LOL!!
A perfect Tulip bubble.
Wave c could be lower than 162 (a).
Papudi, if this comes to pass, it could, ipso facto, be good for gold. That the recent geopolitical tensions did not translate to a greater spike in the price of gold is largely due to BitCoin parasiting off a major portion of the safe haven fears.
Thanks Alan.
Some one wrote: “It took 7 years for the value of all cryptocurrency to hit $10 billion, another year to hit $20 billion & 3 more months to hit $40 billion.”
If $40 billion had been in gold I do not want to guess where gold price would have been???
Ichimoku Hourly Analysis — data as at 4:55 am ET today
===============================================
The hourly chart shows that:
(1) The cloud is red, meaning that the bear is gaining traction.
(2) Price had fallen below the cloud on Friday, meaning the bear is confirmed, unless price decides to re-enter the cloud.
The current status is that the blue tenkan-sen had crossed above the red kijun-sen. Price is trying to rise, and this may be interpreted as a backtest after the bearish breakout last Friday. The bottom boundary of the cloud, the green senkou span A should provide strong resistance. It is at 1231.78, and so this is the price point to watch today. A break above would mean another period of consolidation. Price did briefly enter into the cloud this morning, fallen back below, and is now trying to get back in.
If price does manage to climb back into the cloud, then the classical analysis based on support-resistance and Fibonacci ratios (posted earlier) may be effected. This may be what is happening now. Price is on the verge of testing the previous support-turned-resistance cluster at 1234.66, 1235,52 and 1241.26. The next test will be the top cloud boundary at 1241.10. This is close enough to 1245.09 given in the classical analysis discussion (50% of the range). If all then goes well, price will exit the cloud above the top and reach for the targets listed, 1252.80 and 1261.55 respectively (please refer to Ichimoku Daily chart previously posted). These points correspond to 1256.87 and 1268.38 given in the classical analysis discussion. This could occur in a couple of days’ time.
Folks, happy trading. If there are major changes today, I will give a further commentary.
Just a comment on the above post.
Please note that the figures reported in the classical analysis and Ichimoku analysis are slightly different because the classical analysis figures are based on BarChart data, the de facto standard used in this forum, whereas the Ichimoku hourly figures are from TradingView. To add to the confusion, I draw the daily Ichimoku chart using StockChart. As you all know, the data from these three platforms are different, sometimes as much as $1 to $2. Please take cross-comparisons in this light.
Alan, doesn’t the drop from Friday’s high to the low after the open on Sunday look like a “3”? If it’s a “3”, then I wouldn’t think the bottom is in yet. Thoughts?
I may be wrong, but it does look like a “5” on the 15-minute chart to me, with the 4th wave being an expanded flat. What perturbed me was that price then went on to 1234.66 after the low at “3”. This would have markedly entered into first wave territory, and I can’t figure out a count that takes that into account.
Yeah, it can be a 5 on the 15 min, but I’m much more comfortable seeing a better looking 5 on the hourly. The move down to the low could be an X wave and now we are carving out a Y wave to complete Minute 4. We’ll have to see what happens as the day progresses. Thanks for the cloud analysis. The more I see it, the more interesting it’s becoming!
Dreamer, that is what I thought too. I normally like to think of fifth waves as being 5 waves, but I keep the WXY as a possibility. Let’s see what the next few days bring. It’s still too early to make a definite judgement call.
I do agree with you that Ichimoku looks interesting. That’s why I was sold when I studied it in detail a couple of weeks back. I like to use it because I would not have to juggle a few indicators and try to mesh them together to yield one definite call. The problem, I feel, is that each indicator has its own mathematical model of the price action, complete with limitations. Worse still, sometimes they clash in their predictions. Furthermore, how many indicators does one use? Too many may not provide greater accuracy; too few may leave gaps. Many traders claim an optimum number is three to five. The next question is which ones form the optimal mix. Unless this matter is settled, having to make a decision based on them in real time, in the heat of trading, is quite stressful. I always believe in productivity: minimum effort, maximum gain.
Five-minute chart appended.
I am looking for a retake of the 100 dma to signal possible resumption of the uptrend.
Agreed, Verne. The 100 DMA currently lies at 1239.02.
I’m a bit more cautious. I’m looking for price to rise above the resistance cluster, the last of which stands at 1241.26.
This will trigger a rise towards the 50% retrace at 1245.09 which in turn will trigger a rise towards 1256.87, the 61.8% retrace.
Incidentally, if Minor B = 0.618 * Minor A, then Minute A of Minor B would end at 1256.38.
So far, the price action is still on track for this.
Ichimoku Daily Analysis — data as at the close of May 5
===============================================
At the daily level, the cloud is still green, indicating that gold has yet to turn bearish. The last support is the bottom of the cloud near 1222-1224. Price has so far dropped to 1225.18 today. If this support holds, then it means that a reversal is in the cards. That could be Minor B.
On the fundamental level, the news of a Macro win had already been baked in by the market. It is a case of “buy the rumour, sell the news”. Traders had shorted the market, and could now be covering the shorts, as Verne discussed.
I will cover what transpires in the hourly Ichimoku analysis, to be posted later.
Where is gold headed next?
Resistance-Support & Fibonacci Analysis
===============================================
The rise in price to 1234.66 this morning probably necessitates a reworking of Minute 5 of Minor A. I have a count 1235.52 – 1231.77 – 1233.96 – 1226.83 – 1229.87 – 1225.18 to complete Minute 5. This means that Minute 5 is 2.84 short of equality with Minute 1.
A 6-month hourly chart is appended to help visualise the possible price movements discussed below.
If 1225.18 holds, then I would expect Minor B to rally towards 1256.87 (61.8% of the range from 1195.22 to 1294.96) or 1268.38 (the high of May 1). From Ichimoku analysis,I would not expect price to venture past 1268.38 because that would mean a bullish trend resumption.
On the way up from the present drop towards 1229.22, the resistance levels are:
(1) 1234.66, 1235,52 and 1241.26 (previous supports)
(2) 1245.09 (50% of the range).
If 1229.22 does not hold, then price could drop to:
(1) 1218.76 (23.6% of the range)
(2) 1209.78 (14.6% of the range).
If the bottom 1195.22 (the low of March 10) does not break the fall, then the next support levels are:
(3) 1181.41 (the low of Jan 27)
(4) 1123.08 (the low of Dec 15 last year).
Found a typo in the last paragraph.
“If 1229.22 does not hold” should read “If 1225.18 does not hold”.
A peek beneath the surface of the BLS report reveals the ridiculous fabrication continues. Of the supposed 211K non-farm payroll jobs created, a whopping 255 was created out of whole cloth- simply a guess based on the so-called birth/death report. Specifically, BLS postulates, with not a shred of real evidence or even investigation, that new start-ups created these new jobs included in the report. That they are allowed to include this “adjustment” in their report is truly remarkable. Even more remarkable is the fact that most folk seem to accept it at face value and report it as fact. The harsh reality, keeping the math simple, is that the economy in all likelihood failed to create any new jobs in in April, and in fact actually shed some 44K jobs.
We have had on the forum a brief discussion about the the nature and advent of economic recessions, and Alan pointed out that the official definition requires two quarters of negative growth. Paying close attention to the size of the fabricated job numbers is a much better “tell” than waiting for the mendacious BLS to tell us what has already happened.
Looks like an exhaustion gap open to 2403.50 on SPX futures on one minute chart, accompanied by a gap down and reversal in Gold futures. It will be interesting to see if trend change continues…
US dollar monthly chart is bearish by definition: Lower highs and lower lows since it made high in 1985.
Also it has carved out Bullish wolfwaves where wave 5 is yet to be completed.
Last week dollar was lower and gold had bear raid???
Lets see what is coming next week and it will be interesting indeed.
Papudi. Many thanks for the wonderful US dollar analysis. The outcome would make Trump happy; he wanted a weaker dollar.
As Verne brought out, there are strong rumours that Russia and China are going to issue bank notes backed with gold, which means the threat to the US dollar as the world reserve currency looms greater. Furthermore, Saudi is heard to be prepared to accept gold-backed renminbi (Chinese currency) alongside with, and maybe eventually supplant, the US petrodollar in the future. That may be the reason why Trump is so reluctant to anger the Arabs. What with cryptocurrencies making a strong comeback, would the proverbial final nail be struck into the coffin full of US dollars? I wonder.
Papudi, I am wondering about your label for wave four (small red). Do you think the dollar is in an ending diagonal?
Verne
Wolfwave does not relate to EW.
These waves develop in all time periods like EW.
You can goog the word.
http://www.pointzero-trading.com/Products/view/PZWolfeWaves
O.K. Thanks!
Lara:
On right side bar the Archive mat shows on 2017. To change it to prior year it does not work.
Is it possible to fix this nice little tool??
Thanks.
Thanks for letting us know of the problem Papudi. Cesar is looking into it.
Weekend Read:
Once again traders/investors spooked by a rare event.
==================================
Gold-Futures Shorting Attacks
Adam Hamilton
Gold has suffered a sharp pullback over the past couple weeks, stoking much bearish sentiment. While a variety of factors fed this selloff, the precipitating catalyst was a gold-futures shorting attack. These are relatively-rare episodes of extreme selling specifically timed and executed to manipulate gold prices lower rapidly. Traders need to understand these events, which are inherently self-limiting and soon bullish…..
The bottom line is gold’s sharp pullback in recent weeks was sparked by a series of gold-futures shorting attacks. Some large speculator intentionally dumped massive amounts of gold-futures contracts within minutes, several different times. Such extreme selling so fast was way too much for markets to absorb, so gold fell. This shifted gold psychology to bearish, resulting in cascading follow-on selling by long-side traders…..
http://www.321gold.com/editorials/hamilton/hamilton050517.html
Hi Papudi. Thanks for the article. Just wondering if shorting attacks are inherently self limiting? Not too sure if the bulls have what it takes to get Gold price to 1400+. Looking back a few years, after an 1182 low (truncation / triple bottom?) all we got was a Crimea High 1392, followed with a 1130 low, perhaps a Malaysia Air disaster 1307-15 high only to drop back down to 1046, with a Brexit High 1375 interspersed with a Trump High of 1335-37 followed with a drop to 1122…. As yet am very skeptical for the bulls seeking 1400+….. The 1130 level seems to have a gravitational pull about it lol…. What will it take for Gold price to get to 1400+, a Crimea, a Brexit? Surely there must be better reasons than this.
How about French election today??? LOL!
I dare not counter your thinking/projection- you have been right many times!
BUT gold just put in low at 1045 in 2015. AND it behaving accordingly for new high +2000.
I am concerned from Lara’s count. She may be right here??
Key price is 1195. It should not be violated.
More to follow after next week’s action.
Well folks I am little surprised that Gold price put in an inside day on Friday with 1225 holding despite Stochastic %K below %D and ADX having risen indicating underlying strength to the downside. I guess momentum slowed down suggesting price could rally (maybe to correct some oversold, get back above the lower band and get 4hr RSI back to 30 lol). Silver seems to be looking to rally too. Price movement relative to pivot on Monday may likely indicate which way this is heading. A good upward move could fetch up to 6% and more. Presently my money (sentiment) is for the downside 1217-1208 range perhaps 50% retrace H 1296 / L 1122 at around 1210 support Lara pointed out or even better eventually down to 61.8% retrace to 1188 as Alan mentioned the other day. Breaking below 100dma though may not be easy. The decline could be brief in that case. Winner takes all. Lets see how this opens. Stops or stop & reverse would need to be managed judicially. Hard work this! Horrible when price gets marooned lol… GL all. Go well.
I am trying to find out exactly how many long positions are indeed being liquidated. The article is right about the naked shorting which has as its sole objective to foment bearish sentiment. The key thing to remember is that those short positions are going to have to be covered. Unless the long trades exit their positions the snap back could be considerable. The activity is particularly obvious with the Silver chart. That kind of decline is completely abnormal and one of the most massive bear raids I have ever seen. Very interesting. My suspicion is there is starting to be a rising desperation over the inevitable demise of the petro-dollar as they have miserably failed to jaw-bone the oil price higher and it looks to be headed below 30.00 Rumor also has it that both Russia and China are preparing to roll out Gold-back notes.
Look for Saudi-Arabia to announce it will accept oil payments in Renminbi – that will be all she wrote. The Saudis have recently learned that the US has for all intents and purposes stolen the 3T we were supposed to be “managing” in pursuit of the petro- dollar agenda. The line item showing what is owed to the Saudis recently was a measly 140.00 billion, and that after 40 years! That is the real reason why Trump is going to Saudi Arabia. I think he is wasting his time.
The Saudis may be totally corrupt and inept, but they are not stupid.
Adam has written about this many times in the past and asserted that it is self limiting.
“So every single contract sold short has to be closed by buying an offsetting long contract. 20k contracts of gold-futures short selling guarantees 20k contracts of long buying is coming in the near future. Thus gold-futures shorting attacks are self-limiting.”
I am not expert on this but can observe what is going on.
When CBs are in trouble one thing is sure investors run for safe heaven. During this shorting raid another safe heaven investment sky rocketed: Crypto currencies. Many of them are parabolic including Bitcoin.
Except gold has been held down????
Cabals can not do any naked shorting of Bitcoins and others.
Haha. Very true. There is no way to short cryptocurrencies. But, remember that the global banking cartel has considerable muscle with which to “persuade” governments to do their bidding. There could be laws enacted to restrict or limit their use, and maybe even to outlaw them completely. They have been behind the scene for centuries, puppet masters pulling the strings. I’m sure they will not let the new kid on the block usurp their entrenched sovereign position, at least not without a good fight. And they have a strong arsenal at their disposal.
Frankly, I have often wondered why they did not move more aggressively against bitcoin. Maybe they thought taking down Silk Road would do it.
I know the banks have subsequently started work on their version of the Block Chain. I wonder if they are thinking that they can hijack the technology…?
At least that’s what I thought and kept me away from Bitcoin several years ago. Otherwise i was ready to buy $2000 (2% 0f my portfolio) worth Bitcoin at $105 then and was determined to keep it for long time. HAHAHA I got spooked.
The biggest loss for Banks is the international fund transfer revenue from 2-3 % fee on FX.
Yep. Exactly! That’s a monster source of revenue for the banksters and I was sure they would be loathe to part with that gravy train!