
Last week’s analysis provided a trend channel on the 2 hourly chart and advised to assume the downwards trend remained while price remained within the channel. This is what has happened so far.
Summary:Price remains within the channel. If it breaks above, then use the 0.382 and 0.618 Fibonacci ratios as targets and look for resistance at the cyan trend line in the first instance.
New updates to this analysis are in bold.
Last monthly chart is here.
ELLIOTT WAVE COUNT
FIRST WEEKLY CHART
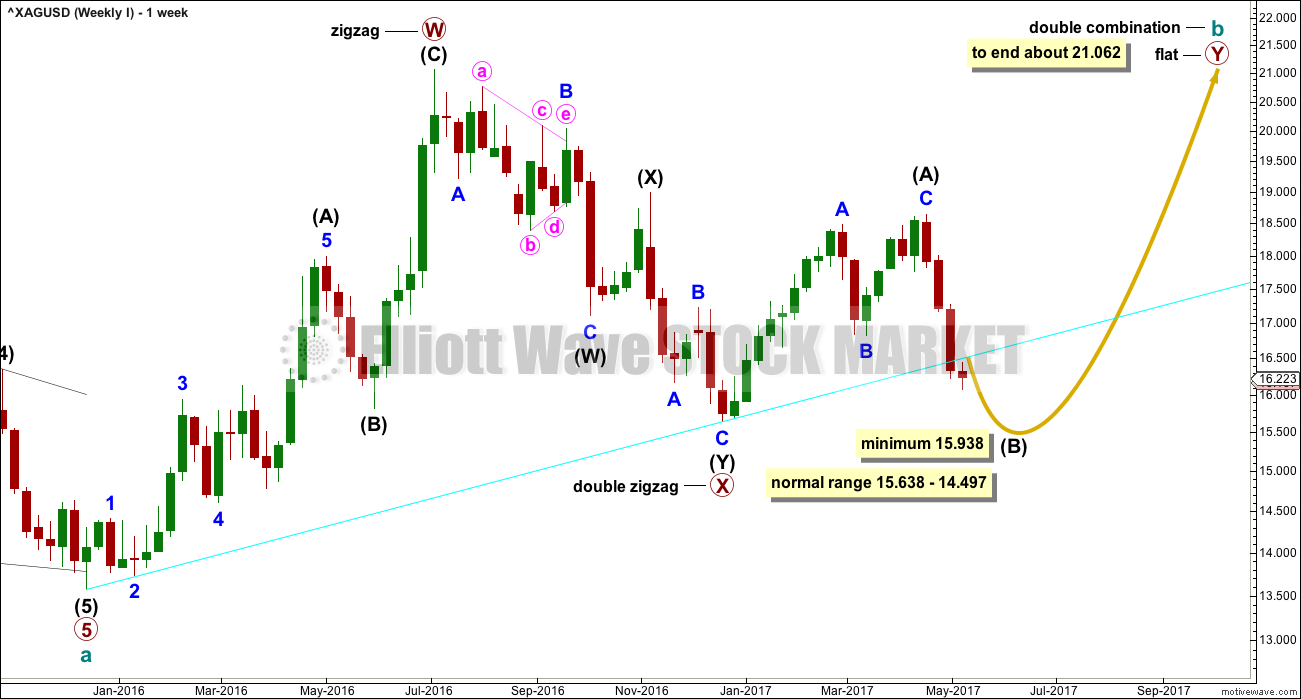
Click chart to enlarge.
Cycle wave b may be completing as a double combination: zigzag – X – flat. The second structure, a flat correction for primary wave Y, may be underway.
Within a flat correction, intermediate wave (B) must retrace a minimum 0.9 length of intermediate wave (A) at 15.938. The common range for intermediate wave (B) is from 1 to 1.38 the length of intermediate wave (A).
Intermediate wave (B) may make a new price extreme beyond the start of intermediate wave (A), as in an expanded flat, which are very common structures.
The bigger picture for cycle wave b would expect primary wave Y to end about the same level as primary wave W about 21.062. The purpose of combinations is to take up time and move price sideways. To achieve this purpose the second structure in the double normally ends about the same level as the first.
The maximum number of corrective structures is three within combinations (and double zigzags). This maximum applies to sub-waves W, Y and Z. Within these structures, they may only be labelled as simple A-B-C corrections (or A-B-C-D-E in the case of triangles). They may not themselves be labeled multiples as that would increase the number of corrections within the structure beyond three and violate the rule.
X waves are joining structures and they are not counted in the maximum total of three (otherwise the maximum would be five). X waves may be any corrective structure, including multiples.
FIRST DAILY CHART
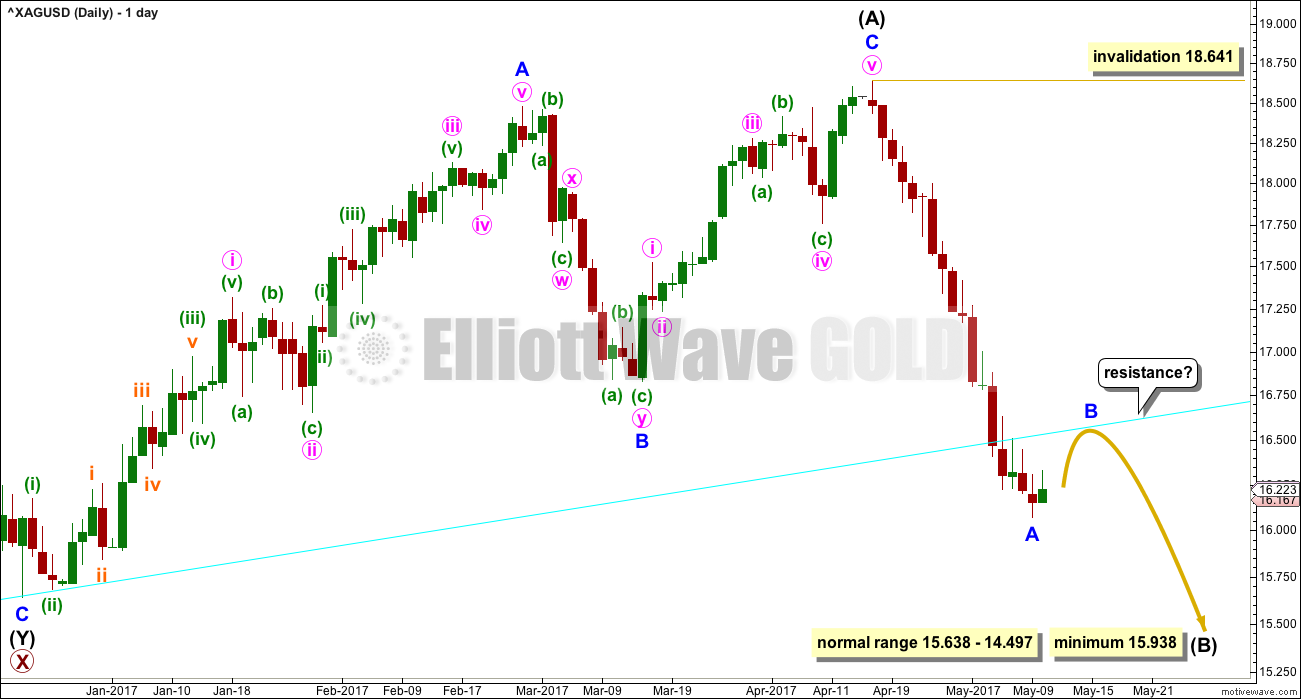
Click chart to enlarge.
Intermediate wave (B) may be unfolding as a zigzag. Within Intermediate wave (B), minor wave A looks like an impulse. Minor wave B may not move beyond its start above 18.641.
Now that price has broken below the cyan support line this line may offer resistance. It may force minor wave B to be shallow.
If price breaks back above this line, then it may offer some support again.
SECOND WEEKLY CHART
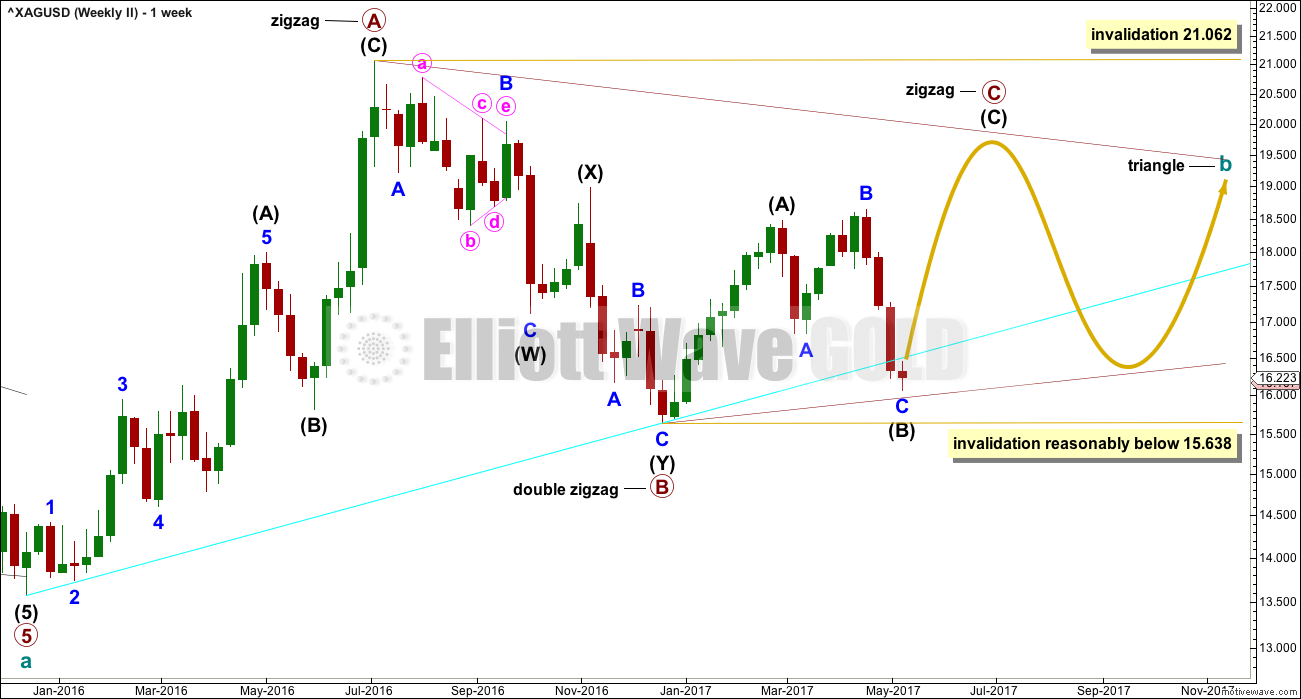
Click chart to enlarge.
It is also possible that cycle wave b may be completing as a triangle. Only because combinations are more common than triangles is this a second wave count.
Within a triangle, only one of the sub-waves may be a more complicated multiple. Primary wave B subdivides as a double zigzag. Primary waves C, D and E may only be single threes.
Within a contracting or barrier triangle, primary wave C may not move beyond the end of primary wave A above 21.062.
Within a contracting triangle, primary wave D (nor any part of primary wave C) may not move beyond the end of primary wave B below 15.638.
Within a barrier triangle, primary wave D should end about the same point as primary wave B. As long as the B-D trend line remains essentially flat the triangle will remain valid. In practice, this means that primary wave D may move slightly below the end of primary wave B (this is the only Elliott wave rule which is not black and white).
The final wave of primary wave E may not move beyond the end of primary wave C. It would most likely fall short of the A-C trend line.
This second wave count expects a large consolidation to continue for months.
SECOND DAILY CHART
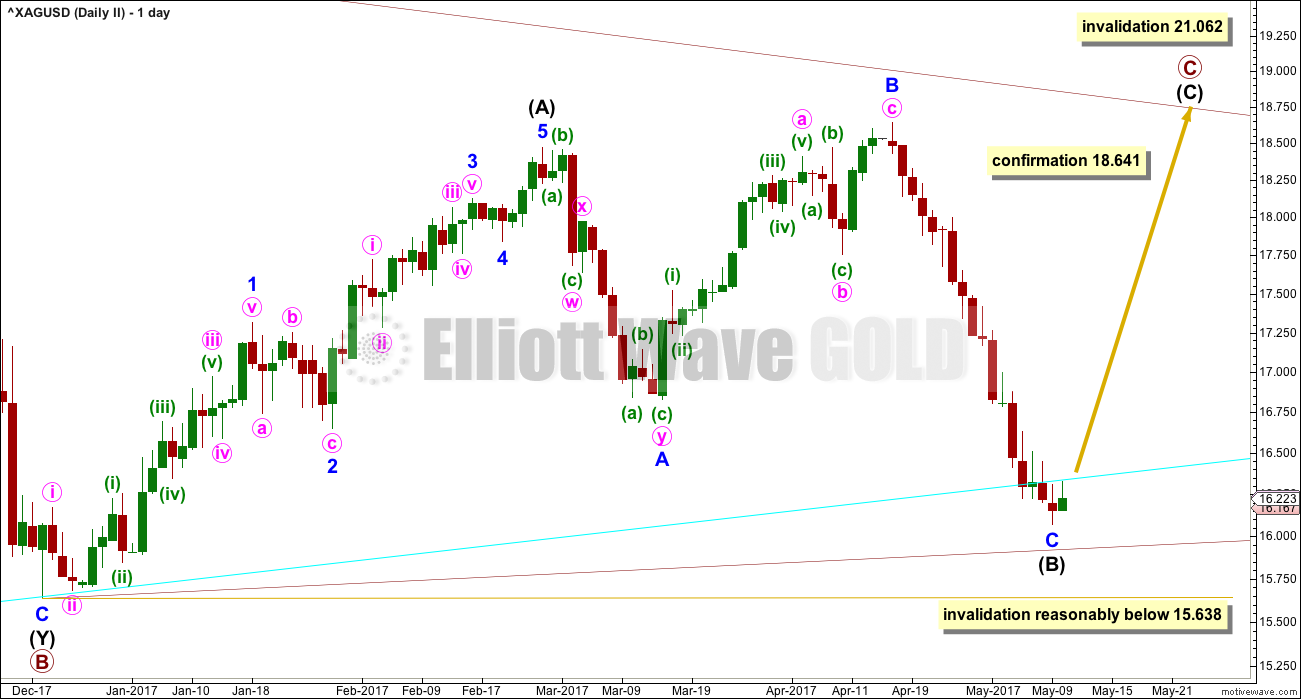
Click chart to enlarge.
Primary wave C may be an incomplete zigzag.
A new high above 18.641 would at this stage invalidate the first wave count and provide some confirmation of this second wave count.
A new low reasonably below 15.638 would see this second wave count invalidated and the first wave count increase in probability.
Price needs to turn up here decisively for this second wave count to have the right look.
2 HOURLY CHART
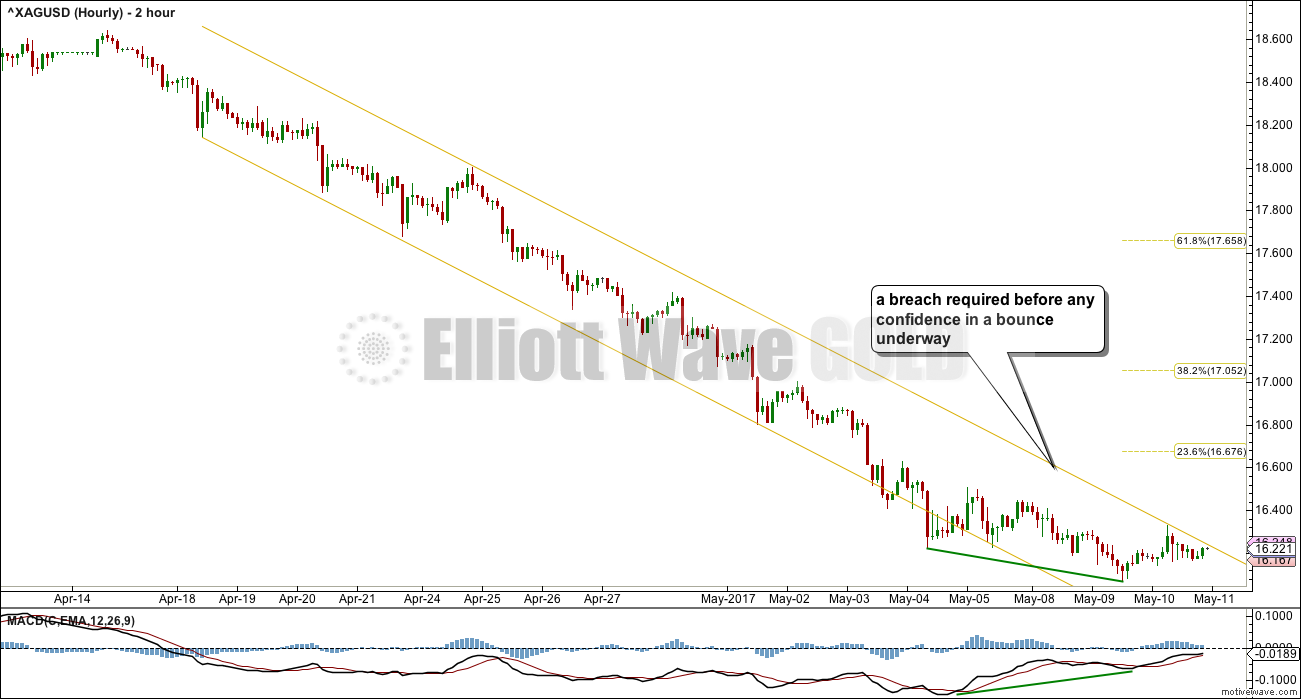
Click chart to enlarge.
This channel contains almost all downwards movement. The upper edge is the important point. If price breaks above this, then assume the downwards wave is over and a new upwards wave has begun.
This is the simplest and safest approach to this market at this time.
There is now strong divergence with price and MACD at the last low. Price currently sits at the upper edge of the channel. If a low is in place, then price must break above this trend line within the next 24 hours. If it does not, then it may make another low. If double divergence develops, then the probability of a low in place would be higher.
TECHNICAL ANALYSIS
WEEKLY CHART
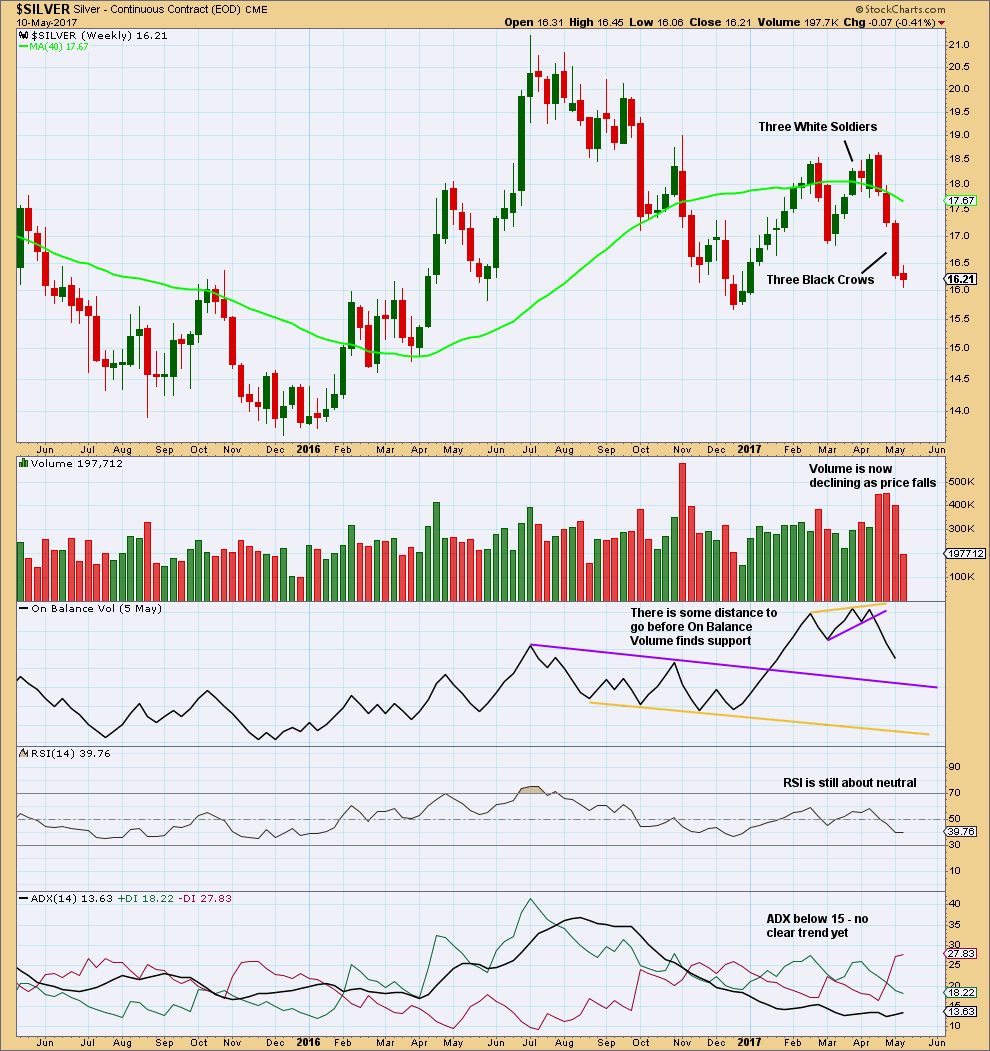
Click chart to enlarge. Chart courtesy of StockCharts.com.
Unless Friday’s session has very strong volume, this week will close with a substantial decline in volume from the last week. This indicates a green weekly candlestick for the next week looks more likely.
On Balance Volume is not offering support at the weekly chart level. RSI is still not oversold and ADX still does not indicate a downwards trend.
Price can continue to fall.
DAILY CHART
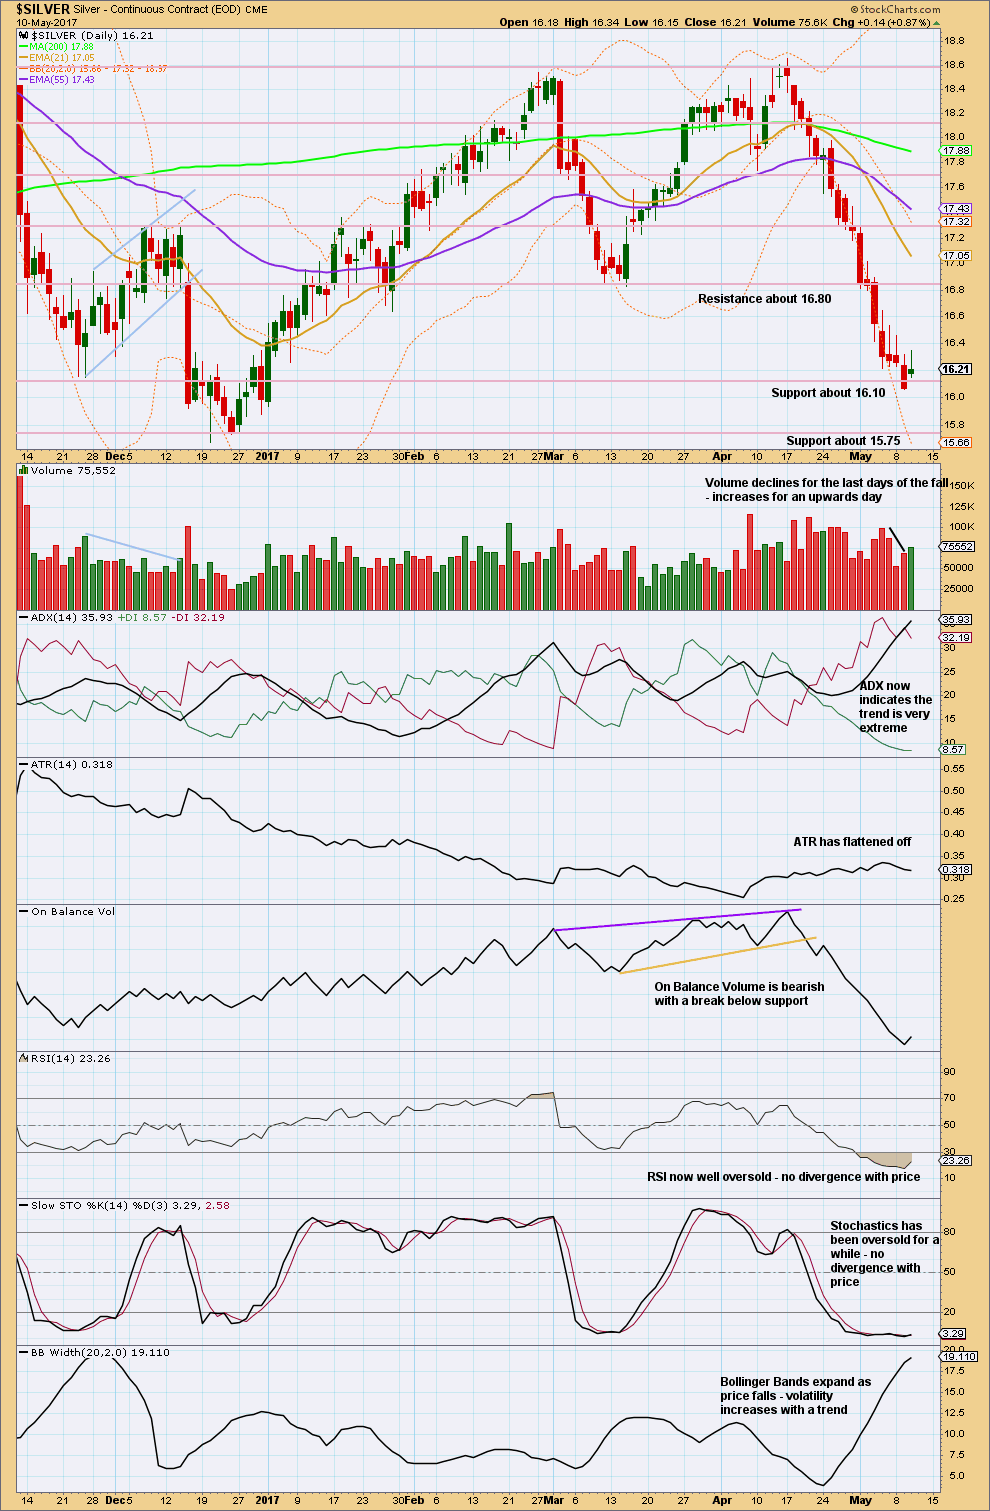
Click chart to enlarge. Chart courtesy of StockCharts.com.
ADX is extreme and RSI is oversold. This trend is very extreme at the daily chart level. It looks highly likely that a bounce is needed here or very soon indeed to relieve extreme conditions.
Some decline in volume for the last downwards days indicates some weakness. The slight increase in volume for the last upwards day may signal further upwards movement here.
The last two daily candlesticks complete a Harami reversal pattern. This is not a strong pattern, so a breach of the channel on the 2 hourly chart would still be required for reasonable confidence that a bounce has arrived.
This analysis is published @ 11:17 p.m. EST.