
Today’s Trading Room looks at US Oil, Copper, CVX and $USB.
Trading Room will focus on classic technical analysis. Elliott wave analysis will be for support and for targets / invalidation points.
US Oil (WTI Crude – Spot)
TECHNICAL ANALYSIS
Click chart to enlarge. Chart courtesy of StockCharts.com.
Elliott Wave Gold members were advised to enter short for US Oil on the 12th of April, at 53.11. Positions are now very profitable and stops have been moved down to protect profits.
Analysis is now focused on managing short positions and determining when to take profit.
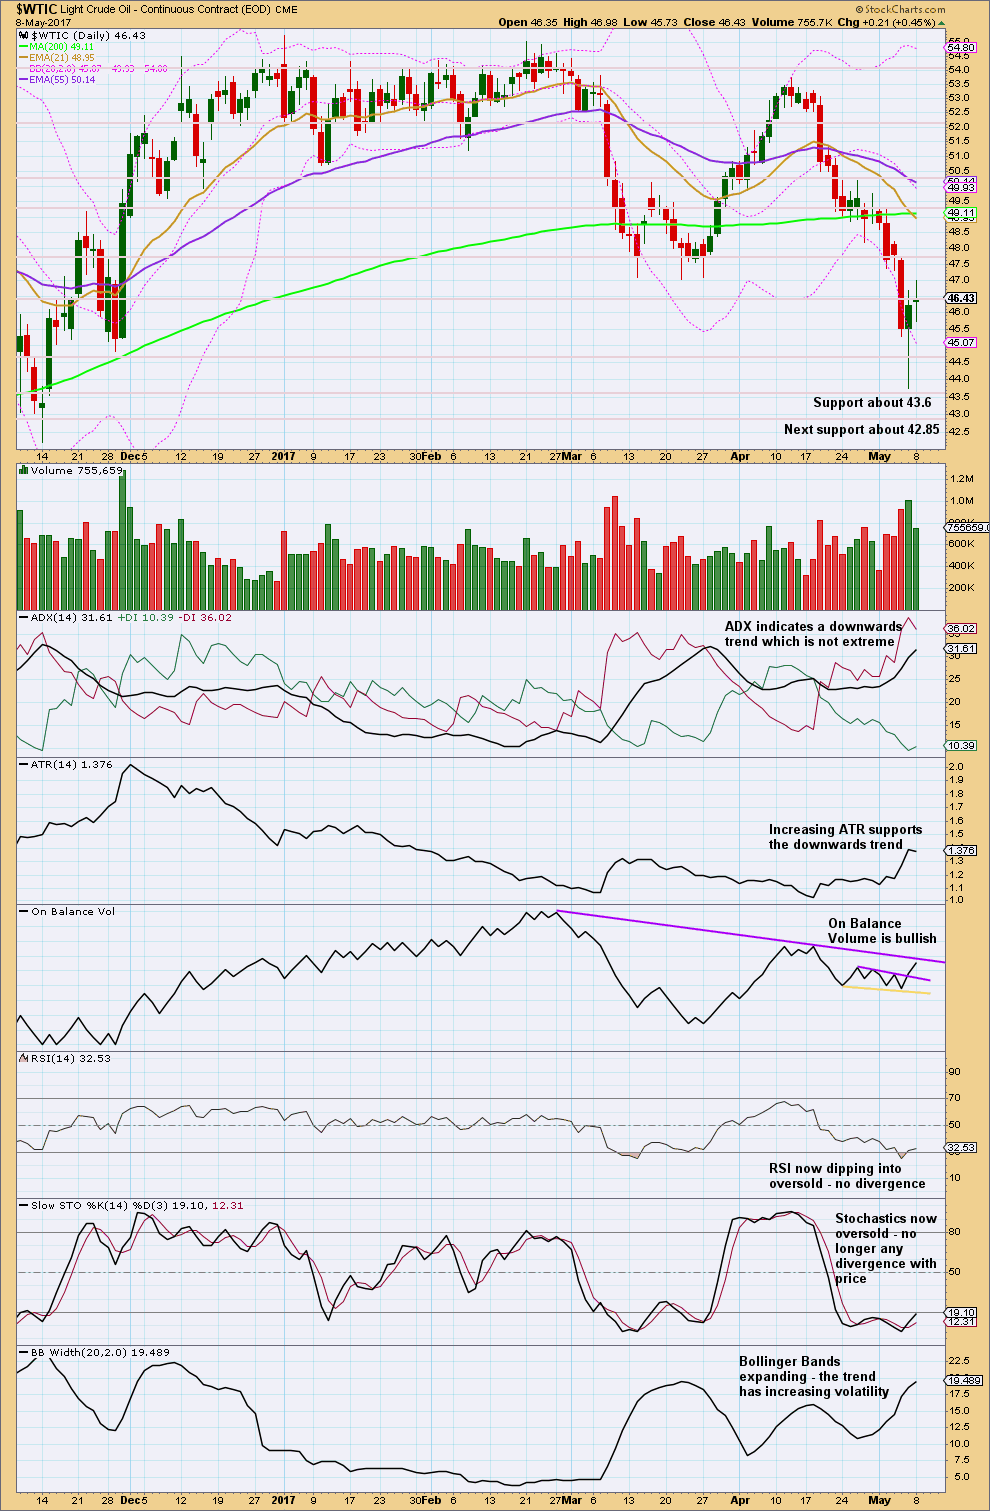
Price has bounced up from support about 43.6. The candlestick at the low is a hammer and this shifts the trend from down to neutral. A reversal pattern reverses from down (or up) to either the opposite direction or neutral but makes no comment on how long the next trend may last.
The hammer is followed by a long legged doji. This indicates a balance between bulls and bears; neither are in charge. This looks like a pause within a larger trend and not necessarily a reversal.
The downwards trend has support from volume. ADX indicates a downwards trend that is not yet extreme. The trend has a healthy increase in range and widening of Bollinger Bands.
When Oil trends, it can do so very strongly. Indicators may remain extreme for long periods of time. Only when RSI has reached oversold for some time and ADX is extreme may this trend end.
In the short term, On Balance Volume is a little bullish. The break above the short purple line is a weak signal because the line is not long held and only tested three times. On Balance Volume may find resistance at the longer purple line and that may help to halt the rise in price here.
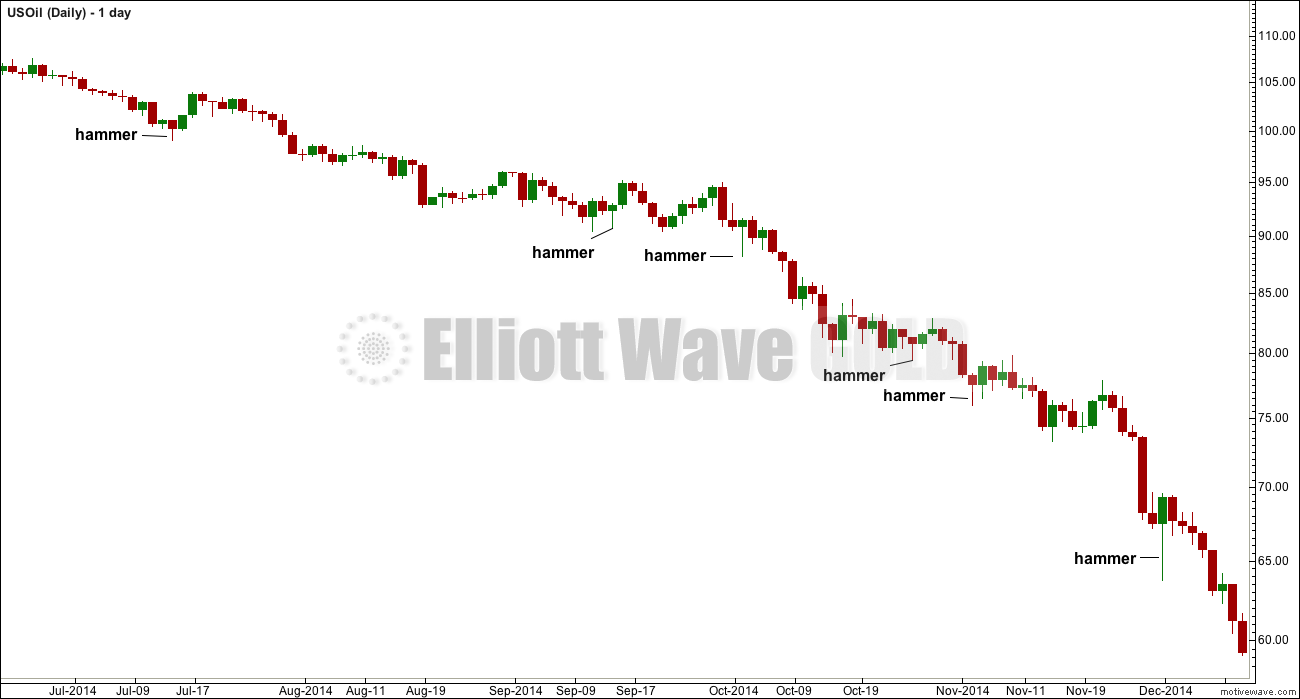
To see how extreme RSI and ADX can get when Oil trends look at the strong downwards wave from 13th June, 2014, to the 29th January, 2015.
Click chart to enlarge.
This chart looks at several examples during a strong trend in Oil to illustrate the concept of hammer candlestick reversal patterns not necessarily signalling the end of a trend. The biggest retracement was after the first pattern: the following two days retraced 54% of the prior fall. Thereafter, hammers were followed by zero to four days of upwards movement.
The lesson here is do not read too much into this one piece of technical analysis. On its own a hammer will more often be a sign of a pause and not a sign of a major low.
ELLIOTT WAVE ANALYSIS
Click chart to enlarge.
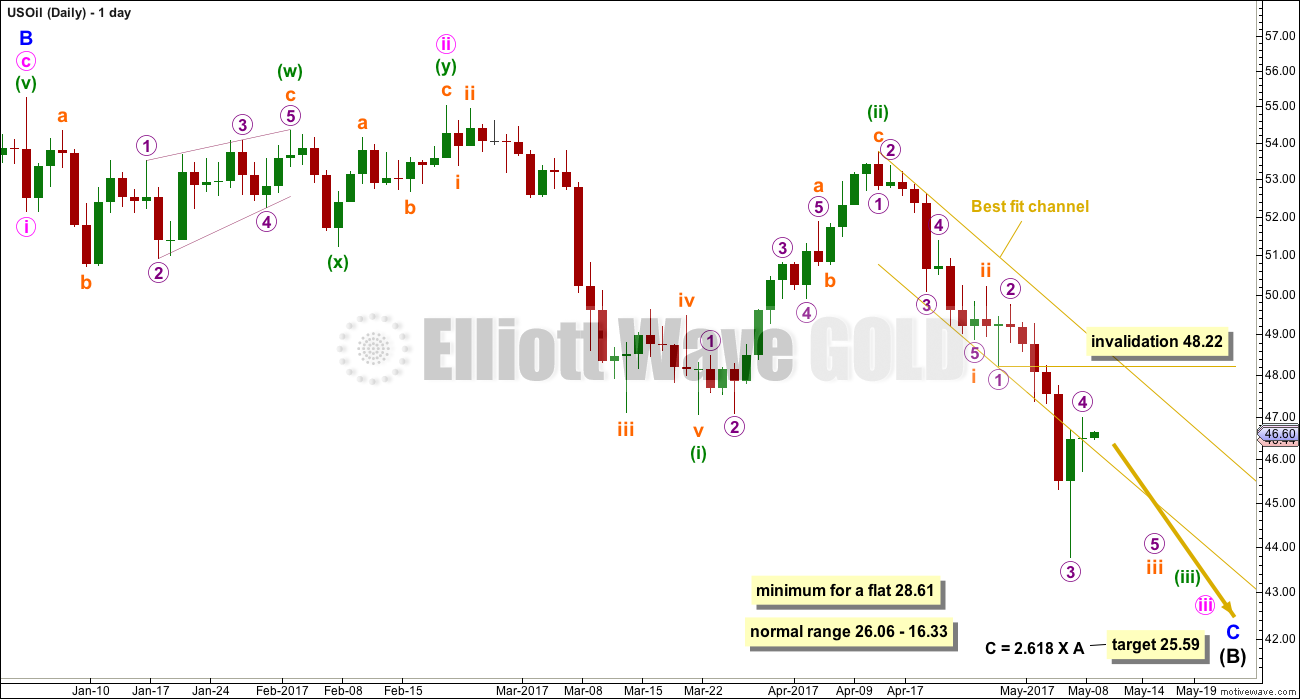
This third wave for minuette wave (iii) must move below the end of minuette wave (i) at 47.06, to meet the core Elliott wave rule, and it must move far enough below this point to allow room for a subsequent fourth wave to unfold and remain below first wave price territory.
Minor wave C must subdivide as a five wave impulse. It has begun with two deep and very time consuming second wave corrections for minute wave ii and minuette wave (ii). The upcoming fourth wave corrections for minuette wave (iv) and minute wave iv may be expected to be relatively shallow to meet the guideline of alternation.
A narrow best fit channel is added to recent downwards movement. Price may be beginning to break below the lower edge as momentum increases. Micro wave 4 may not move into micro wave 1 price territory above 48.22. Targets remain the same.
Trading advice for members only: [wlm_private “GOLD Daily YT|GOLD Daily NT|GOLD Daily NTGR|GOLD DAILY 6M NT|GOLD DAILY 6M YT|GOLD DAILY 6M NT GFR|GOLD Plus Daily YT|GOLD Plus Daily NT|OIL SILVER Weekly YT|OIL SILVER Weekly NT|GOLD Plus Daily 6M NT|GOLDPLUSDAY6M|OIL SILVER Weekly 6M NT|GOLDPLUSDAY1M|GOLDPLUSDAY1MYT|GOLDDAY6M|GOLDDAY1M|GOLDDAY1MYT|OILSILVERWEEK6M|OILSILVERWEEK1M|OILSILVERWEEK1MYT”]Pull stops down to just above the low of the 27th of April (check this point on your broker data). Add 3X the normal spread for this instrument to allow for widening spreads in times of volatility. Give the market room to move and be patient with corrections along the way because they present an opportunity to join the trend or add to existing positions. Profit target remains at 28.61 minimum.[/wlm_private]
Copper (Spot)
TECHNICAL ANALYSIS
Click chart to enlarge. Chart courtesy of StockCharts.com.
Analysis of Copper is proving very difficult.
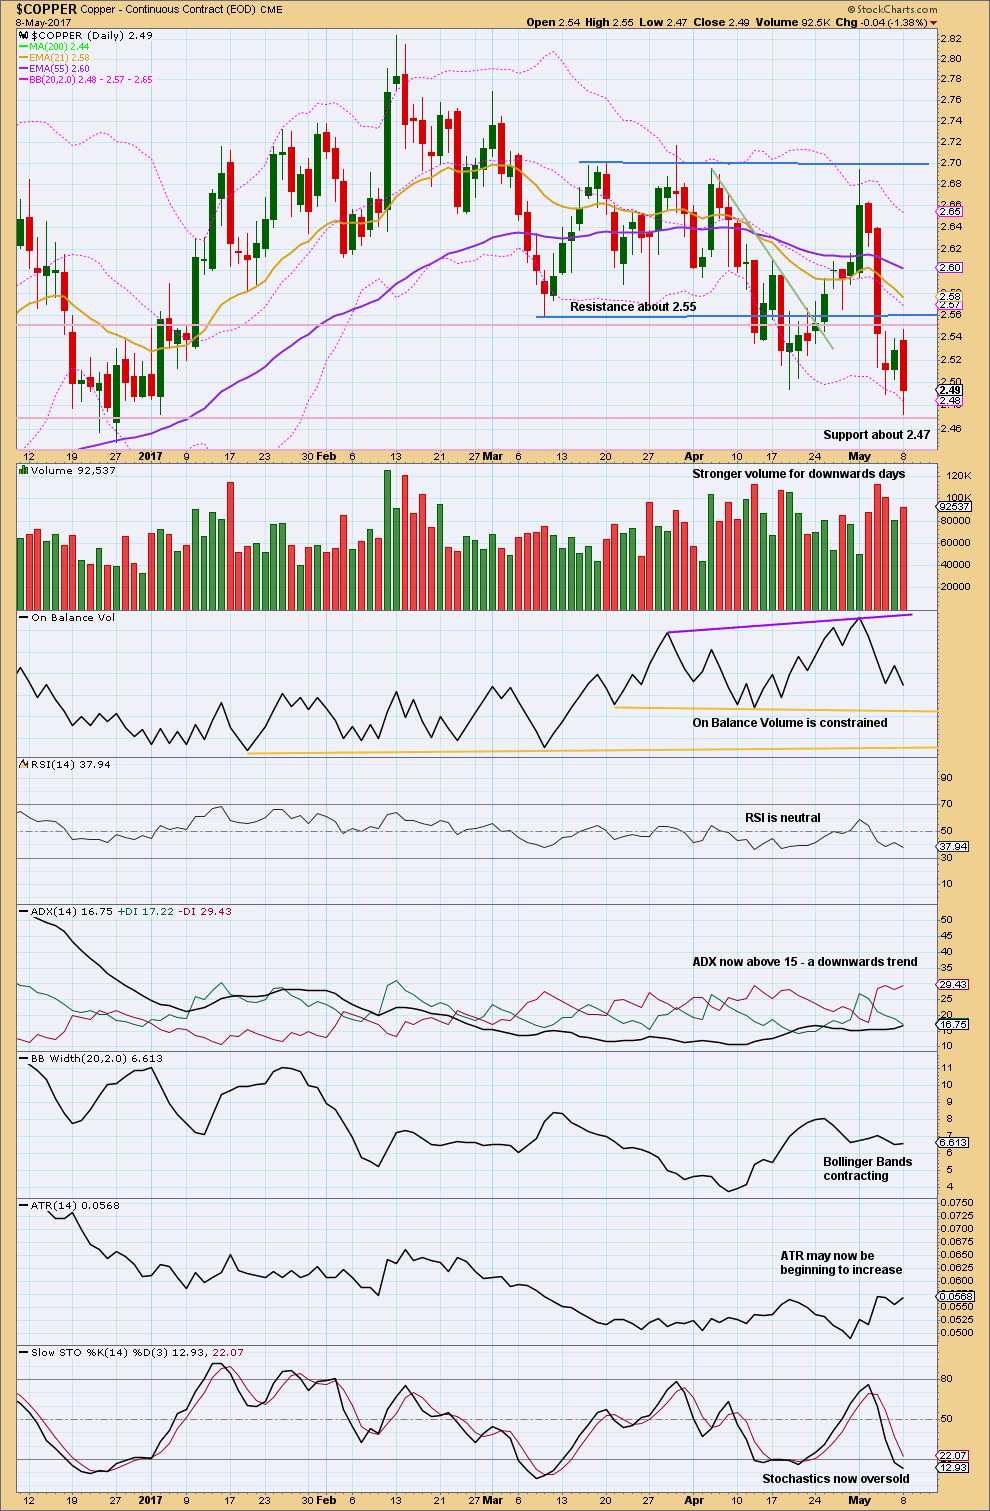
Corrections are deep. Overall, since the high on the 13th of February Copper has made a series of lower lows and lower highs.
Volume is stronger for downwards days, supporting the downwards movement in price.
ADX indicates Copper may be in the early stages of a downwards trend. The trend has not yet begun to show an increase in volatility but has begun possibly to show some small increase in range.
Price is whipsawing from support to resistance and back again in conjunction with Stochastics moving from oversold to overbought. Currently, with Stochastics in oversold territory, it seems reasonable for price to be expected to move higher here to find resistance now about 2.55. If price closes above 2.55, then next resistance would be about 2.700.
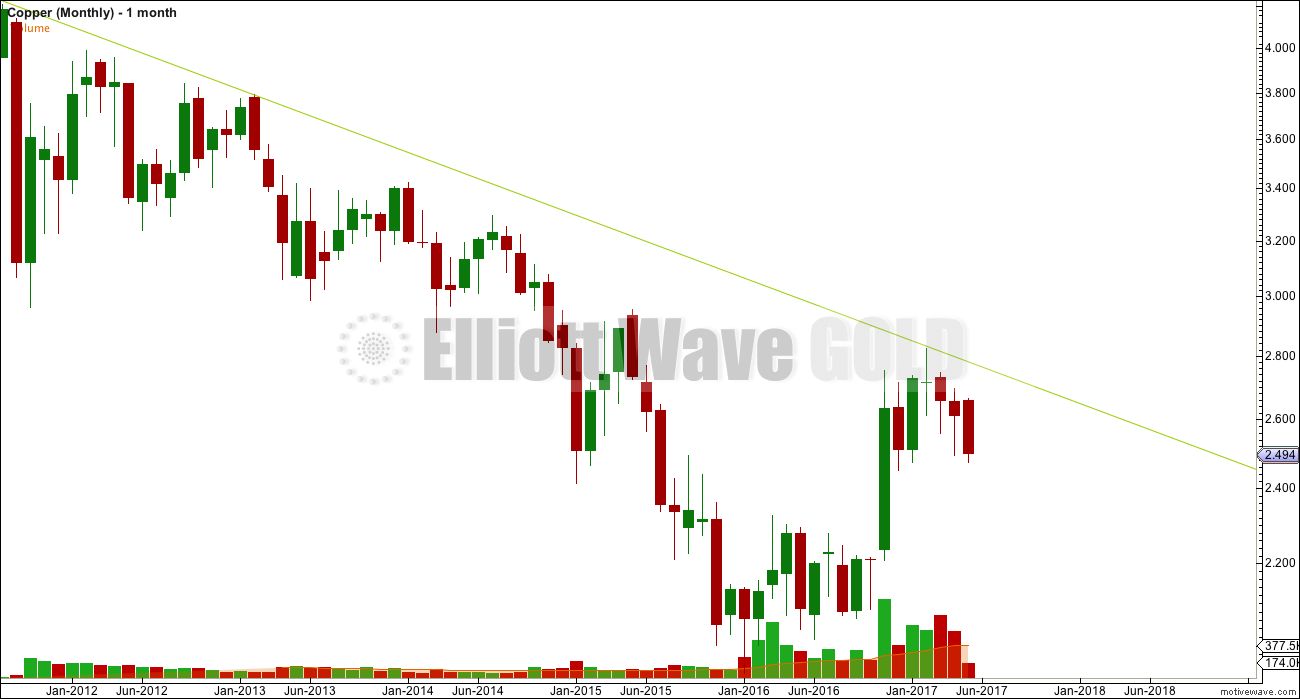
TREND LINE
Click chart to enlarge.
Copper has found very strong resistance at the green trend line, which goes back to at least August 2011. The last two complete monthly candlesticks both have long lower wicks, which is bullish.
ELLIOTT WAVE ANALYSIS
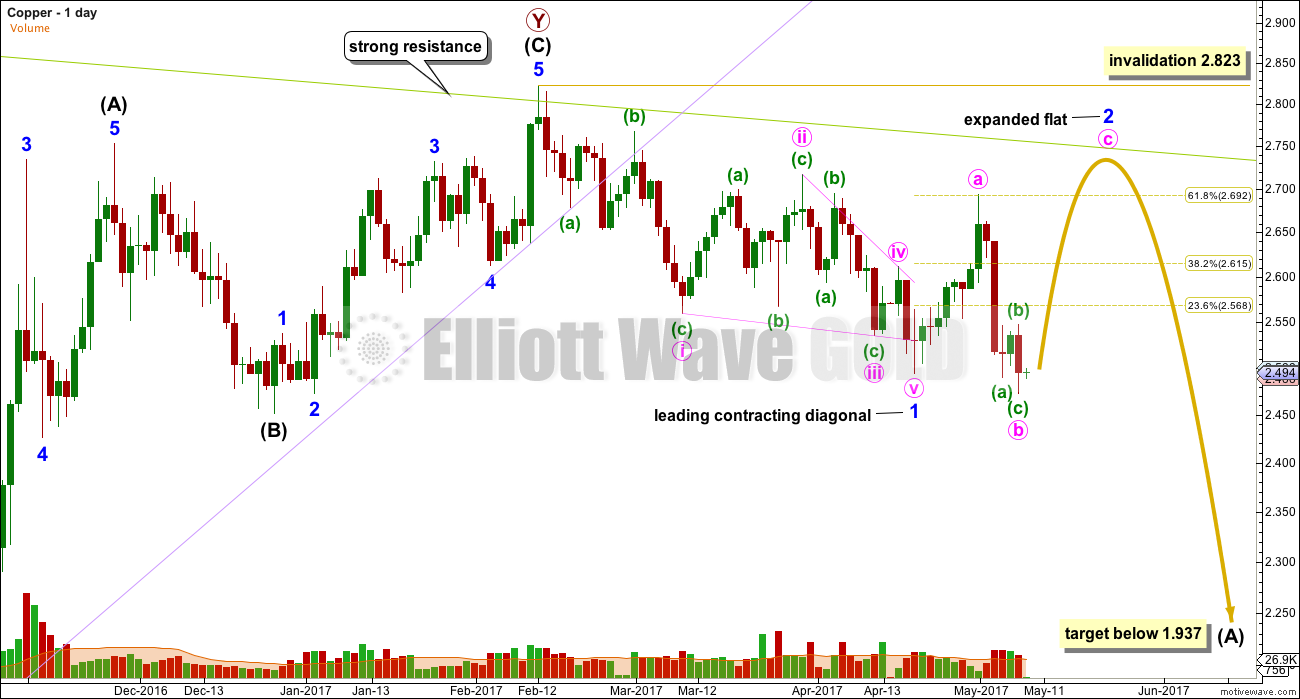
Click chart to enlarge.
Leading diagonals in first wave positions are normally followed by very deep corrections, often reasonably deeper than the 0.618 Fibonacci ratio. Given this tendency and the brevity of the correction labelled minute wave a within minor wave 2, it looks most likely that minor wave 2 shall continue for longer and be deeper.
Minor wave 2 may not move beyond the start of minor wave 1 above 2.823.
Trading advice for members only: [wlm_private “GOLD Daily YT|GOLD Daily NT|GOLD Daily NTGR|GOLD DAILY 6M NT|GOLD DAILY 6M YT|GOLD DAILY 6M NT GFR|GOLD Plus Daily YT|GOLD Plus Daily NT|OIL SILVER Weekly YT|OIL SILVER Weekly NT|GOLD Plus Daily 6M NT|GOLDPLUSDAY6M|OIL SILVER Weekly 6M NT|GOLDPLUSDAY1M|GOLDPLUSDAY1MYT|GOLDDAY6M|GOLDDAY1M|GOLDDAY1MYT|OILSILVERWEEK6M|OILSILVERWEEK1M|OILSILVERWEEK1MYT”]Wait to see if price will move up from here. It is not advised to try and trade this next movement up as it is a movement against the trend; stay with the trend. If price can make a new high above 2.694, and Stochastics reaches overbought at the same time, then enter short again. Profit target is still at 1.937.[/wlm_private]
CVX – Chevron Corp
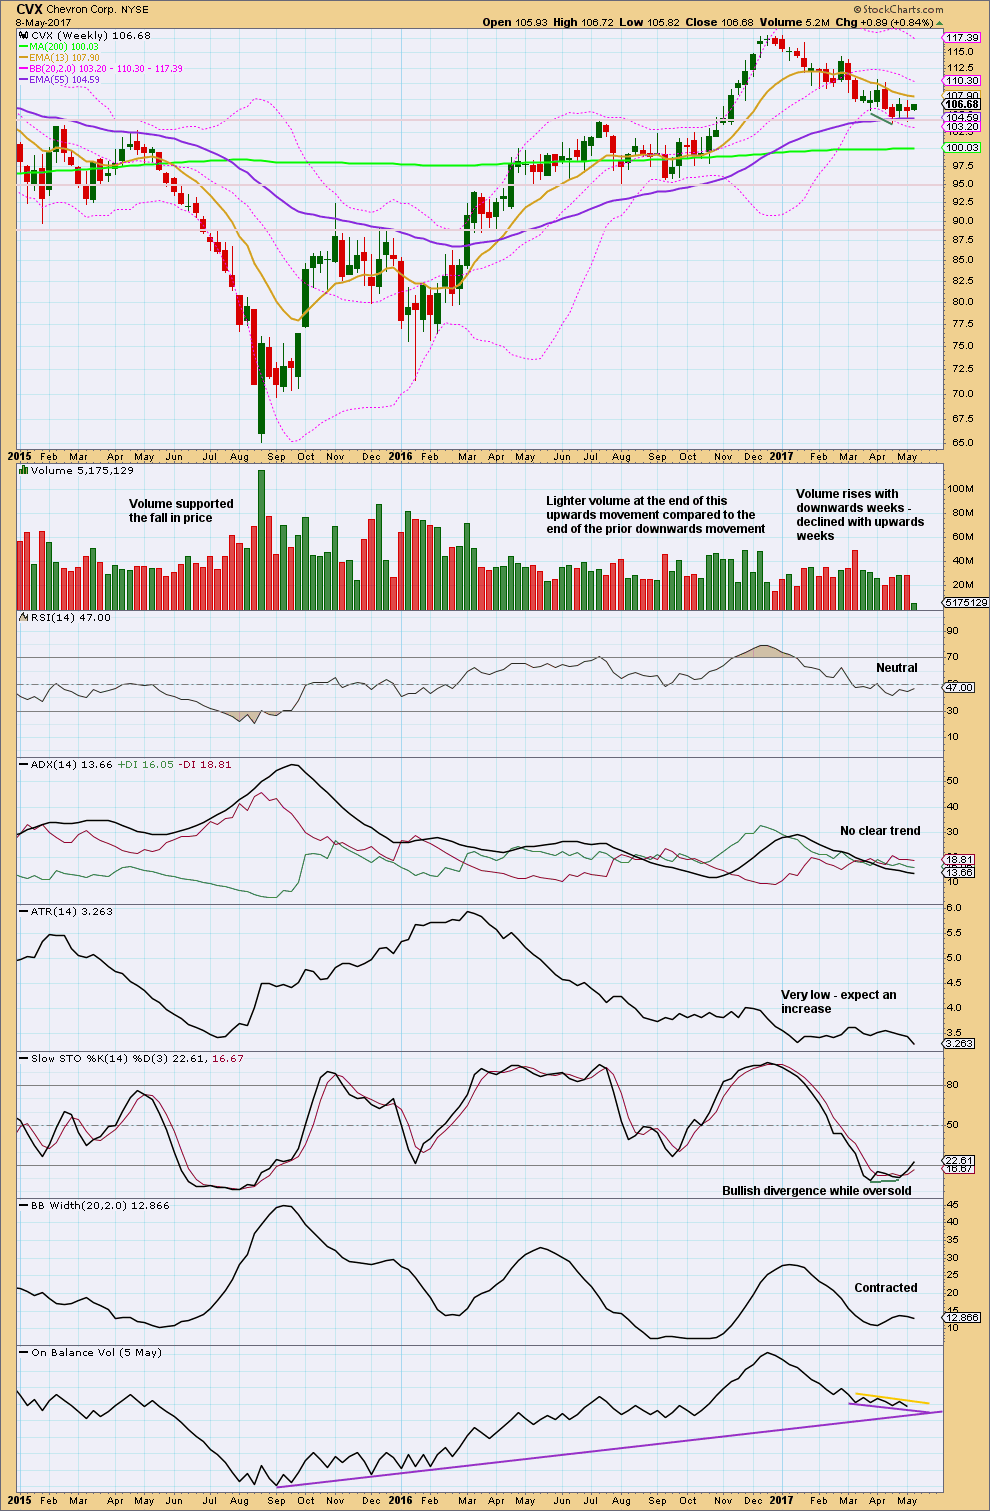
TECHNICAL ANALYSIS – WEEKLY
Click chart to enlarge. Chart courtesy of StockCharts.com.
The larger trend may still be up and should be assumed to remain so while price is above 95.64.
However, the current smaller movement looks to be down and has more support from volume.
A break below the long term purple line by On Balance Volume would be a bearish signal.
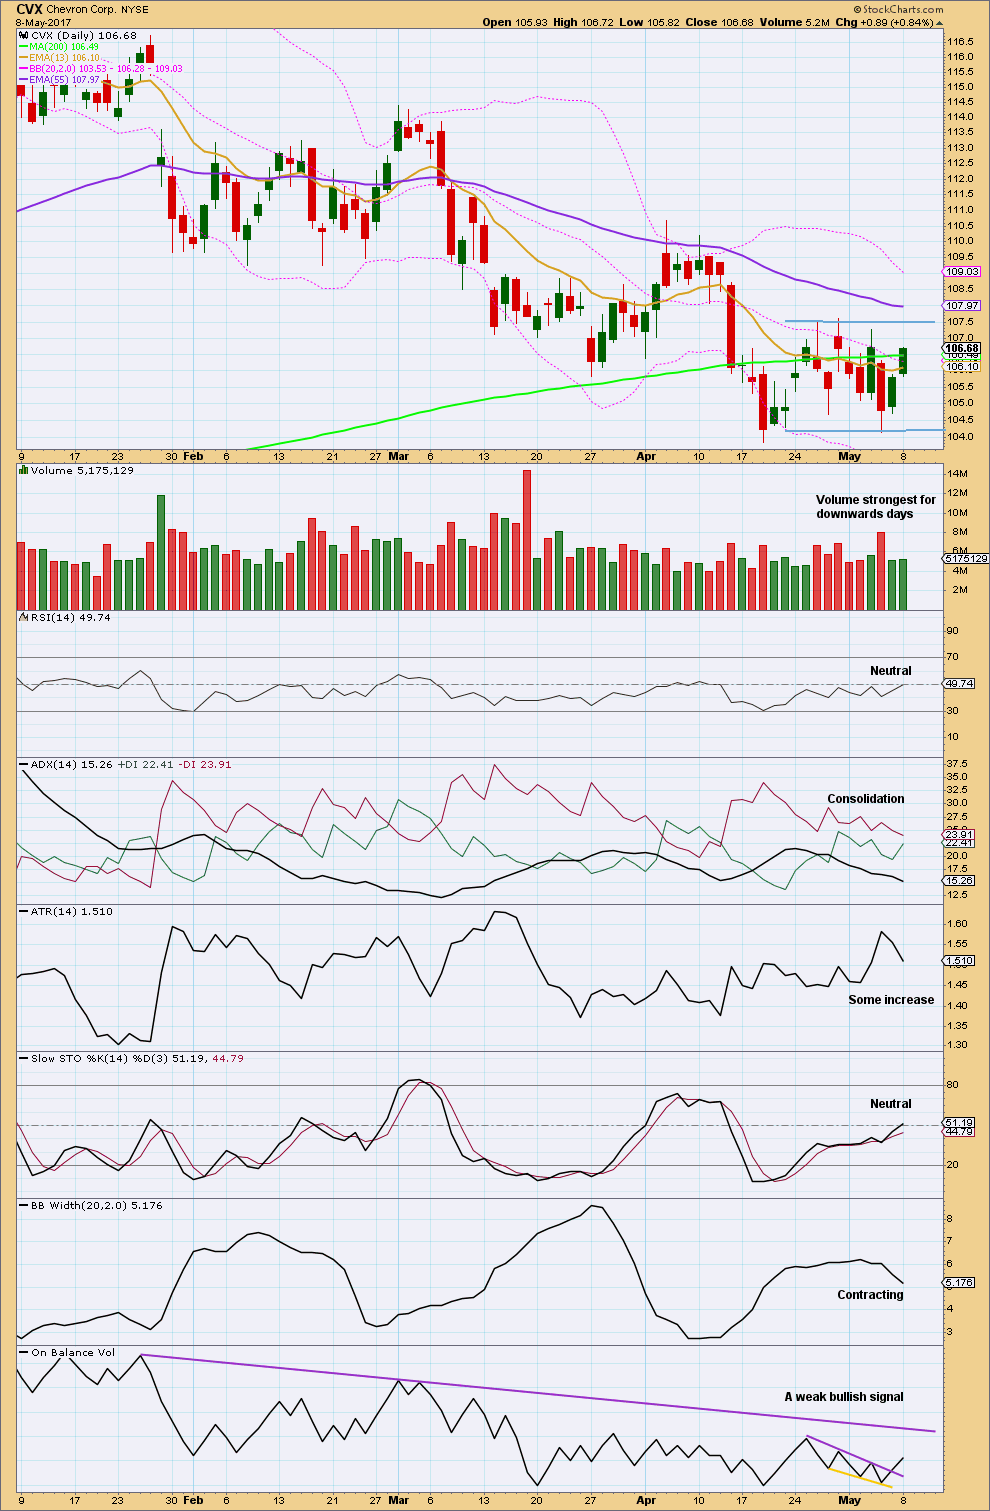
TECHNICAL ANALYSIS – DAILY
Click chart to enlarge. Chart courtesy of StockCharts.com.
CVX has been in a downwards trend since December 2016. This may be a large pullback within a bull market as seen on the weekly chart. Short and mid term averages have a negative slope. The long term 200 day average still has a slight positive slope.
Within the downwards trend are periods of consolidation. Currently, a small consolidation is unfolding and the strongest day is a downwards day, so expect a downwards breakout as more likely than upwards here.
Overall, this chart is neutral to slightly bearish.
This analysis of Chevron is included in Trading Room today as a result of a member’s request and not necessarily because it offers a good trading opportunity. It may offer an opportunity to short but only for more experienced and nimble members; this trend is not strong.
$USB – 30 YEAR US TREASURY BONDS
TECHNICAL ANALYSIS – MONTHLY
Click chart to enlarge. Chart courtesy of StockCharts.com.
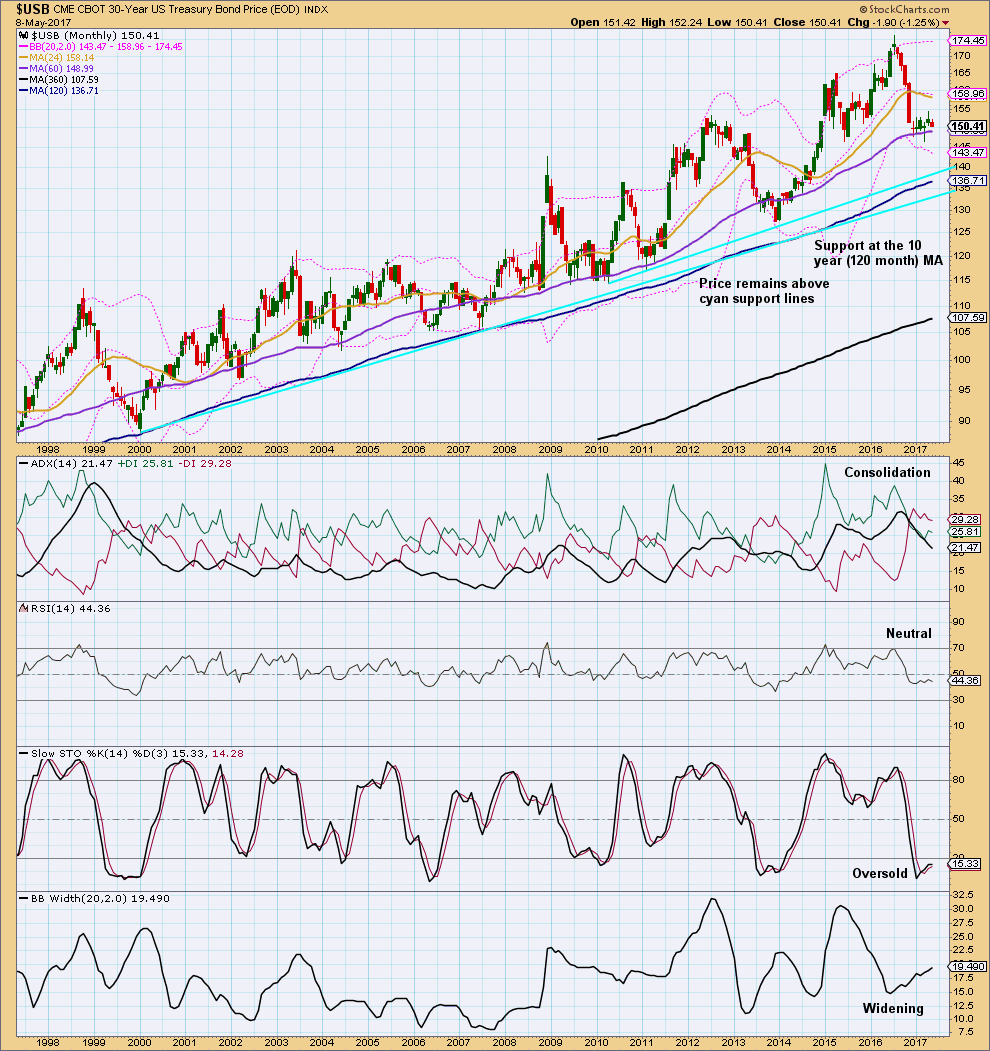
This chart looks at 20 years of data.
Bond price has remained bullish for this time. Pullbacks find final support at the 10 year moving average (dark blue). Some pullbacks fall short, finding support about the 5 year moving average (purple).
For this market to be confirmed as having switched from bull to bear, the major swing low in December 2013 should be exceeded by a new low below 127.30. Assume the bull market remains intact while price remains above 127.30.
Often at lows Stochastics exhibits divergence with price.
There is room here for price to fall further. However, with Stochastics turning up here it is also possible that the fall in price is over. The weekly chart may shed more light.
TECHNICAL ANALYSIS – WEEKLY
Click chart to enlarge. Chart courtesy of StockCharts.com.
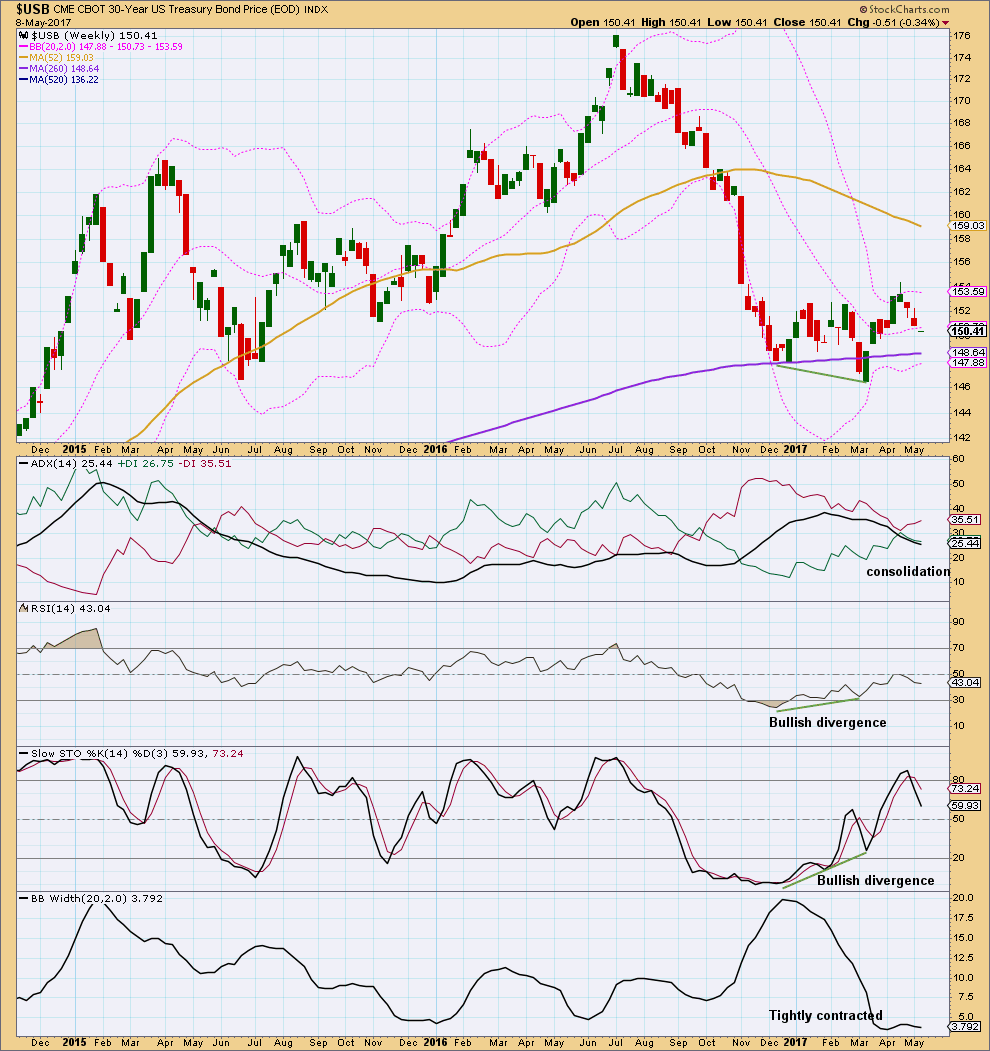
Since early July 2016, Bonds have been in a pullback within the context of a larger bull market.
Strong bullish divergence between the last two swing lows for price and RSI and Stochastics indicates downwards movement has weakened. A low may be in place.
ADX does not indicate a change from down to up nor does it indicate a trend at this time.
This analysis suffers from a lack of volume data.
At this time, it looks reasonable to assume this may be a good buying opportunity for longer term investors. Always have an exit strategy for long term investments that includes at what point the investment would be exited if price falls. Do not invest funds which you cannot afford to lose.
TRADING ROOM SUMMARY TABLES
OPEN POSITIONS

Click table to enlarge.
CLOSED POSITIONS

Click table to enlarge.
This table ends April.
RECOMMENDATIONS
[wlm_private “GOLD Daily YT|GOLD Daily NT|GOLD Daily NTGR|GOLD DAILY 6M NT|GOLD DAILY 6M YT|GOLD DAILY 6M NT GFR|GOLD Plus Daily YT|GOLD Plus Daily NT|OIL SILVER Weekly YT|OIL SILVER Weekly NT|GOLD Plus Daily 6M NT|GOLDPLUSDAY6M|OIL SILVER Weekly 6M NT|GOLDPLUSDAY1M|GOLDPLUSDAY1MYT|GOLDDAY6M|GOLDDAY1M|GOLDDAY1MYT|OILSILVERWEEK6M|OILSILVERWEEK1M|OILSILVERWEEK1MYT”]
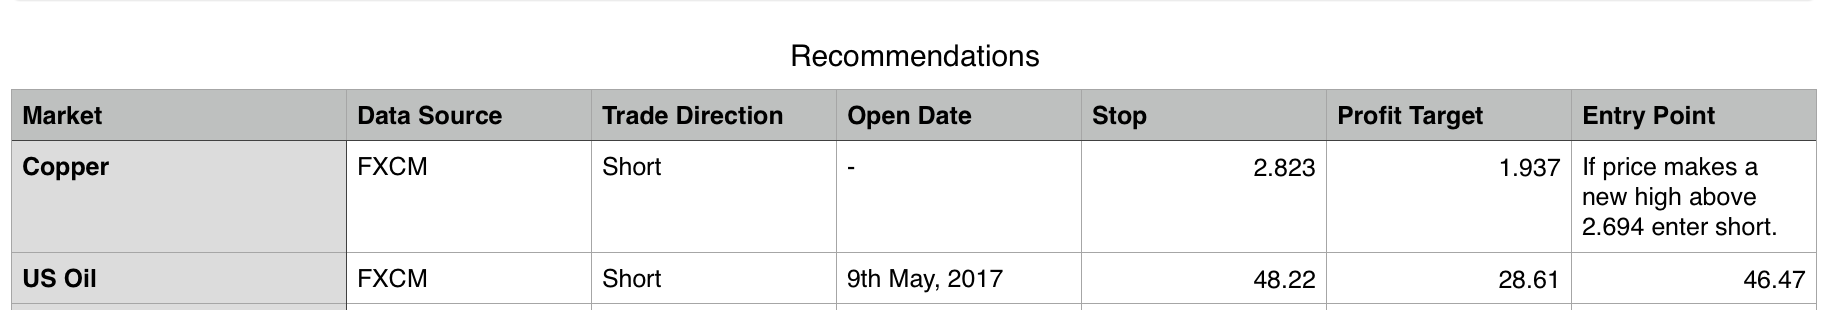
Click table to enlarge.[/wlm_private]
DISCLAIMER
To learn what the Trading Room is about see first Trading Room analysis here.
As always, it is essential that anyone using this analysis for trading advice manages risk carefully. Follow my two Golden Rules:
1. Always use a stop.
2. Never invest more than 1-5% of equity on any one trade.
Trading is about probabilities, not certainties. Failure to follow my two Golden Rules of trading indicates failure to manage risk.
Accept that this analysis may be wrong. It is impossible for any analyst to predict with certainty what a market will do next.
Trading advice will be updated throughout the week for Elliott Wave Gold members only in this comments section.
This analysis is published @ 02:18 a.m. EST.
[Note: Member comments and discussion will remain private.]
OK, thanks Lara – I understand that there is not a clear wave count
Hi Lara,
Any chance you can please look at the NZD/USD and AUD/USD please?
I keep an eye on those two daily. NZDUSD is my favourite to trade.
At this time the wave count just isn’t clear and I can’t see a good opportunity there.
When I see it I’ll publish it.
Thanks for the $USB Lara! Perhaps a week EW? Thanks!!
You’re welcome. Sorry it took so long to get to David. I get there eventually 🙂
Thanks Lara. Excellent
You’re welcome 🙂 Glad it’s appreciated.
Excellent. Thank you, Lara.
You’re very welcome 🙂