
Upwards movement was limited to no higher than 1,266.43. A small inside day had its high at 1,257.12.
Summary: Monday may see price continue sideways for a little bit longer. Thereafter, it should fall. The next wave down may be limited to no longer than 27.23, which gives a target about 1,230.
Always use a stop. Invest only 1-5% of equity on any one trade.
New updates to this analysis are in bold.
Last monthly charts and alternate weekly charts are here, video is here.
Grand SuperCycle analysis is here.
WEEKLY CHART I
Click chart to enlarge.
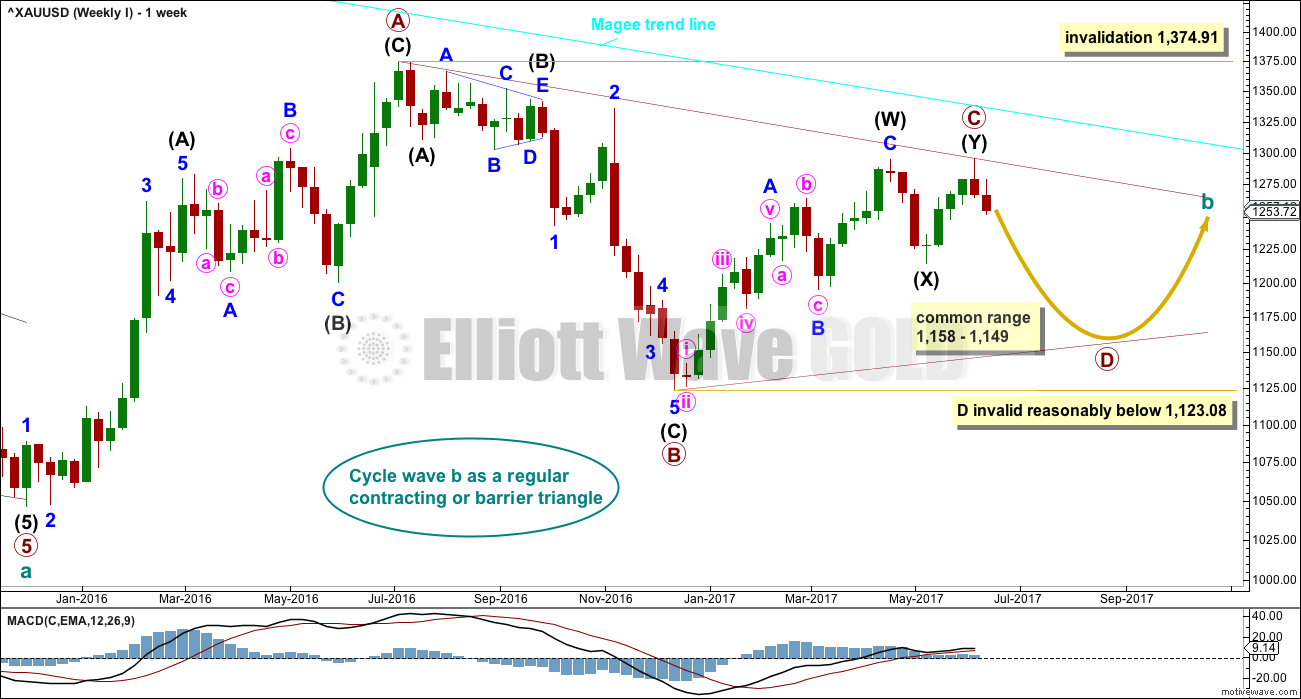
The Magee bear market trend line is added to the weekly charts. This cyan line is drawn from the all time high for Gold on the 6th of September, 2011, to the first major swing high within the following bear market on the 5th of October, 2012. This line should provide strong resistance.
At this stage, a triangle still looks most likely and has the best fit for cycle wave b.
Within a triangle, one sub-wave should be a more complicated multiple, which may be primary wave C. Primary wave C may not move beyond the end of primary wave A above 1,374.91. This invalidation point is black and white.
At this stage, it looks like primary wave C is now complete at the hourly and daily chart level. However, at the weekly chart level, it looks possible it may continue higher. This possibility must be acknowledged while price remains above 1,214.81. Within intermediate wave (Y), minor wave B may not move beyond the start of minor wave A.
Primary wave D of a contracting triangle may not move beyond the end of primary wave B below 1,123.08. Contracting triangles are the most common variety.
Primary wave D of a barrier triangle should end about the same level as primary wave B at 1,123.08, so that the B-D trend line remains essentially flat. This involves some subjectivity; price may move slightly below 1,123.08 and the triangle wave count may remain valid. This is the only Elliott wave rule which is not black and white.
Primary wave C may end when price comes up to touch the Magee trend line.
There are three alternate wave counts that have been published in the last historic analysis, which is linked to above. They are all very bullish. Members may like to review them at this stage. They will only be published on a daily basis if price shows them to be true with a new high now above 1,295.65.
DAILY CHART
Click chart to enlarge.
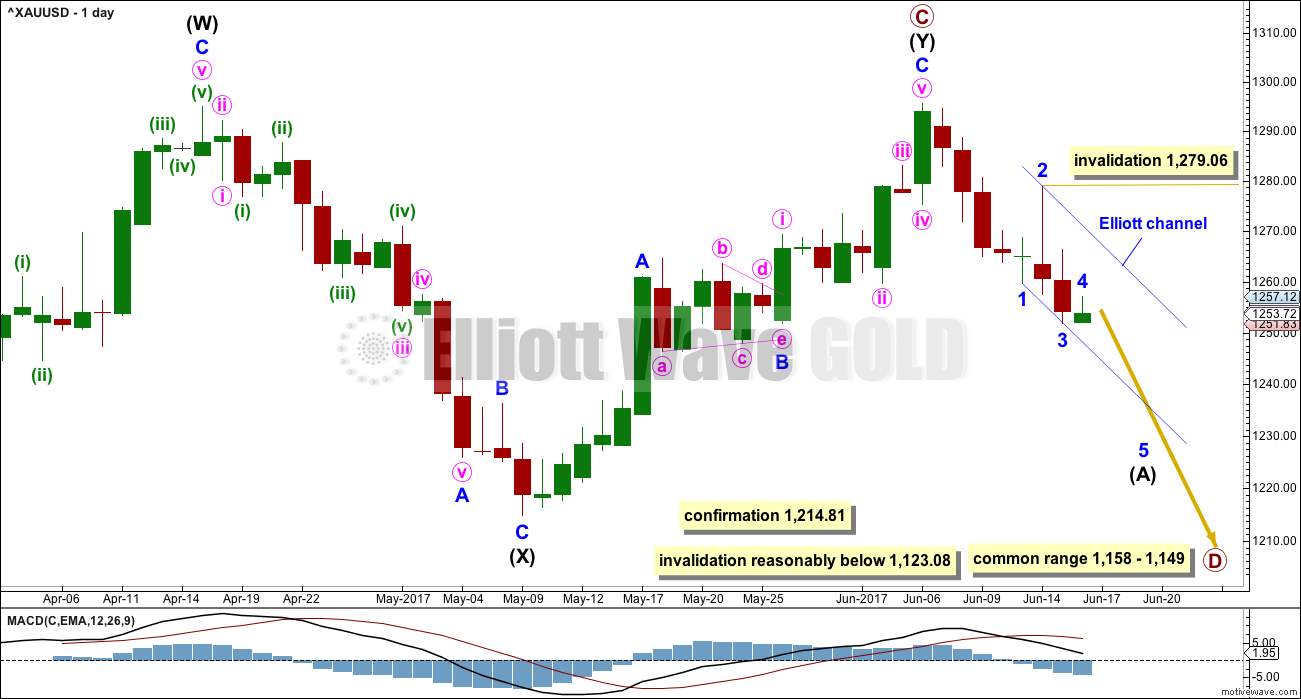
Intermediate wave (Y) may now be a complete zigzag if it is accepted that a triangle completed in the position labelled minor wave B. This has a perfect fit on the hourly chart.
Within minor wave 3, no second wave correction may move beyond its start above 1,279.06.
A new low below 1,214.81 could not be minor wave B within intermediate wave (Y) and would provide strong confirmation that intermediate wave (Y) is over.
A common range for triangle sub-waves is from about 0.8 to 0.85 the prior sub-wave, this gives a range for primary wave D from 1,158 to 1,149.
If primary wave C is correctly labelled as a double zigzag, then primary wave D must be a simple A-B-C structure and would most likely be a zigzag. Within primary wave D, minor wave B may not move beyond the start of minor wave A above 1,295.64.
Primary wave A lasted 31 weeks, primary wave B lasted 23 weeks, and primary wave C may have been complete in 25 weeks.
Primary wave D should be expected to last at least 8 weeks (but most likely longer). The next Fibonacci ratio in the sequence would be a Fibonacci 13 and then 21.
HOURLY CHART
Click chart to enlarge.
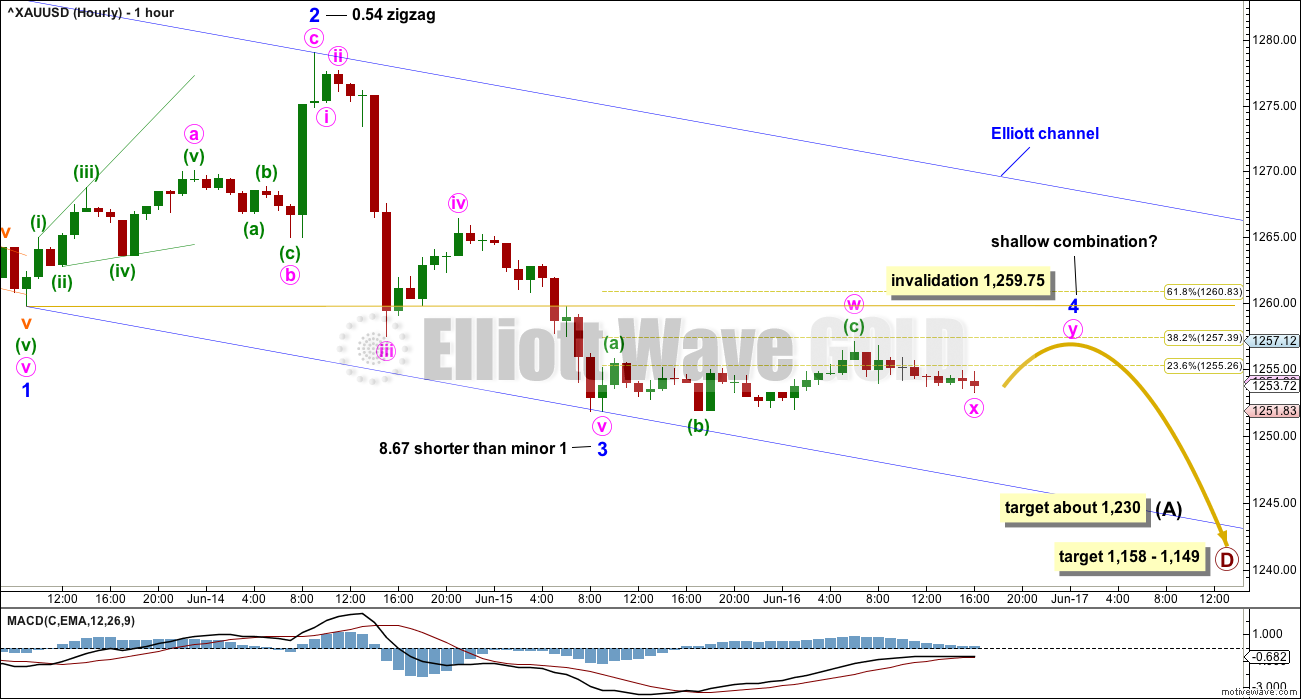
Minor wave 2 fits as a deep 0.54 zigzag, falling a little short of the 0.618 Fibonacci ratio of minor wave 1 and a little below the lower edge of the best fit channel.
Minor wave 3 may only subdivide as a simple impulse, and now it may be complete.
The wave count is adjusted today to fit with momentum on MACD; the third wave should be the strongest portion of movement. It is also adjusted to fit with the look at the daily chart level. Both the corrections of minor waves 2 and 4 show up at higher time frames now, so they look like they should be labelled at the same degree.
If minor wave 3 is over, then it is shorter than minor wave 1. A core Elliott wave rule states a third wave may never be the shortest. To meet this rule minor wave 5 will be limited to no longer than equality with minor wave 3 at 27.23. It may end about 1,230.
Minor waves 2 and 4 exhibit good alternation. Minor wave 4 may continue further sideways when markets open on Monday to complete as a combination or a triangle.
If minor wave 4 completes as a triangle, then minor wave 5 may be remarkably short and brief. The target about 1,230 may then be too low.
Minor wave 4 may not move into minor wave 1 price territory above 1,259.75.
When minor waves 4 and 5 are complete, then an impulse would be complete for intermediate wave (A). A bounce, which may be deep, would then be expected for intermediate wave (B) and should last at least a week and probably longer.
Short positions may be exited if the target at 1,230 is met or upwards movement breaks above the blue Elliott channel after new lows.
TECHNICAL ANALYSIS
WEEKLY CHART
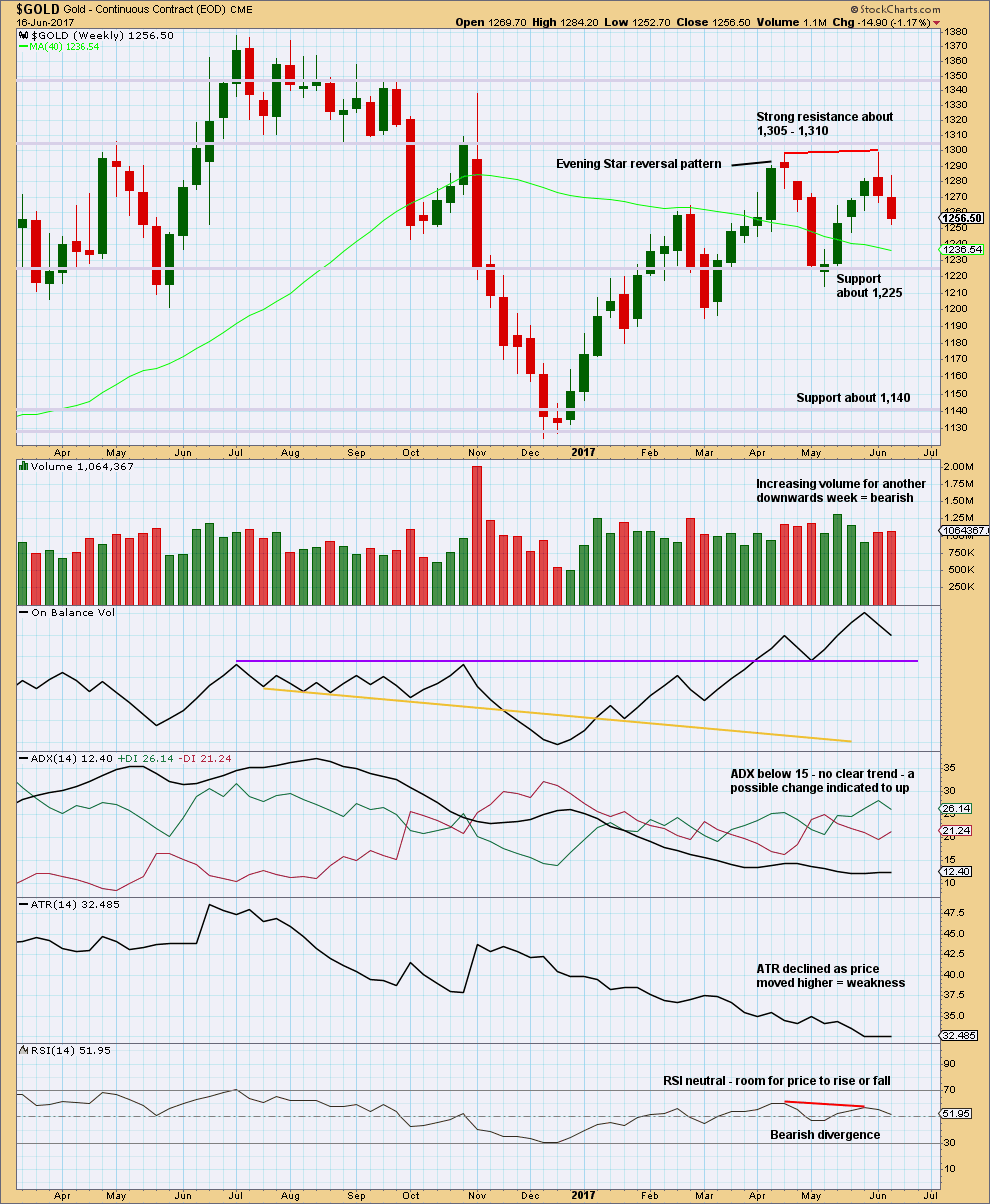
Click chart to enlarge. Chart courtesy of StockCharts.com.
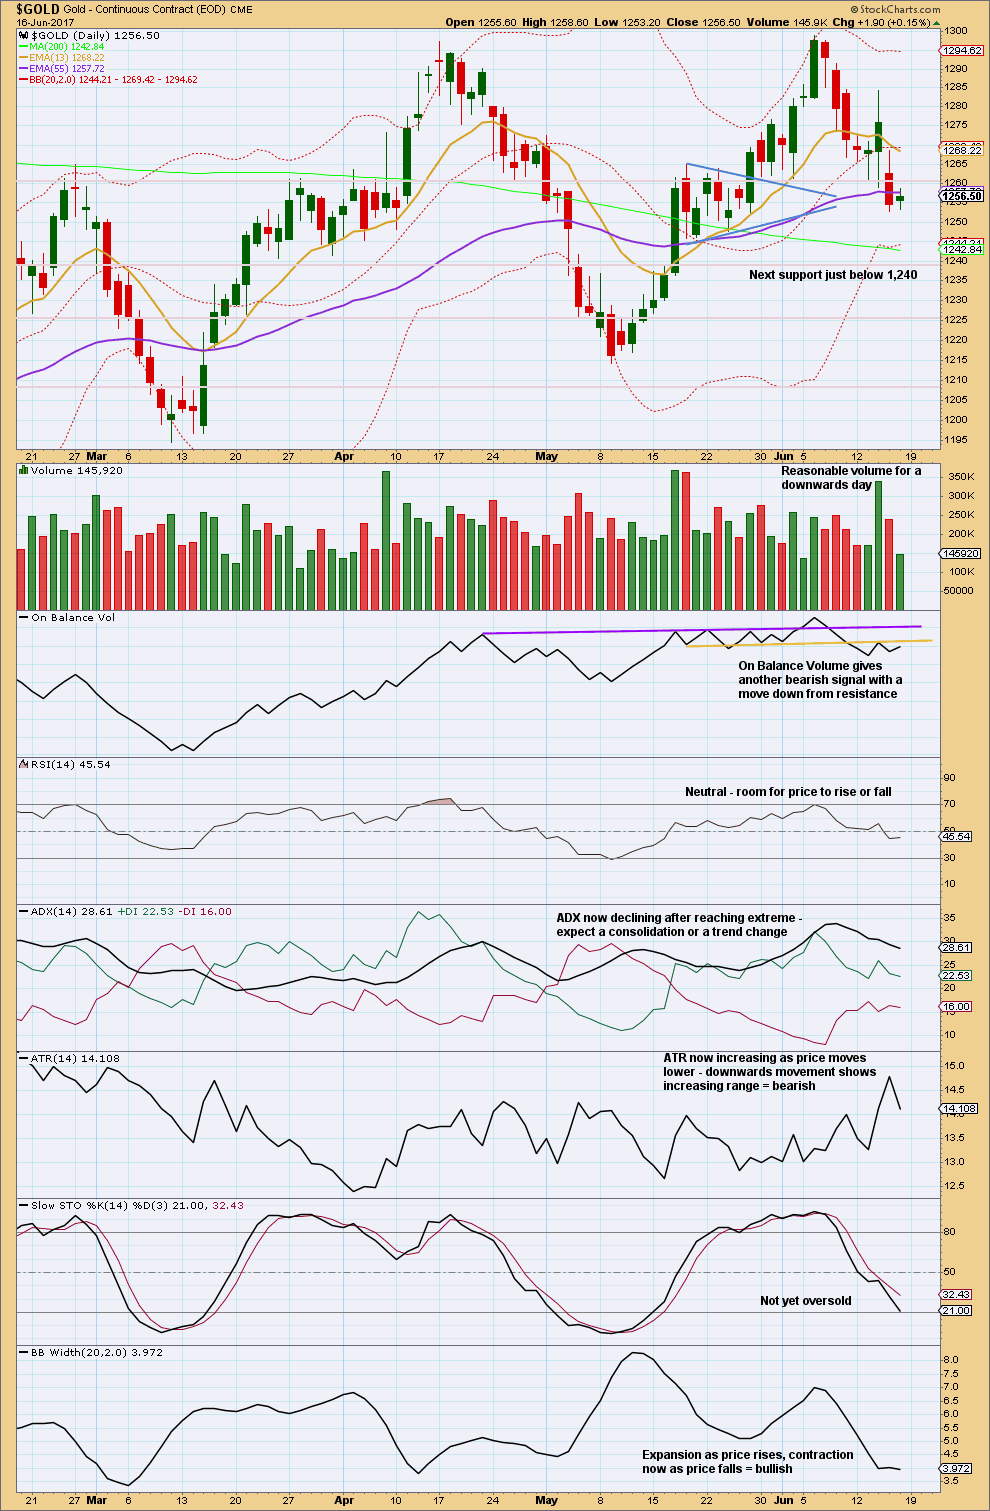
The long upper wicks on the last two weekly candlesticks are bearish. Volume supports the downwards movement in price, so this is not suspicious.
Declining ATR fits with the Elliott wave count at the weekly chart level; this is normal for triangles.
DAILY CHART
Click chart to enlarge. Chart courtesy of StockCharts.com.
Support about 1,260 has given way. Next strong support is just below 1,240.
A small inside day for Friday completes a very small spinning top candlestick pattern. This puts the trend temporarily from down to neutral. A lack of support for upwards movement during Friday’s session is bearish; bulls lacked strength on Friday.
Still give reasonable weight to bearish signals from On Balance Volume. This supports the Elliott wave count.
GDX
DAILY CHART
Click chart to enlarge. Chart courtesy of StockCharts.com.
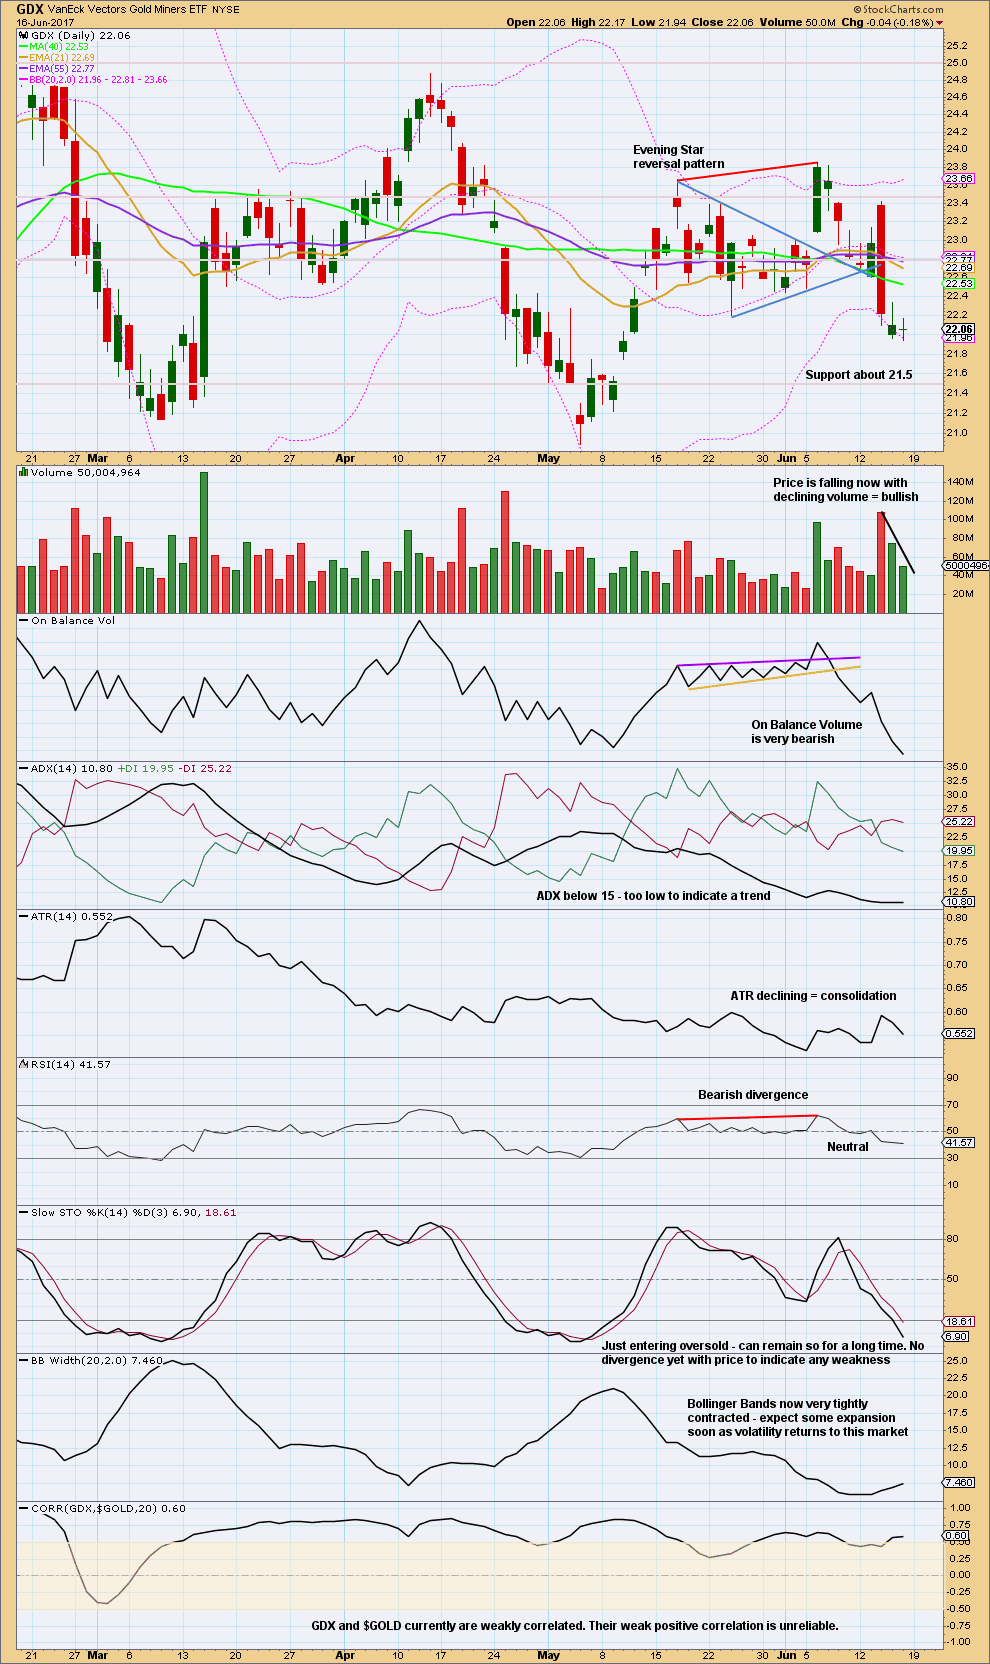
GDX sometimes leads the way for Gold. It is now running out of steam with downwards movement having smaller range and weaker volume. This may precede a bounce for both Gold and GDX.
Any upwards movement here should be expected to most likely be a counter trend bounce. On Balance Volume is very bearish indeed. Give that indicator reasonable weight.
This analysis is published @ 06:25 p.m. EST on 17th June, 2017.
GLD sitting just atop the 200 dsma. Gold futures hinting we will get a decisive break, unless of course something changes in the next 24 hours. I will be adding to short positions with a decisive break below.
Methinks, from an EW perspective, that Minor 4 decided to become a simple zigzag, ending at 1257.11 where Lara placed Minute W. (If Minor 4 had continued as originally thought, then the expanded flat looks disproportionate to the other same degree waves).
The drop in Minor 5 would target 1229.80 where Minor 5 = Minor 3. This is the position that Lara envisages.
Alternatively, if Minor 5 = 0.618 * Minor 3, then Minor 5 would target 1240.28. (In my alternate scenario, this is the end of the corrective wave from 1295.65, and the next action is a substantial Wave 3 run). Anyway, this is close to Minute 1 of Minor 5 in Lara’s scenario, and it calls for a bounce, just as Ichimoku predicted. In the daily chart, the drop should stop at 1241.38 lowest, before the bounce occurs.
If Lara’s count is correct, the bounce would not exceed 1257.11, where Minor 5 began. But, if Minor 5 had ended, as in the alternate scenario I presented, then the bounce will be substantial — the start of a new uptrend. The critical decision point, obviously, is 1257.11.
In any case, I’ll be cashing out my shorts at the low, anywhere from 1245.30 to 1241.38.
Alan, thank you so much for the charts and commendary you are posting daily. I have been reading your posts and consider these invaluable (especially for a newbie like myself). Your effort and contribution is much appreciated!
Christos, thanks. I’m sure Alan appreciates the feedback.
Alan, I’m also sure there are a great many other members here who are reading your analysis and who appreciate it. You, Dreamer and Papudi especially are developing a following, along with Verne’s commentary and trading sharing.
Imo slightly concerned about a likely rally on Monday possibly into 1260-65 price territory subject to Gold price sustains above pivot; on weekly outlook basis expecting a pullback though and will look to go long on it (the drop). Lets see how this plays out.
Cheers Syed. Maybe that rally will come… just a little later than you expected.
John, and others trading in silver, this is for you. Do note that the silver market is very intense, mainly because the volume is much smaller than the gold market. Prices have less inertia going for it, and so they move much faster. The market will continue to be volatile in general, because it almost always is. Any form of technical analysis can turn around on its head quickly, and can even be rendered void. That’s the reason you hardly find any analyst out there doing this market: they don’t want to lose face, but more importantly, their subscriber base. My experience dealing with the silver market is that it is always a great challenge doing so. Being nimble with small positions is the best ploy. Buy-and-hold is a no-no, unless one has a lot of money, and don’t mind contributing to other investors.
SILVER Weekly Ichimoku Analysis
Data as at the close of June 16
===========================
Like gold, silver tried to rally early in the week but it was short-lived. The Fed saw to that. Prices dropped below both the tenkan-sen and the kijun-sen, and the cloud has been red for about half a month already. If not for the fact that the tenkan-sen still resides above the kijun-sen a full-blown bear market is established. The bottom cloud boundary is sloping downwards, allowing for further price drops. Unlike gold, in which the cloud boundary is supportive of the bulls, in silver it is accomplice to the bears. The 16.90 support has already given way, and the last shreds of defence lies in the upward sloping brown trendline, and failing that, the 16.05 support. If prices should break down below the uptrend line, and more importantly the 16.05 level, that would be an extraordinarily bearish sign for silver.
As long as we can stay above that uptrend line things look good, and because of this the downtrend can be somewhat short-lived. The market would ultimately make a move for 17.00, which resides at the bottom cloud boundary. It would be followed by 18.00 if it can shake free of the shackles of the bear.
Alan, thank you so much for this silver update and your usual gold updates. You are exactly right about no long holds, just quick scalp trades only in silver. Here in the US, we have USLV & DSLV. They have sufficient volume and liquidity for most retail traders. The 3X leverage adds risk, but also can richly reward a trader when they are correct about the direction of silver.
Thanks again, for this much appreciated update.
John. I have traded USLV and DSLV before. They are like NUGT and DUST, a good servant and also a bad master. When they rise, profits are good. But when they fall, it’s terrible. Unlike gold ETFs, they have lower volume, and sometimes quite large spreads.
The option spreads on those leveraged beasts are awful. If you trade the options, way to do it is get positioned ahead of their move by selling counter trend credit spreads and waiting for the turn to close the short leg. A bit tedious but for option traders the best way to ensure a profit worth the effort. When the spreads are so wide you barely eke out a gain even when there is a strong move in your favour, unfortunately.
End of Week Analysis
Data as at the close of June 16
=========================
The predictions of the previous Weekend Analysis played out exactly as planned, a most satisfactory outcome. Gold markets initially tried to rally during the week, but found strong resistance at the 1275-1280 region to turn around, triggered by the adverse investor reaction to the hawkish Fed statement. On the southward trip, prices sliced easily through the 1260 level followed by the 1255 level, and almost attacked the 1250 level which is an even stronger support.
The Daily Ichimoku Chart shows that bulls have refused to relinquish control even though they have been severely weakened, prices having already dropped below both the tenkan-sen and the kijun-sen. Defiantly, the cloud remains green, and the tenkan-sen is still lying above the kijun-sen. The top cloud boundary is sloping downwards, abetting the bulls. Given the obstinate nature of the bull, I believe that the 1245.30 level ought to hold out. If the bears are relentless, and they have to find renewed vigour for this to happen, there is a little leeway in the cloud turning briefly red towards the middle of the week. Even if the 1245.30 level gives way, I’m sure the mid-term support uptrend line (drawn in brown) would cushion the fall. This is in agreement with Lara’s 1230.
Once the low is reached, the Ichimoku chart indicates a rebound lasting at least one month. The big question remains: how high are prices expected to climb? Lara’s triangle scenario stipulates that 1295.65 is the upper limit, after which a waterfall is expected for Intermediate C of Primary D, which means that the support trendline must then be breached. On the other hand, the bullish scenario is adamant that prices will soar to at least 1380 before a more meaningful drop happens. Confidence in the prowess of the bull, as well as confirmation of the demise of the bear, occurs if prices rise above 1295.65.
The much anticipated slaughter of the bull did not happen on Friday. On the contrary, sellers appear to be dragging their feet as prices crawled to attempt to reach the very-important 1245.30 bottom cloud boundary support. The bears appear to be very exhausted, the bulls have not yet caught their second wind, and so the beginning of next week should still see the war between them playing out, albeit with lessened ferocity. Volatility should still continue, and the market remains choppy, but I’m sure the week should end with the bull regaining some strength and mounting a counter-offensive, trying to recapture the lost 1260 territory, and then the 1275 after that. This is because the bears had been given a steroid injection by the Fed but the bulls had shown a significant amount of resiliency, especially with the dormant global political scene last week.
Thank you very much Alan for this analysis.
Lara, my pleasure.