
The main Elliott wave count expected upwards movement. An inside day has closed green.
Summary: Price is consolidating. The Elliott wave count sees intermediate (B) continuing as either a flat or triangle. Consolidations do not present good trading opportunities, but at their end they offer an entry to join the larger trend.
New updates to this analysis are in bold.
Last monthly charts and alternate weekly charts are here, video is here.
Grand SuperCycle analysis is here.
WEEKLY CHART
Click chart to enlarge.
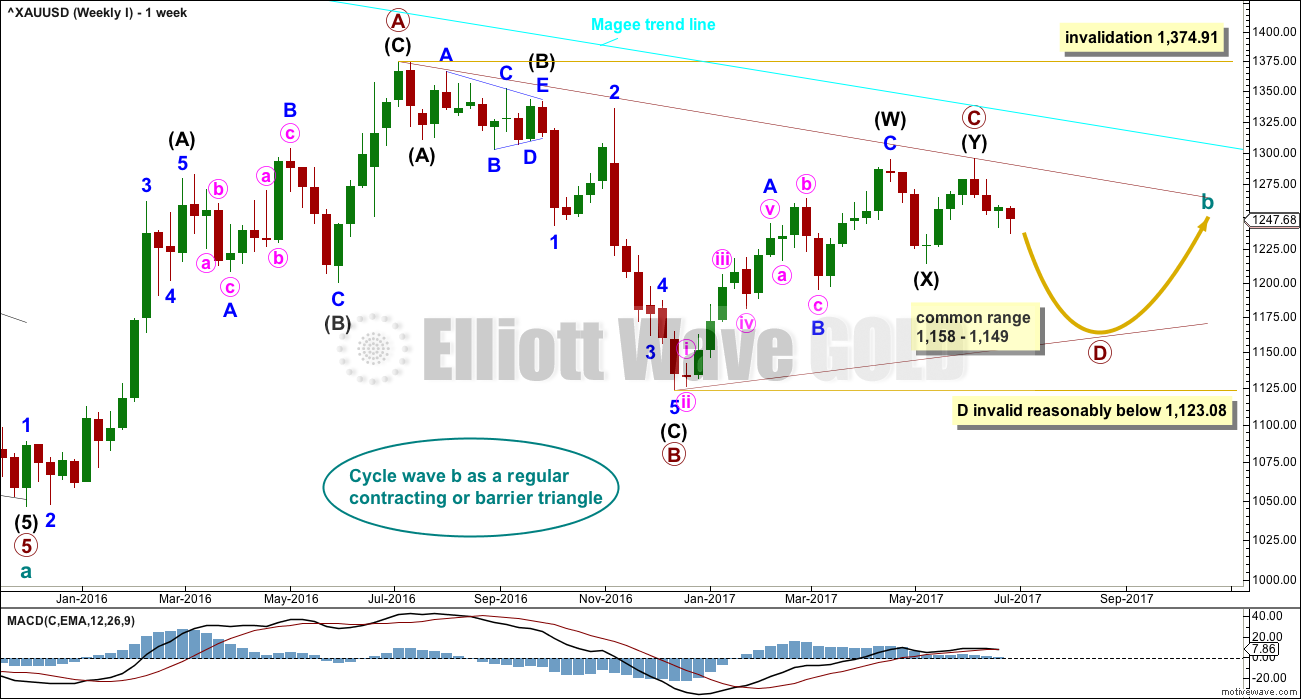
The Magee bear market trend line is added to the weekly charts. This cyan line is drawn from the all time high for Gold on the 6th of September, 2011, to the first major swing high within the following bear market on the 5th of October, 2012. This line should provide strong resistance.
At this stage, a triangle still looks most likely and has the best fit for cycle wave b.
Within a triangle, one sub-wave should be a more complicated multiple, which may be primary wave C. Primary wave C may not move beyond the end of primary wave A above 1,374.91. This invalidation point is black and white.
At this stage, it looks like primary wave C is now complete at the hourly and daily chart level. However, at the weekly chart level, it looks possible it may continue higher. This possibility must be acknowledged while price remains above 1,214.81. Within intermediate wave (Y), minor wave B may not move beyond the start of minor wave A.
Primary wave D of a contracting triangle may not move beyond the end of primary wave B below 1,123.08. Contracting triangles are the most common variety.
Primary wave D of a barrier triangle should end about the same level as primary wave B at 1,123.08, so that the B-D trend line remains essentially flat. This involves some subjectivity; price may move slightly below 1,123.08 and the triangle wave count may remain valid. This is the only Elliott wave rule which is not black and white.
Primary wave C may end when price comes up to touch the Magee trend line.
There are three alternate wave counts that have been published in the last historic analysis, which is linked to above. They are all very bullish. Members may like to review them at this stage. They will only be published on a daily basis if price shows them to be true with a new high now above 1,295.65.
DAILY CHART
Click chart to enlarge.
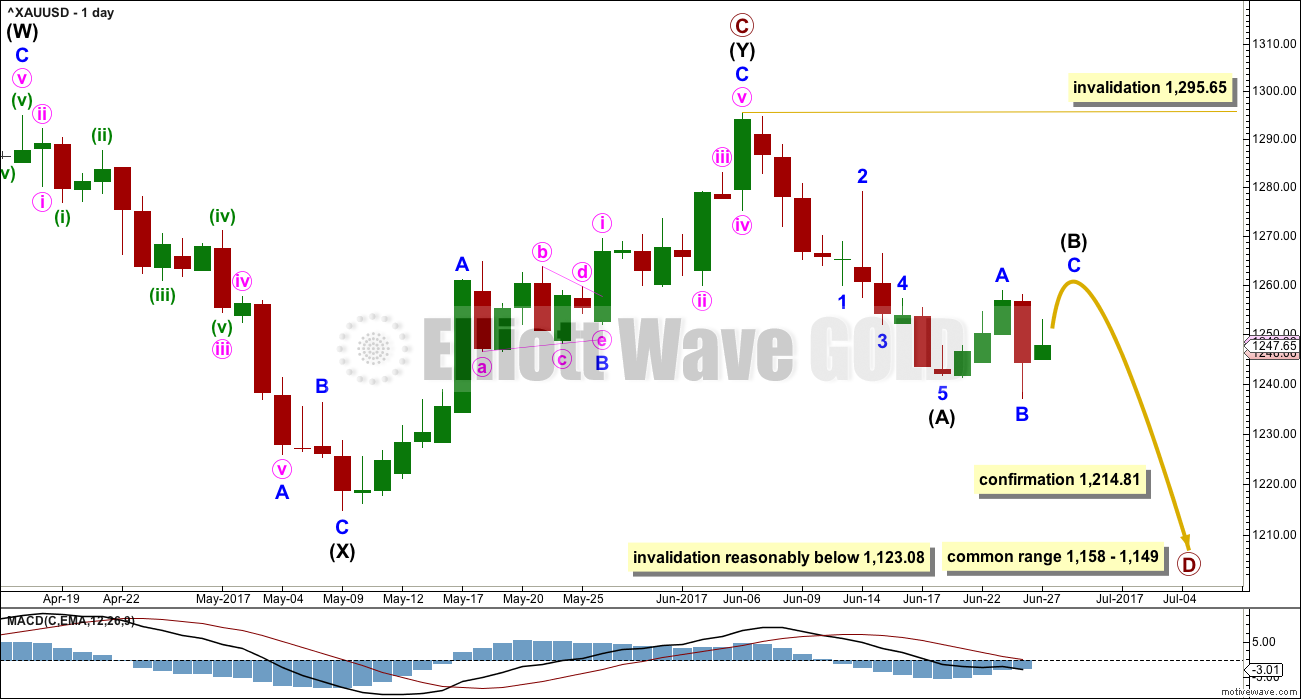
Intermediate wave (Y) may now be a complete zigzag if it is accepted that a triangle completed in the position labelled minor wave B. This has a perfect fit on the hourly chart.
A new low below 1,214.81 could not be minor wave B within intermediate wave (Y) and would provide strong confirmation that intermediate wave (Y) is over.
A common range for triangle sub-waves is from about 0.8 to 0.85 the prior sub-wave, this gives a range for primary wave D from 1,158 to 1,149.
If primary wave C is correctly labelled as a double zigzag, then primary wave D must be a simple A-B-C structure and would most likely be a zigzag. Within primary wave D, intermediate wave (B) may not move beyond the start of intermediate wave (A) above 1,295.64.
Intermediate wave (A) lasted only ten days. So far intermediate wave (B) has lasted five. If it concludes within three more sessions, it may total a Fibonacci eight days. This would be a reasonable proportion to intermediate wave (A).
So far it looks like intermediate wave (B) may be completing as an expanded flat correction. It is also possible to move the degree of labelling within this expanded flat down one degree; it may only be minor wave A or W of a more time consuming flat or combination for intermediate wave (B).
The main hourly chart below follows on from the labelling here on the daily chart.
For the alternate hourly chart below, the end of intermediate wave (B) would be labelled as complete at the high of minor wave A on the 23rd of June.
Primary wave A lasted 31 weeks, primary wave B lasted 23 weeks, and primary wave C may have been complete in 25 weeks.
Primary wave D should be expected to last at least 8 weeks (but most likely longer). The next Fibonacci ratio in the sequence would be a Fibonacci 13 and then 21.
HOURLY CHART
Click chart to enlarge.
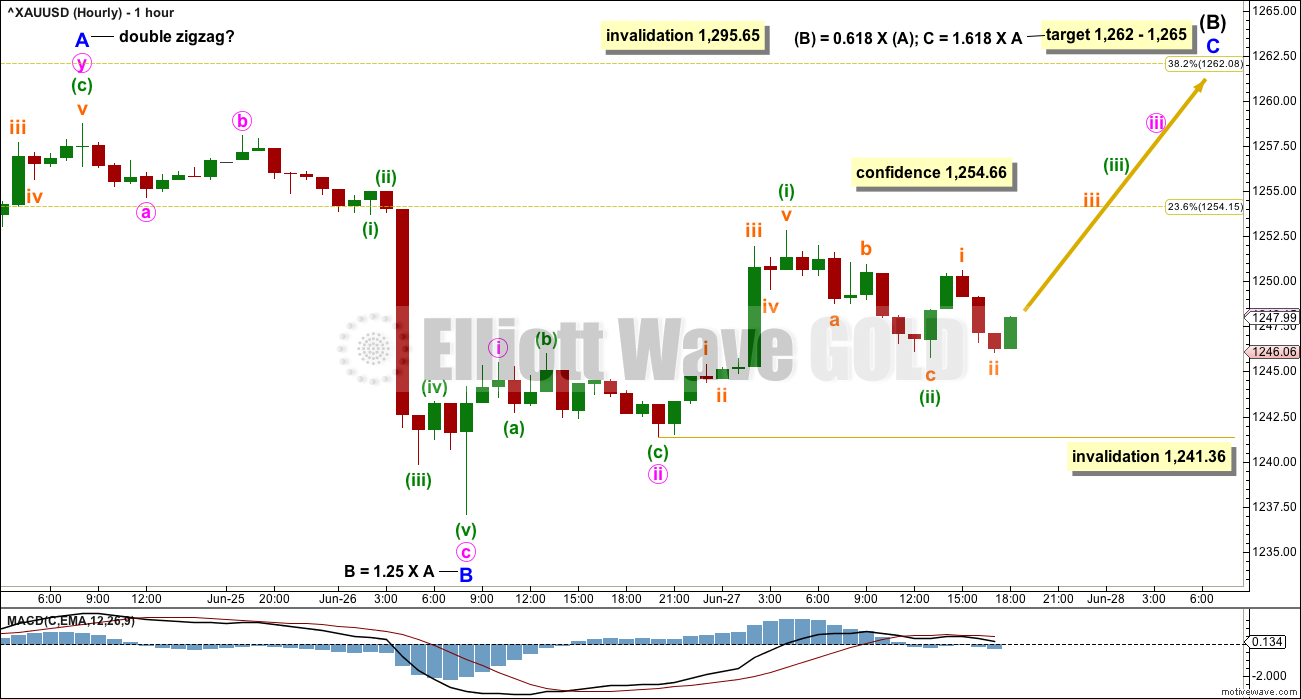
An expanded flat may be unfolding. This may be intermediate wave (B) in its entirety as labelled. Or the degree of labelling may be moved down one degree so that it may be an expanded flat for minor wave A or an expanded flat for minor wave W, as the first structure in a double combination.
The common range for B waves within flats is from 1 to 1.38 the length of their A waves. Here, minor wave B is within the common range.
Minor wave C upwards must unfold as a five wave motive structure, either an impulse or an ending diagonal. An impulse is more likely. The correction of minuette wave (ii) may not move beyond the start of minuette wave (i) below 1,241.36.
In the short term, if price makes a new low below 1,241.36, then it would be possible that minor wave B is moving lower as another double zigzag.
There is no rule stating a limit for B waves within flat corrections. There is a convention though that B waves within flats are so rarely longer than twice the length of their A waves, that the idea of a flat should be discarded when that price point is reached. Here, minor wave B would be twice the length of minor wave A at 1,223.92. A new low below this point would see the idea of an expanded flat unfolding discarded.
ALTERNATE HOURLY CHART
Click chart to enlarge.
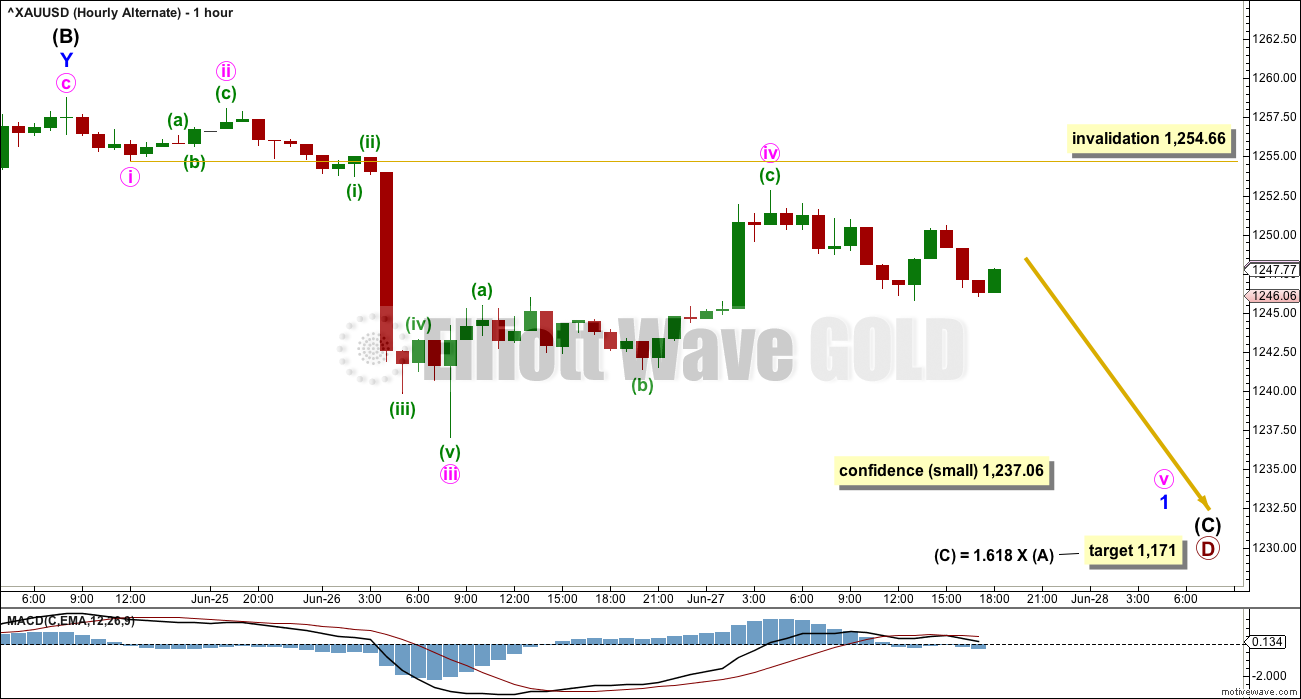
This alternate looks at the very unlikely possibility that intermediate wave (B) was complete in just three days as a shallow double zigzag.
If intermediate wave (B) is complete, then intermediate wave (C) downwards should begin with a five wave structure for minor wave 1. Within minor wave 1, if minute wave iv continues further, it may not move into minute wave i price territory above 1,254.66.
Only a very small confidence may be had in this alternate wave count if price makes a new low below 1,237.06. The main wave count would still be valid and this wave count would remain an alternate.
At this stage, now minute wave iv looks disproportionate to minute wave ii. They are both deep zigzags; there is inadequate alternation. The probability of this alternate is further reduced.
SECOND ALTERNATE HOURLY CHART
Click chart to enlarge.
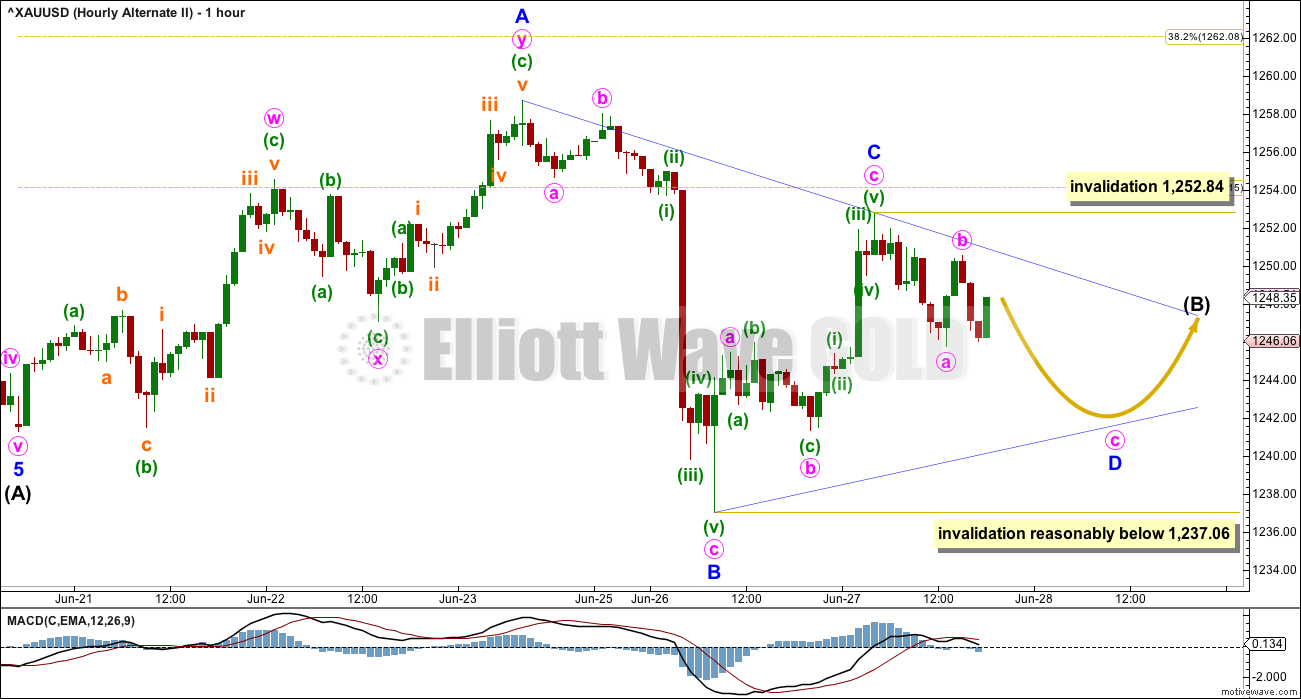
It is also possible at this stage that intermediate wave (B) is unfolding as a running contracting or running barrier triangle.
Minor wave A is a double zigzag within the triangle. This means that all remaining sub-waves must be simple A-B-C corrections, most likely single zigzags. Minor wave C looks like a three wave zigzag and should be complete.
Within minor wave D, minute wave b may not move beyond the start of minute wave a above 1,252.84.
Minor wave D may not move beyond the end of minor wave 1,237.06 for a contracting triangle. For a barrier triangle, minor wave D should end about the same level as minor wave B; as long as the B-D trend line remains essentially flat the triangle will remain valid.
Minor wave E may not move beyond the end of minor wave C above 1,252.84. Minor wave E would most likely fall short of the A-C trend line.
This alternate expects sideways movement in an ever decreasing range for another two to few days.
TECHNICAL ANALYSIS
WEEKLY CHART
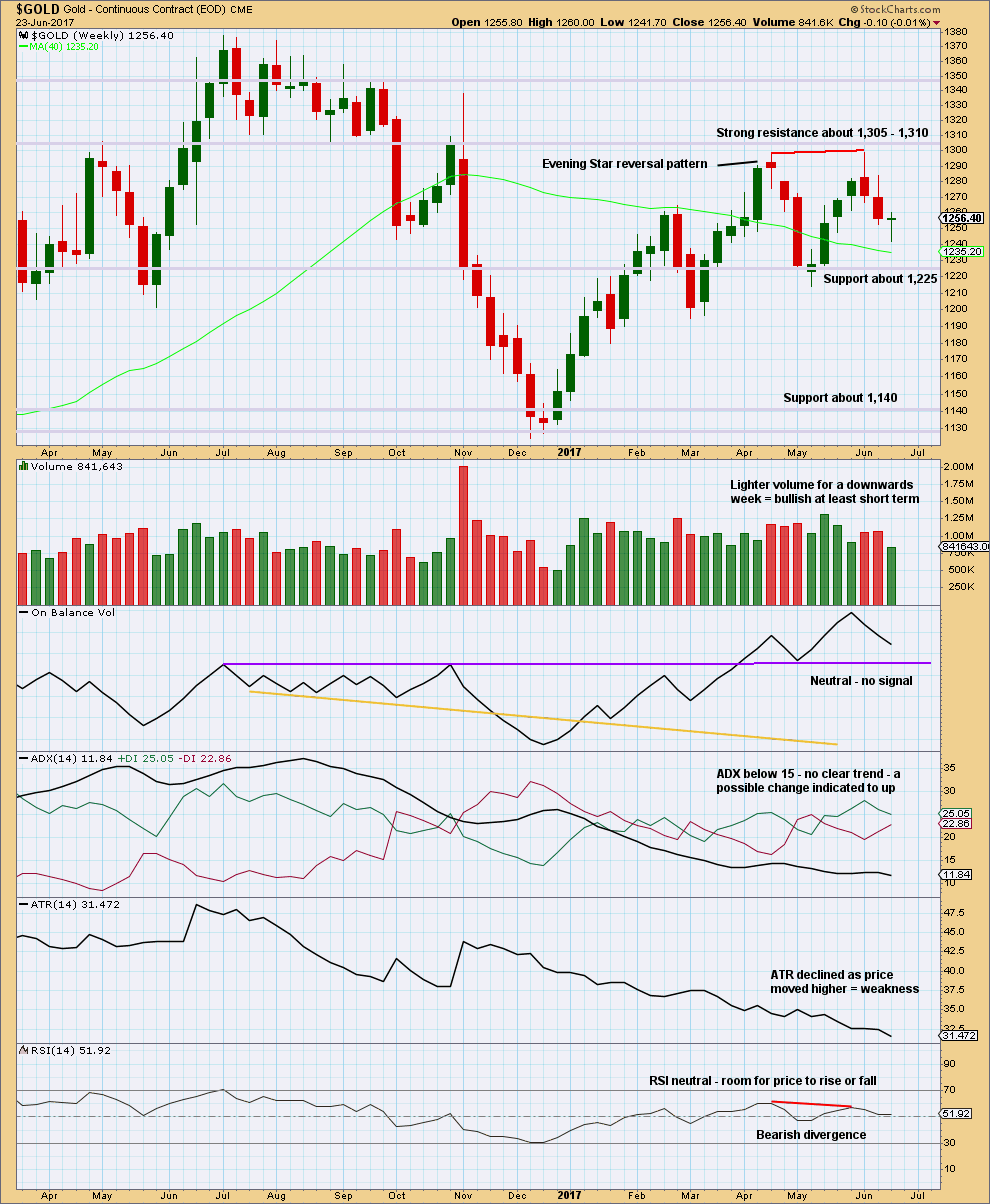
Click chart to enlarge. Chart courtesy of StockCharts.com.
The long lower wick of the last weekly candlestick is bullish. This puts the short term trend from down to neutral.
Lighter volume for the last week does not support the fall in price. In conjunction with the longer lower wick and doji candlestick, a bounce here looks like a very real possibility.
Declining ATR for a long time fits neatly with the expectation of a large triangle unfolding.
DAILY CHART
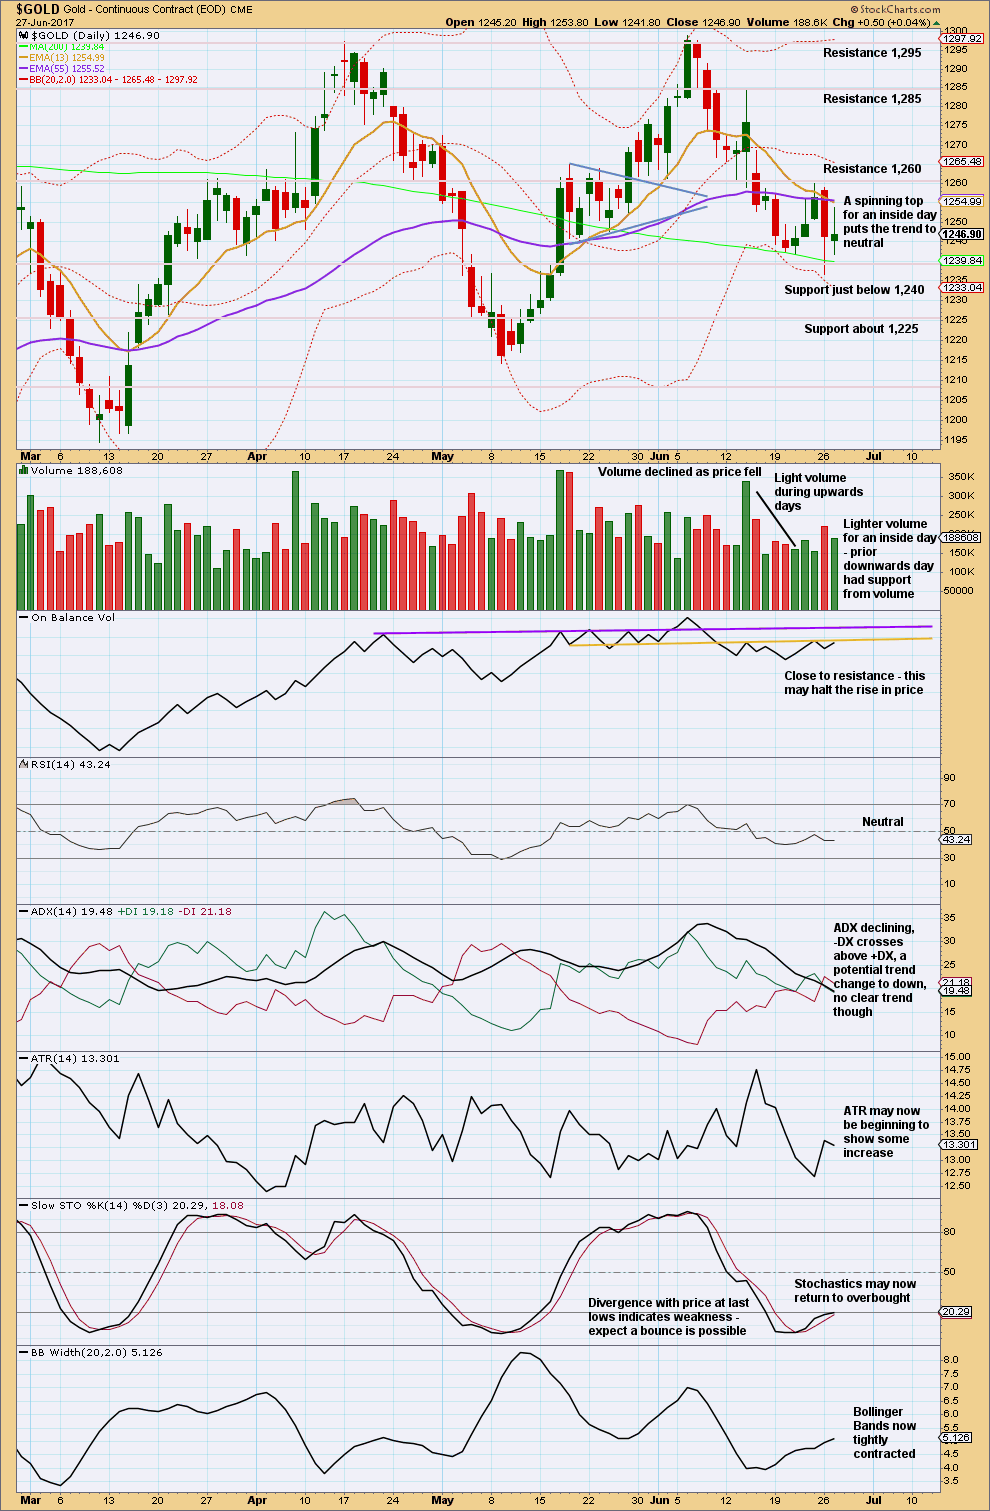
Click chart to enlarge. Chart courtesy of StockCharts.com.
Price is range bound again with resistance about 1,260 and support about 1,240. So far, during this small consolidation, it is a downwards day that has strongest volume suggesting a downwards breakout is more likely than upwards.
Volume and On Balance Volume today suggest a red daily candlestick for the next session looks most likely.
GDX
DAILY CHART
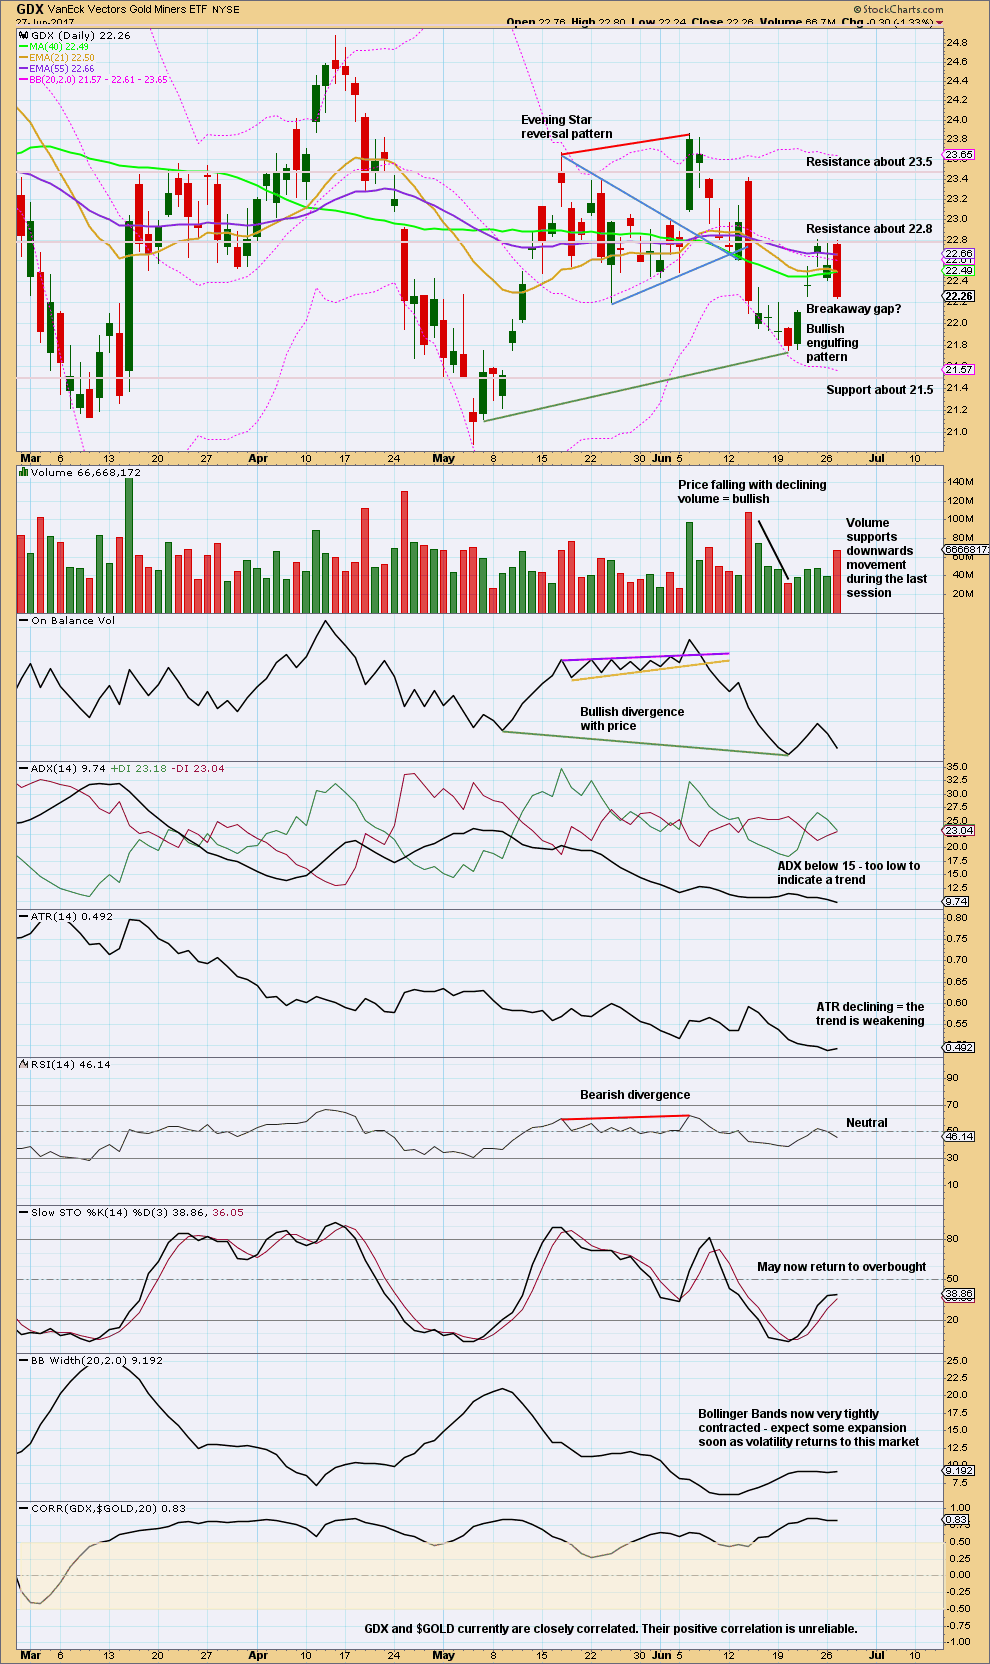
Click chart to enlarge. Chart courtesy of StockCharts.com.
GDX also looks like tomorrow may print a red candlestick.
GDX is range bound with resistance about 22.8 and support about 22.25. So far, during this short period over the last three days, it is a downwards day that has strongest volume suggesting a downwards breakout is more likely.
This analysis is published @ 09:00 p.m. EST.
I think it’s still the triangle. I can’t get the main hourly chart to look right anymore.
and i need to fix that invalidation point. it should be 1,253.82
I am out. Sold my initial GDX position for a modest profit but I don’t like the price action in Gold. I think we are going to see another move down before we get upside momentum. I know that Gold’s third waves can get going slowly at first but the GDX candle today is not very convincing as being the start of a strong move higher. I am waiting for a solid intra-day move above 1250.00 that sticks.
So GDX did move lower today before reversing. That is what usually happens with a bearish engulfing, so the higher probability played out. GDXJ had a stronger up day than GDX which is good. Low volume didn’t support the move up though. Best I can tell, the EW pattern still supports a higher high is coming. That said, gold is dicey, so the correction in GDX may not be over even though it has hit the .618 retracement. Always good to take some profit…
The currencies are the players. My guess is the EW count for Gold, Silver or Oil is freezed by the moves of currencies. This moves are since days very big moves. I am still waiting for the main hourly. Hard to watch this television…
Still looking for a close above 1250 spot price for Gold. That would be a good start for the bullish case. Next it has to survive an almost certain overnight bear raid. I think the battle is going to be fought in the futures market so that’s where my attention will be. So far so good; Silver chugging along.
The assault on 1250 is surprisingly restrained and I am wondering why. I thought a halt there would see a quick spike back down to at least 1240. The indecision won’t last long I don’t think. Either they cover and we head to 1265 in a hurry, or we head down to re-test support. Silver hinting it may be the former…
As suspected, they are furiously attacking the 1250.00 pivot. They are going to be forced to cover a slew of naked short contracts with any move too far above it. We could be headed a bit lower if we don’t take it out today. Rats!
Do we have confidence in the main hourly? I have 1254.88 as recent high.
It’s 1253.82 on BarChart, the one that Lara uses. So, Alternate is not invalidated yet. Nor is Main confirmed. Downright frustrating isn’t it?
Yes it is. Thanks, I had a temporary brain lapse and thought Laras feed was stockcharts.com— and then I couldn’t get the XAU. So I guess frustrating is better than invalidated. 🙂
~1254 range proving to be formidable resistance
Yes. They are desperately trying to sell Gold back under 1250, along with a volatility and Yen smackdown to prop up equities. Should be a pitched battle today lasting all day until the close approaches…
Oil Analysis — short window of opportunity
====================================
For those of us who are keen in exploring other markets, oil price has rebounded off the low at 42.05 a week ago. Currently in the A wave of micro 2, it had risen to a high of 44.44 yesterday. Momentum remains negative but it is decelerating and the MACD histogram prints in the red with a rising trajectory which reflects continuation of price rise. Also, 5-day RSI had broken above the 50 level reflecting positive momentum.
The daily Ichimoku chart shows that oil remains in a bearish trend. Tenkan-sen lies below the kijun-sen, and price has risen just above the tenkan-sen. This rise is a bounce, providing a small window of opportunity. The cloud turns green until July 10. The shallow width means that the price rise is not going to be spectacular. I would reckon that the price rise would need to negotiate kijun-sen resistance at 47.03. If it can break above, then prices would at most reach the bottom cloud boundary just below 49. I would expect prices to be rejected there and another protracted down wave would follow, a wave 3 (micro 3): just look at the red cloud stretching all the way to August.
I would enter long for a quick swing trade off a dip, that is, sub-micro c of this correction. Hope this helps.
Thanks for the update on oil, Alan.
Anytime you feel like updating the wave count for oil, please do so.
Critical junction coming up soon.
I agree Alan, Oil looks likely here to bounce higher.
A warning though about trading it on the way up, it’s a counter trend move. One that may last a couple of weeks, but still it’s against the larger trend.
So my advice for that would be to reduce exposure, limit any long position to only 1-3% of equity. And a stop is essential, it should be just below the low.
GSR update in hour period.
Top HnS in hour period confirmed. GSR moved down and metal prices move higher. GSR coming out of top diamond indicates top is in place and now trend change for nominal price going forward.
GSR is an reliable indicator for PM sector trend. When it moves down nominal prices go down and vice a versa.
That does not seem correct to me. Falling GOLD/SILVER ratio usually implies rising silver prices, which occurs usually during PM impulsive upwards thrusts. Witness the falling ratio in the first half of 2016.
Ichimoku Gold 4-Hourly Analysis
Data as at 4:45 am ET June 28
=========================
Gold prices finished marginally higher in limited trading as investors sat on the sidelines after Monday’s steep sell-off. Mixed news probably led to the low volume and tight range. It was only after the market close that gold price moved up to the 1250s, breaking the stranglehold of the sideways shuffle.
At the 4-hour level, gold price had ventured into the Ichimoku cloud. Tenkan-sen had crossed above the kijun-sen, albeit only very slightly so. Prices are trading above both the tenkan-sen and the kijun-sen, a promising sign. All that remains for putting the bears behind us is a movement above the top cloud boundary at 1260.91, and the cloud turning green. But first, it has to negotiate 1254.66 to instil some confidence.
Gold price might have made an important low before the markets opened this week. To help the bullish cause, prices need to hold above that low. The next sign of strength will be to break above the top cloud boundary at 1260.91, followed by the 1275 massive resistance area. If these can be achieved, the most important resistance for the bulls to break will be the 1300 area of the previous double top.
On the other hand, should another market rout again happen, then the brown support trend line will feature once more. That line had been tested four times and it had held remarkably well. If the bears manage to claw down that support line, it would be a very negative sign. A sell-off of much greater magnitude than the one we saw on Monday will ensue, perhaps looking at 1200 as the next level.
Whether the current rise in prices proves to be the launching pad for a bullish run, or degenerates to become a mere relief rally, remains to be seen. The bulls have their work cut out for them, a herculean effort I must say. The bears merely have to haul prices down below the brown uptrend line. To me, this is not the time to be gung-ho. Scalping nimbly is perhaps the only safe play until the gold trend establishes itself one way or the other.
Gold Technical Analysis
Data as at Market Close, June 27
===========================
Gold markets traded mainly sideways and then shot through the 1250 level. The 1250-1260 region is an area of previous support turned resistance, but if we can continue to go higher, this would be a very bullish sign. Gold may be trying to form a base near the 1240 level, an area that has been supportive in the past. The drop towards the recent low of 1237.06 had respected the brown uptrend line on the longer-term charts. This line should continue to favour the upside for gold longer term. However, the short term is going to be a very choppy market.
From a technical analysis standpoint, the rise in gold prices had been under pressure from the 50 day MA, as well as having sufficient support from the 200 day MA. Trading between the 50 and 200 MA indicates no strong trend; prices are range bound. Momentum remains negative but it is decelerating and the MACD histogram prints in the red with a flat trajectory which reflects consolidation. Also, RSI had fallen back after testing the 50 level reflecting negative momentum.
The near-term price action and possible targets, which of course all of us day traders are most concerned with, unfortunately cannot be gleaned from this technical analysis. It just paints the overall picture. I will have to use Ichimoku to deal with it. However, I’ll have to do so in a separate post as StockCharts had not updated their charts to reflect the position at the close yesterday.
Lara, I posted a question on your June 23rd “On Balance Volume” post that you may have missed. Can you take a look when you have time? Thx
sure, will do
Read your reply. Thank you!
Zoomed in look. Another reason that I think it’s possible the correction is complete is that it is a Flat and not a zigzag. Flat corrections usually don’t correct to the .618 retracement.
The strength of the next leg up will be key for the bull count.
https://www.tradingview.com/x/x7SQaezB/
So as you can see, GDX price is still in the middle of the triangle. A breakout should be coming soon. An upwards breakout as this count shows, goes against Lara’s main gold count, so caution is advised. It is possible that the triangle breaks downward.
I do expect another leg up, even if the bear ultimately prevails. The correction may have ended today.
https://www.tradingview.com/x/JkAzMZ3b/
Hi Lara,
I am not sure if this is my computer or if you have changed your settings at your end.
When I am clicking on your charts they do not get bigger anymore. The landscape once are still readable but the Portrait once are the same size and unfortunately I can not read the important text on it.
Is there any chance to change that back the way it was?
Thanks
Ursula
I’ve noticed that too. I think it’s caused by a wordpress update.
Try enlarging your screen and viewing the chart without clicking on it. Then you can see what you need to see.
I think you have to save the chart as image by right click and then open and enlarge it. to see
I just read Dreamer’s post on earlier thread that GDX can somtimes print an engulfing candle at a bottom. Great to know as Gold hit my target of 1250 and had me wondering!
Now for reclaim of that pesky 50 dsma…
Verne, it is relatively rare, but there are several similar examples and one very similar one that I found in the last year and a half. Tomorrow will be key.
https://www.tradingview.com/x/afLZH1SZ/
Bearish engulfing candle on GDX today is not as pronounced as the one printed on June 14 so any pullback from here should last fewer than the four days then, I would imagine, as well as remain above the 21.75 low. It does appear the 50 day SMA is again proving resistance as it did last time. A strong close above would be a great green light.