
Last analysis pointed out that Gold price is currently consolidating. A choppy day that moved price slightly higher remains within the consolidation zone. This is mostly what was expected.
Summary: Price is consolidating. The Elliott wave count sees intermediate (B) continuing as either a flat or triangle. Consolidations do not present good trading opportunities, but at their end they offer an entry to join the larger trend.
New updates to this analysis are in bold.
Last monthly charts and alternate weekly charts are here, video is here.
Grand SuperCycle analysis is here.
WEEKLY CHART
Click chart to enlarge.
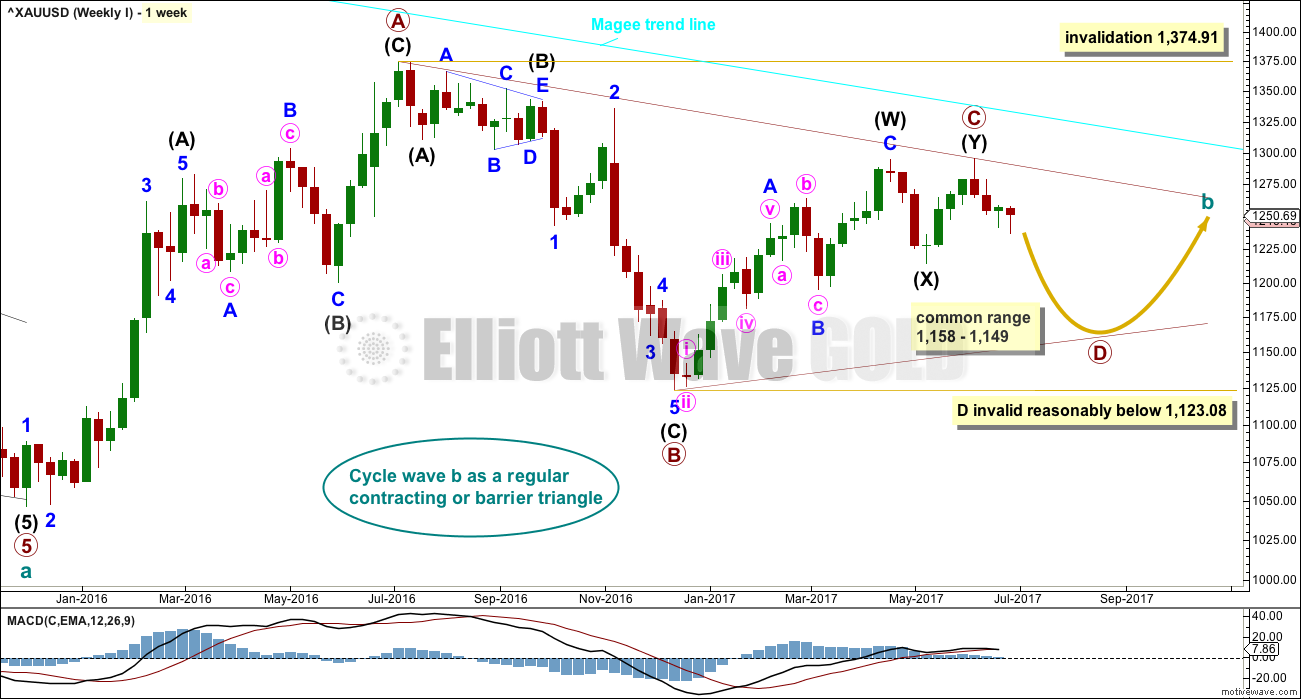
The Magee bear market trend line is added to the weekly charts. This cyan line is drawn from the all time high for Gold on the 6th of September, 2011, to the first major swing high within the following bear market on the 5th of October, 2012. This line should provide strong resistance.
At this stage, a triangle still looks most likely and has the best fit for cycle wave b.
Within a triangle, one sub-wave should be a more complicated multiple, which may be primary wave C. Primary wave C may not move beyond the end of primary wave A above 1,374.91. This invalidation point is black and white.
At this stage, it looks like primary wave C is now complete at the hourly and daily chart level. However, at the weekly chart level, it looks possible it may continue higher. This possibility must be acknowledged while price remains above 1,214.81. Within intermediate wave (Y), minor wave B may not move beyond the start of minor wave A.
Primary wave D of a contracting triangle may not move beyond the end of primary wave B below 1,123.08. Contracting triangles are the most common variety.
Primary wave D of a barrier triangle should end about the same level as primary wave B at 1,123.08, so that the B-D trend line remains essentially flat. This involves some subjectivity; price may move slightly below 1,123.08 and the triangle wave count may remain valid. This is the only Elliott wave rule which is not black and white.
There are three alternate wave counts that have been published in the last historic analysis, which is linked to above. They are all very bullish. Members may like to review them at this stage. They will only be published on a daily basis if price shows them to be true with a new high now above 1,295.65.
DAILY CHART
Click chart to enlarge.
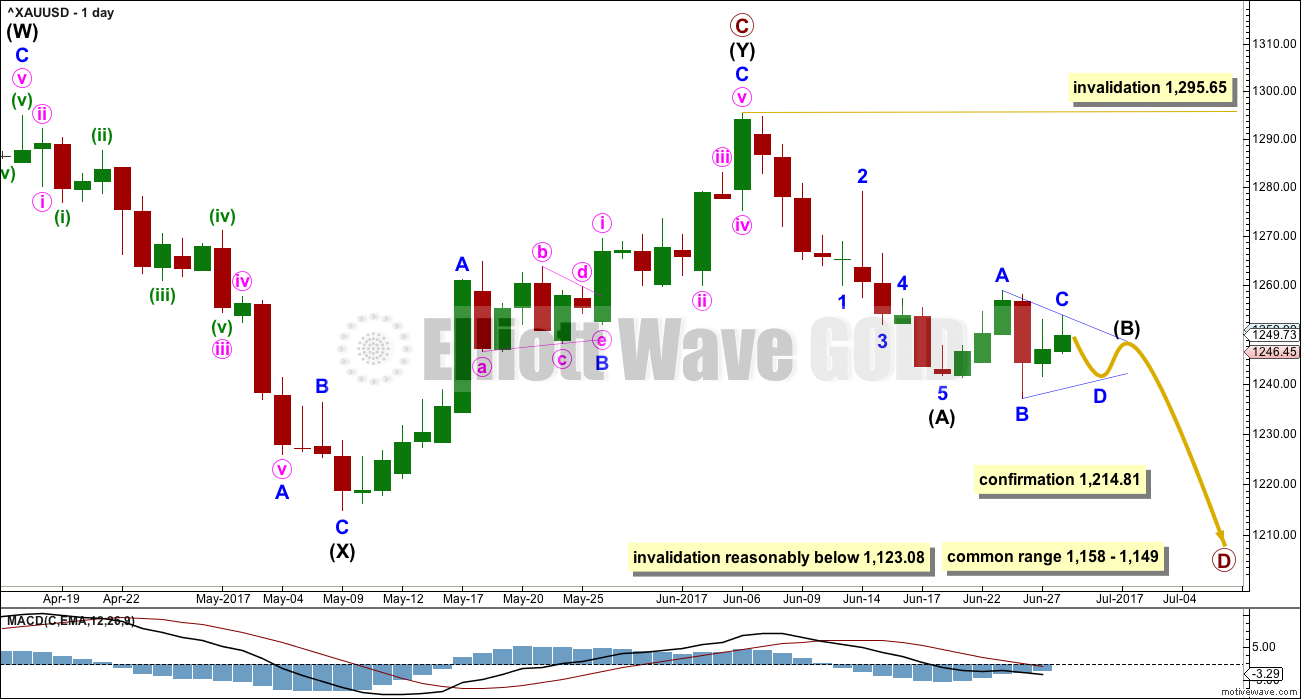
Intermediate wave (Y) may now be a complete zigzag if it is accepted that a triangle completed in the position labelled minor wave B. This has a perfect fit on the hourly chart.
A new low below 1,214.81 could not be minor wave B within intermediate wave (Y) and would provide strong confirmation that intermediate wave (Y) is over.
A common range for triangle sub-waves is from about 0.8 to 0.85 the prior sub-wave, this gives a range for primary wave D from 1,158 to 1,149.
If primary wave C is correctly labelled as a double zigzag, then primary wave D must be a simple A-B-C structure and would most likely be a zigzag. Within primary wave D, intermediate wave (B) may not move beyond the start of intermediate wave (A) above 1,295.64.
Intermediate wave (A) lasted only ten days. So far intermediate wave (B) has lasted six days. If it concludes within two more sessions, it may total a Fibonacci eight days. This would be a reasonable proportion to intermediate wave (A).
So far it looks like intermediate wave (B) may be completing as an expanded flat correction. It is also possible to move the degree of labelling within this expanded flat down one degree; it may only be minor wave A or W of a more time consuming flat or combination for intermediate wave (B).
The main hourly chart below follows on from the labelling here on the daily chart.
The new alternate today would see minor wave A complete in the same position but minor wave B incomplete as a triangle.
Primary wave A lasted 31 weeks, primary wave B lasted 23 weeks, and primary wave C may have been complete in 25 weeks.
Primary wave D should be expected to last at least 8 weeks (but most likely longer). The next Fibonacci ratio in the sequence would be a Fibonacci 13 and then 21.
HOURLY CHART
Click chart to enlarge.
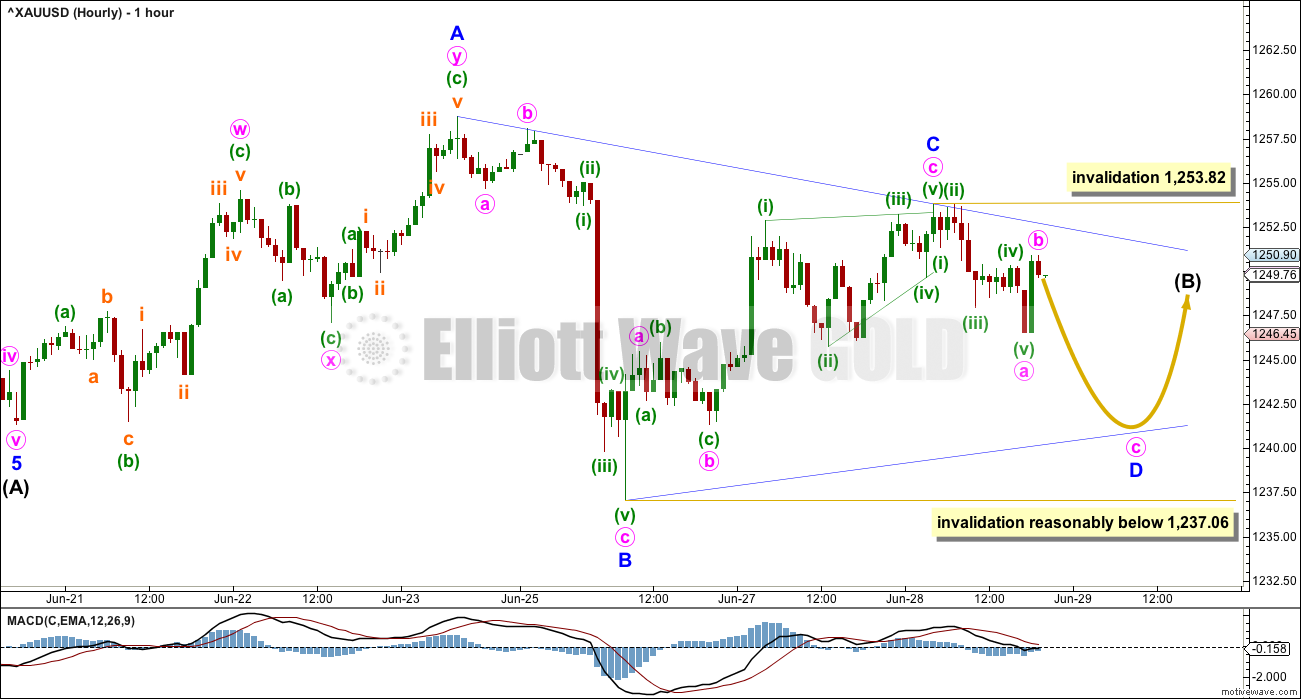
It is looking increasingly likely that intermediate wave (B) is unfolding as a running contracting or running barrier triangle. This will now be the main hourly wave count.
Minor wave A is a double zigzag within the triangle. This means that all remaining sub-waves must be simple A-B-C corrections, most likely single zigzags. Minor wave C looks like a three wave zigzag and should be complete.
Within minor wave D, minute wave b may not move beyond the start of minute wave a above 1,253.82.
Minor wave D may not move beyond the end of minor wave 1,237.06 for a contracting triangle. For a barrier triangle, minor wave D should end about the same level as minor wave B; as long as the B-D trend line remains essentially flat the triangle will remain valid.
Minor wave E may not move beyond the end of minor wave C above 1,253.82. Minor wave E would most likely fall short of the A-C trend line.
This wave count expects sideways movement in an ever decreasing range for another two to few days.
ALTERNATE HOURLY CHART
Click chart to enlarge.
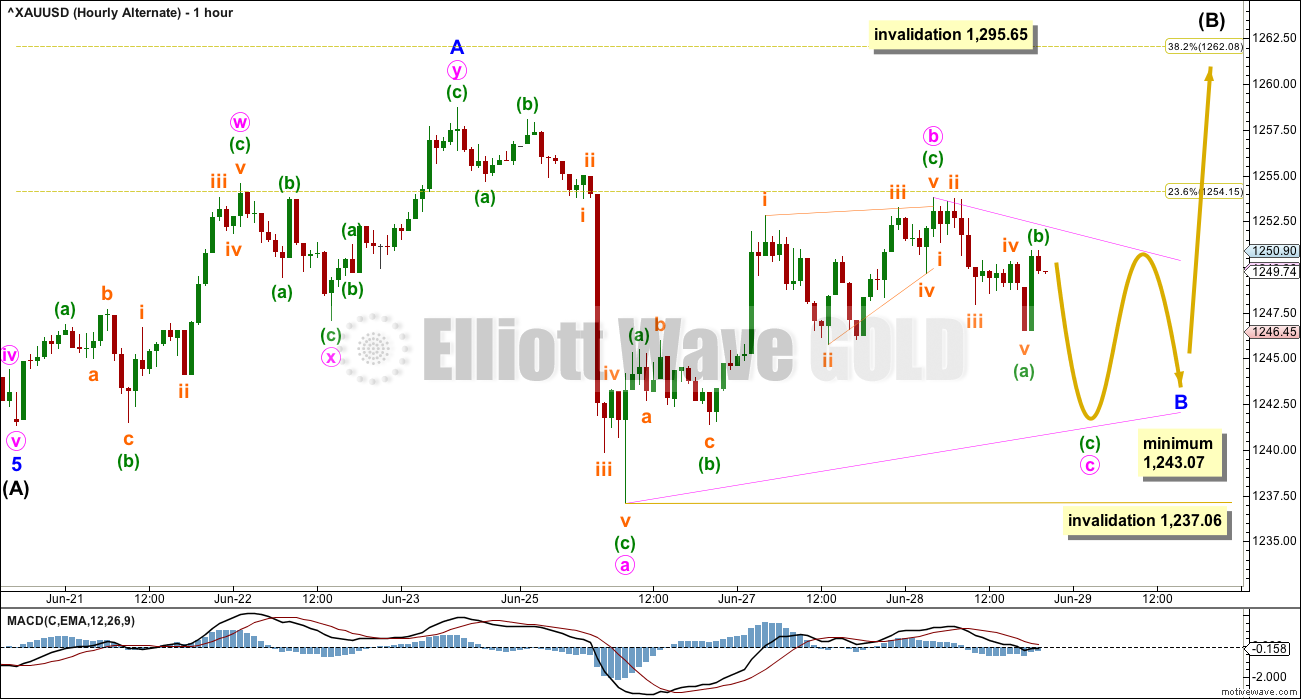
It is very important to always consider alternate ways of labelling a structure that looks like is unfolding as an Elliott wave triangle. Triangles are very tricky structures; it is only clear exactly how they unfolded when they end.
A flat correction may still be unfolding. Within the flat correction, minor wave A is a double zigzag and this is classified as a three; A waves within flats subdivide as threes. Within the flat correction, minor wave B must at its end retrace a minimum 0.9 length of minor wave A, so minor wave B must end at or below 1,243.07.
Within the triangle of minor wave B, minute wave c may not move beyond the end of minute wave a below 1,237.06. This invalidation point is black and white.
This alternate expects sideways movement for another two to few days, followed by a sharp upwards thrust for minor wave C to end about the 0.382 Fibonacci ratio 1,262.08.
TECHNICAL ANALYSIS
WEEKLY CHART
Click chart to enlarge. Chart courtesy of StockCharts.com.
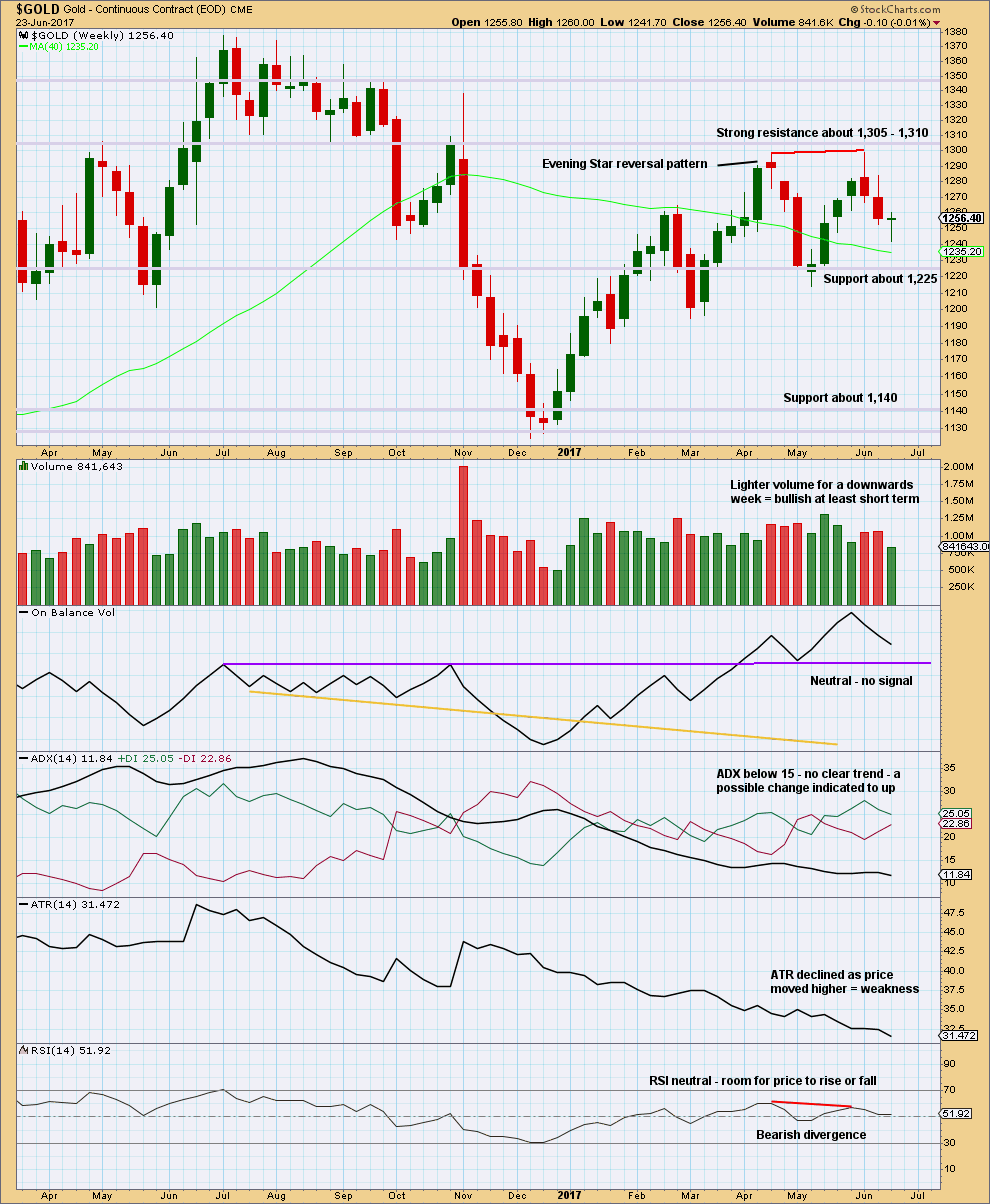
The long lower wick of the last weekly candlestick is bullish. This puts the short term trend from down to neutral.
Lighter volume for the last week does not support the fall in price. In conjunction with the longer lower wick and doji candlestick, a bounce here looks like a very real possibility.
Declining ATR for a long time fits neatly with the expectation of a large triangle unfolding.
DAILY CHART
Click chart to enlarge. Chart courtesy of StockCharts.com.
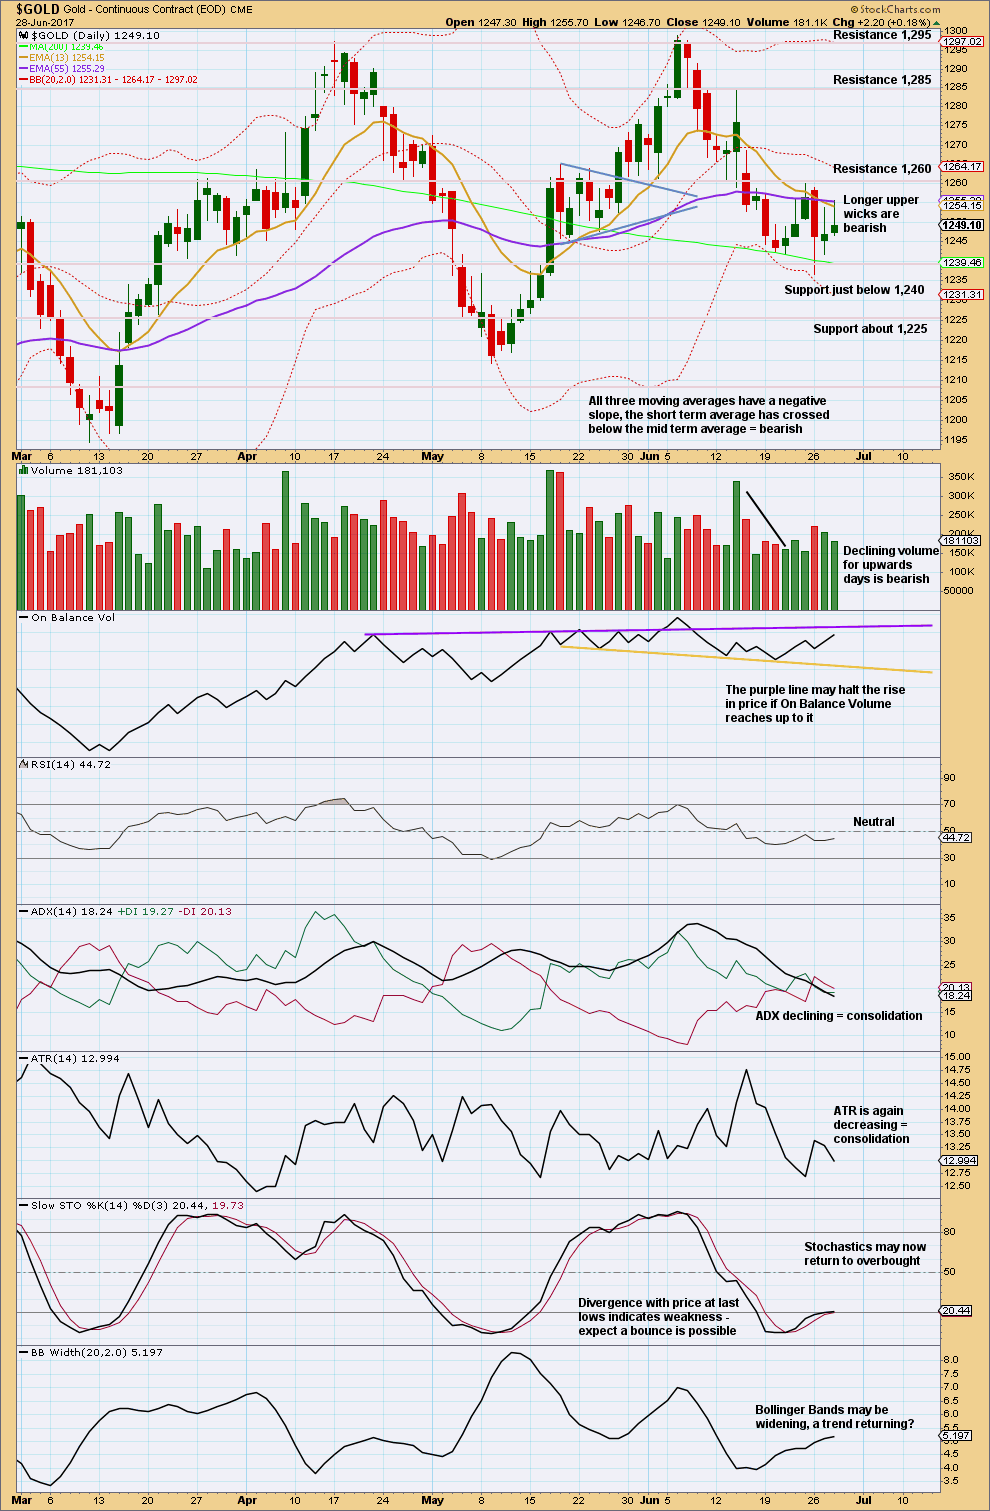
Price is range bound again with resistance about 1,260 and support about 1,240. So far, during this small consolidation, it is a downwards day that has strongest volume suggesting a downwards breakout is more likely than upwards. This supports the main hourly Elliott wave count over the alternate.
The support line for On Balance Volume is redrawn today. There is a little distance to go before On Balance Volume may find resistance.
ATR and ADX agree that price is consolidating.
GDX
DAILY CHART
Click chart to enlarge. Chart courtesy of StockCharts.com.
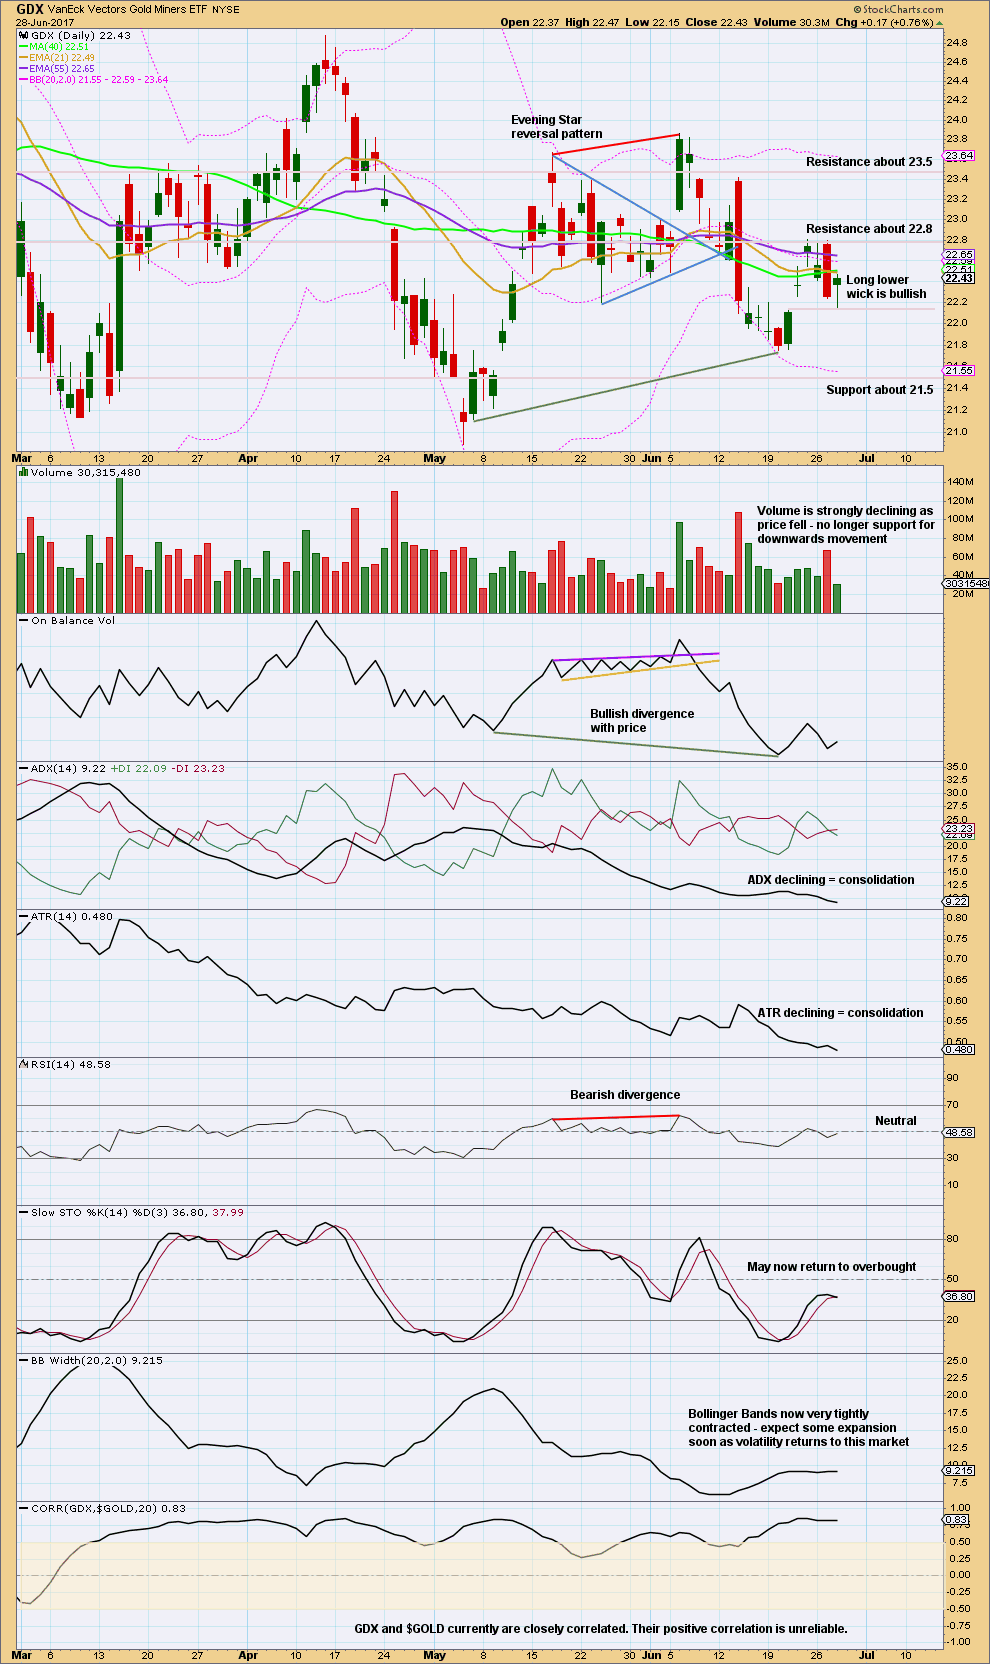
The last gap has its lower limit at 22.13. With today’s low at 22.15, this gap is not properly closed and may be providing support.
GDX is also consolidating. Resistance is about 22.80 and support is at 22.13. During the consolidation, it is a day which had a balance of volume downwards that has strongest volume suggesting a downwards breakout is more likely than upwards.
This analysis is published @ 09:09 p.m. EST.
Lara,
Your last copper analysis in the May 9th trading room has turned out remarkably accurate. Both the July and September futures prices rose above 2.694, with a close above the Bollinger Bands with slow stochastic overbought…
This might be a very good short entry, as it might be very close to end of minor 2 of intermediate (A) down…
I wanted to kindly request an update in the copper analysis when you have time?
Thanks in advance…
Okay.
The main count as presented in the analysis above looks correct at this stage.
If it is, then minor E is now underway, and very close to ending.
Minor E is very likely to fall short of the A-C trend line. I should be over within 24 hours, and maybe quite quickly now.
A subsequent drop to below 1,240.17 would be an indication that the triangle is probably over and intermediate (C) down has then just begun. That may be a good entry for a short position to hold for a couple of weeks or longer.
As always, I could be wrong. Which is why risk management is so important. Always use a stop. Invest only 1-5% of equity on any one trade.
Lara, thanks for this update.
How will we know when intermediate (B) is over? I realize that it’s short of the a-c line, but how much short, if known?
Thanks!
Nice bounce off 200 dsma around 1240 as expected. GDX July 22 strike calls looking attractive with close above this pivot.
It’s pretty ominous that gold cant get anything going with the recent weakness in the USD and the stock market. Could point to a bottoming process in the USD and gold ready to head down hard, but situation is still unclear at best. I still think that daily double top in gold is in play, and trading is treacherous right now. I guess just watch interest rates to gauge gold right now. Gold is bearish until proven otherwise
Ichimoku Gold Daily Analysis
Data as at Market Close, June 28
=========================
Gold prices were largely unchanged, generating a doji day. The 200 day MA at 1239.46 continues to be massively supportive. The 50 day MA coming in at 1257.61 proved to be a formidable barrier to upwards price movement. Negative momentum is decelerating as the MACD prints in the red with a flat trajectory which reflects consolidation. The 5-day RSI shows another attempt to rise to the 5-level. Technical analysis points to a rangebound consolidation.
The daily candles remains above the cloud. This continues to keep the bull’s hopes alive. However, prices will need to start rising soon or we may see a breakdown below the cloud. The trend is fragile as the cloud is thin. So the bulls need to step in now.
On the other hand, the tenkan-sen is way below the kijun-sen, and the gap becomes wider by the day. Gold is mainly trading below the tenkan-sen which adds to the pessimism. So, I believe that a break from the consolidation zone is more likely to be down rather than up.
Apologies. Typo. Correct text:
The 5-day RSI shows another attempt to rise to the 50-level.
The main hourly chart could be relabelled like this.
The upper invalidation point needs to be moved up to 1,258.74. Minor C may not move beyond the end of minor A.
I agree. Good time to SOH. Looking at neutral iron condor on GDX while waiting.
The drop in price below the point labelled Minute B has put this count in jeopardy. The original count reverts.
Not sure I’m following you. Wouldn’t that drop just mean we’re in Minor D? Oh, unless your saying Minor C can’t be labeled as finished.
I like Lara’s hrly alternate because it has better correlation with the minute waves taking days and minors taking weeks vs. seeing minor waves complete in days– refering to wave notation page. Are you prefering the alt. too?
What I meant was that the chart in the report was correct, not the one posted in the comments section.
I have no preference for any of the three counts Lara posted in the main section of the report. All point in the same direction in the short-term. But, if I am forced to choose, even against the grain of the price action, I would wish for the bullish case, that is, not any of the triangle counts.
You are right. Minor D of the Main Count ended at 1240.17. Currently we are in Minor E in the Main Count, Minute 4 of Minor B in the Alternate Hourly Count, and Minute 2 of Minor C in the Alternate Count.
Trading opportunities for GDX are not real clear at the moment with Gold apparently consolidating as a triangle of sorts. May be best to sit on the sidelines for a bit.
With the above caution in mind, for the short term at least, it still appears to me that GDX should rise above 22.81 at minimum with higher targets likely. If you are long, I would put stops below 22.16. Let’s see how this plays out.
https://www.tradingview.com/x/jiTSbe9V/