
Upwards movement has invalidated the first weekly chart. With some adjustment, the triangle idea remains valid.
Summary: In the short term, expect more upwards movement to a new target at 1,326. Stops may be now at 1,281.94 or just below the green channel on the hourly chart.
Always use a stop. Do not invest more than 1-5% of equity on any one trade.
New updates to this analysis are in bold.
Last historic analysis with monthly charts is here, video is here.
Grand SuperCycle analysis is here.
WEEKLY CHART I
Click chart to enlarge.
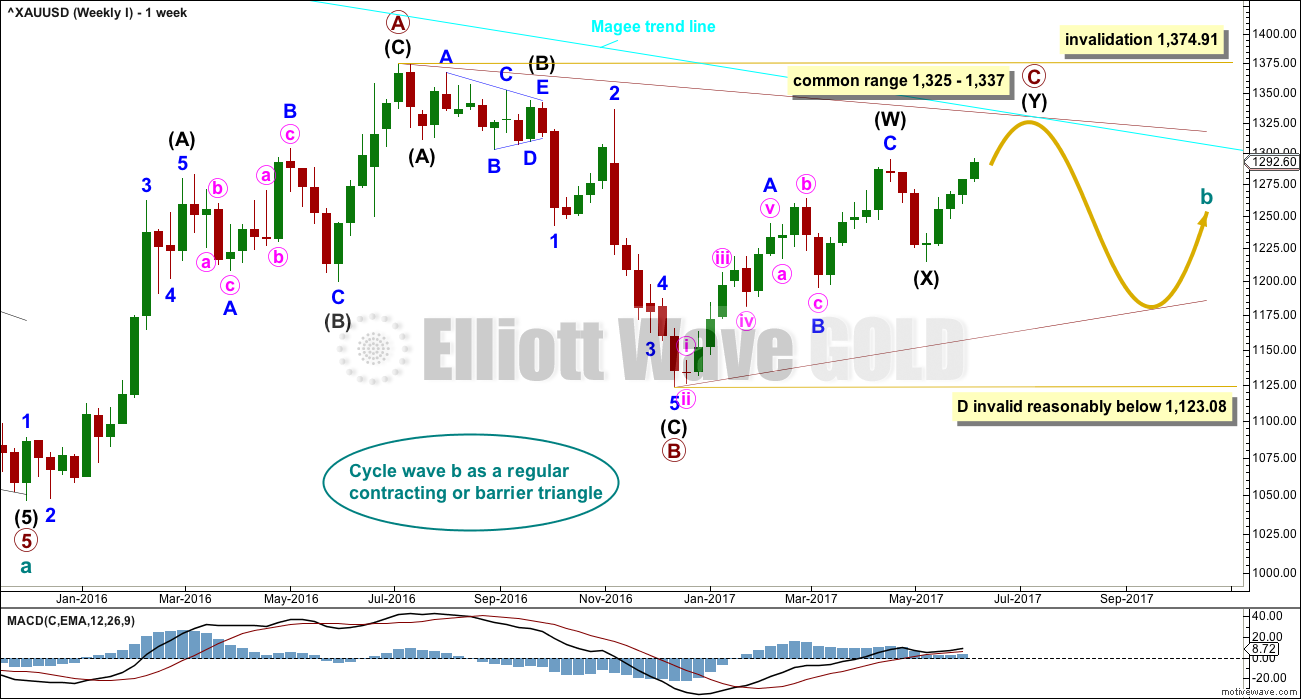
The Magee bear market trend line is added to the weekly charts. This cyan line is drawn from the all time high for Gold on the 6th of September, 2011, to the first major swing high within the following bear market on the 5th of October, 2012. This line should provide strong resistance.
At this stage, a triangle still looks most likely and has the best fit for cycle wave b.
Within a triangle, one sub-wave should be a more complicated multiple, which may be primary wave C. Primary wave C may not move beyond the end of primary wave A above 1,374.91. This invalidation point is black and white.
A common range for the length of triangle sub-waves is from 0.8 to 0.85 the length of the prior wave in the opposite direction. This gives a range of 1,325 to 1,337 for primary wave C.
When primary wave C is complete, then for a contracting triangle primary wave D may not move beyond the end of primary wave B below 1,123.08, or for a barrier triangle primary wave D may end about the same level as 1,123.08 (so that the B-D trend line is essentially flat; this invalidation point is not black and white).
Primary wave C may end when price comes up to touch the Magee trend line.
DAILY CHART
Click chart to enlarge.
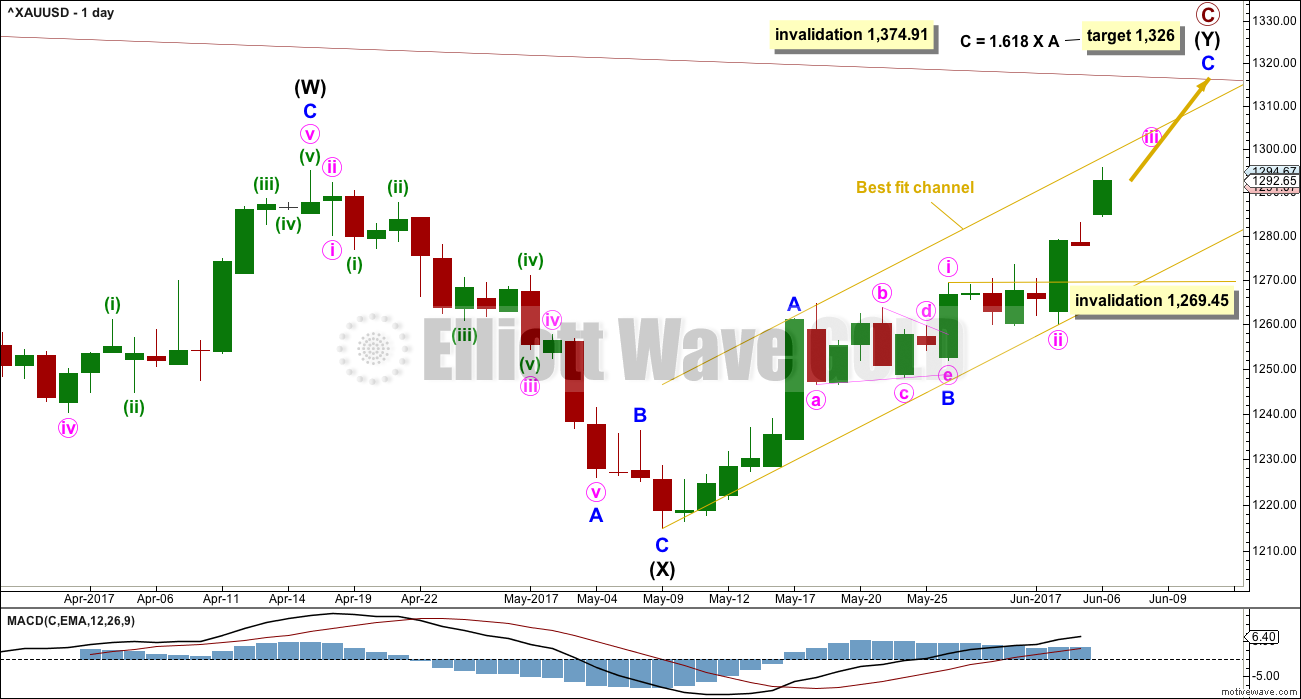
The target would see primary wave C end just within the common range of 1,325 to 1,337.
Intermediate wave (Y) is subdividing as a zigzag. So far minor waves A and B look complete and minor wave C looks incomplete. Within minor wave C, the upcoming correction for minute wave iv may not move back into minute wave i price territory below 1,269.45.
Minute wave iii looks like it is extending.
HOURLY CHART
Click chart to enlarge.
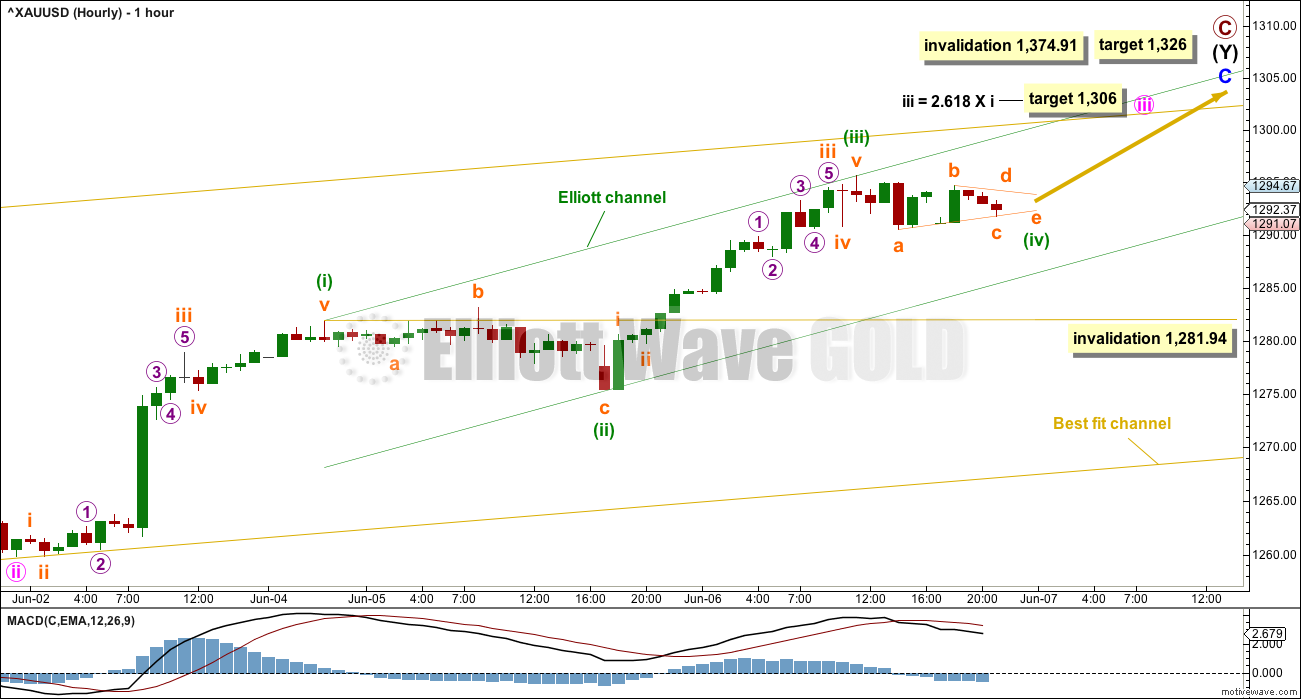
The hourly chart shows the extension of minute wave iii so far.
Within minute wave iii, so far there is a Fibonacci ratio of equality between minuette waves (i) and (iii), with minuette wave (iii) slightly shorter than minuette wave (i). This limits minuette wave (v) to no longer than equality in length with minuette wave (iii) at 20.35, so that minuette wave (iii) is not the shortest actionary wave and the core Elliott wave rule is met. The target for minute wave iii at 1,306 would see minuette wave (v) slightly shorter than minuette wave (iii), if it began at the last low.
There is strong resistance about 1,305 to 1,310. The target for minute wave iii would see price pause for a consolidation at this resistance zone. This would also see the measured rule target given in the classic analysis section below reached.
Minuette wave (ii) was an expanded flat correction. Minuette wave (iv) may be unfolding as a triangle, which would exhibit alternation.
Minute wave ii lasted a few days. Minute wave iv may last at least two days, or may last up to about five, for the wave count to have the right look at the daily chart level.
WEEKLY CHART II
Click chart to enlarge.
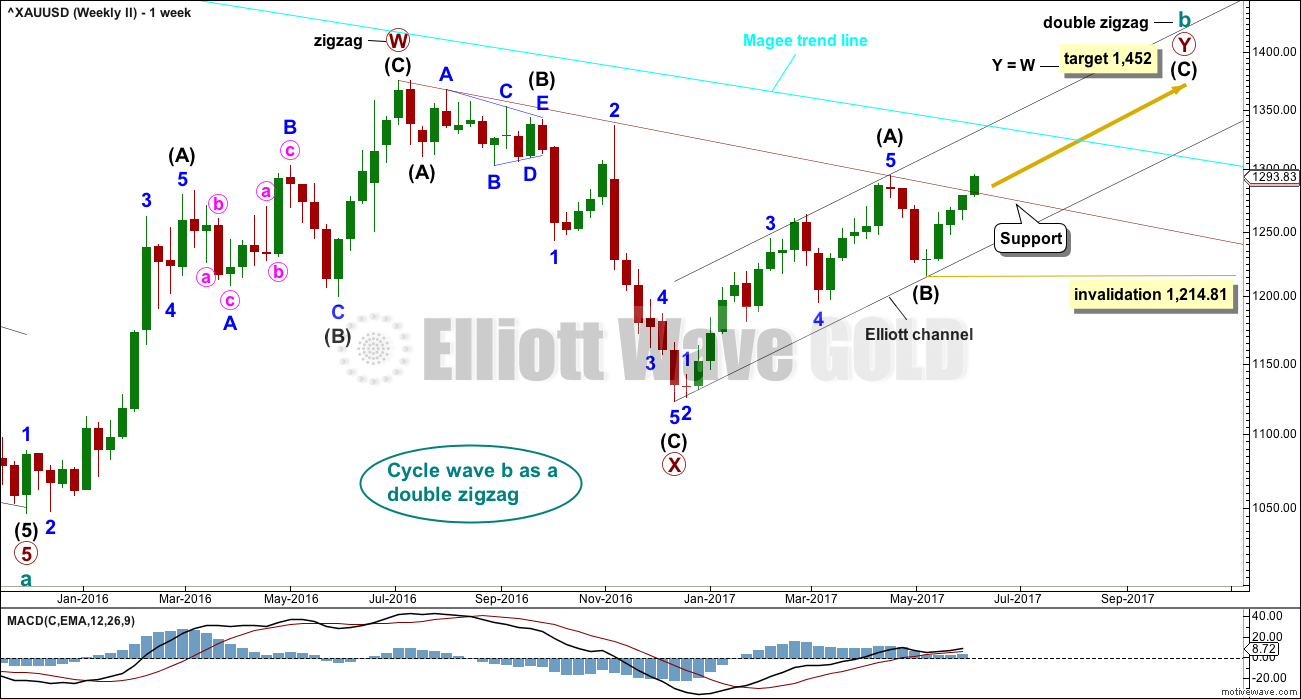
It is also possible that cycle wave b is a double zigzag, but this does not have as good a look nor as good a fit as the triangle idea, so it is less likely.
The purpose of double zigzags is for the second zigzag to deepen the correction when the first does not move price deep enough. Double zigzags normally have a strong slope against the prior trend. To achieve this purpose and to have a strong slope their X waves are normally shallow and also very often brief. Here, primary wave X is neither shallow nor brief. This does not have the right look.
Within primary wave Y, the structure of intermediate wave (A) looks like a three and not a five.
To see intermediate wave (A) over sooner, at the high labelled minor wave 3, would see the low of intermediate wave (B) breach the lower edge of an Elliott channel. And so this would resolve the problem of intermediate wave (A) not looking like a five, but would introduce a new problem of price not fitting correctly within a channel.
The target remains at 1,452.
Within intermediate wave (C), no second wave correction may move beyond the start of its first wave below 1,214.81.
TECHNICAL ANALYSIS
WEEKLY CHART
Click chart to enlarge. Chart courtesy of StockCharts.com.
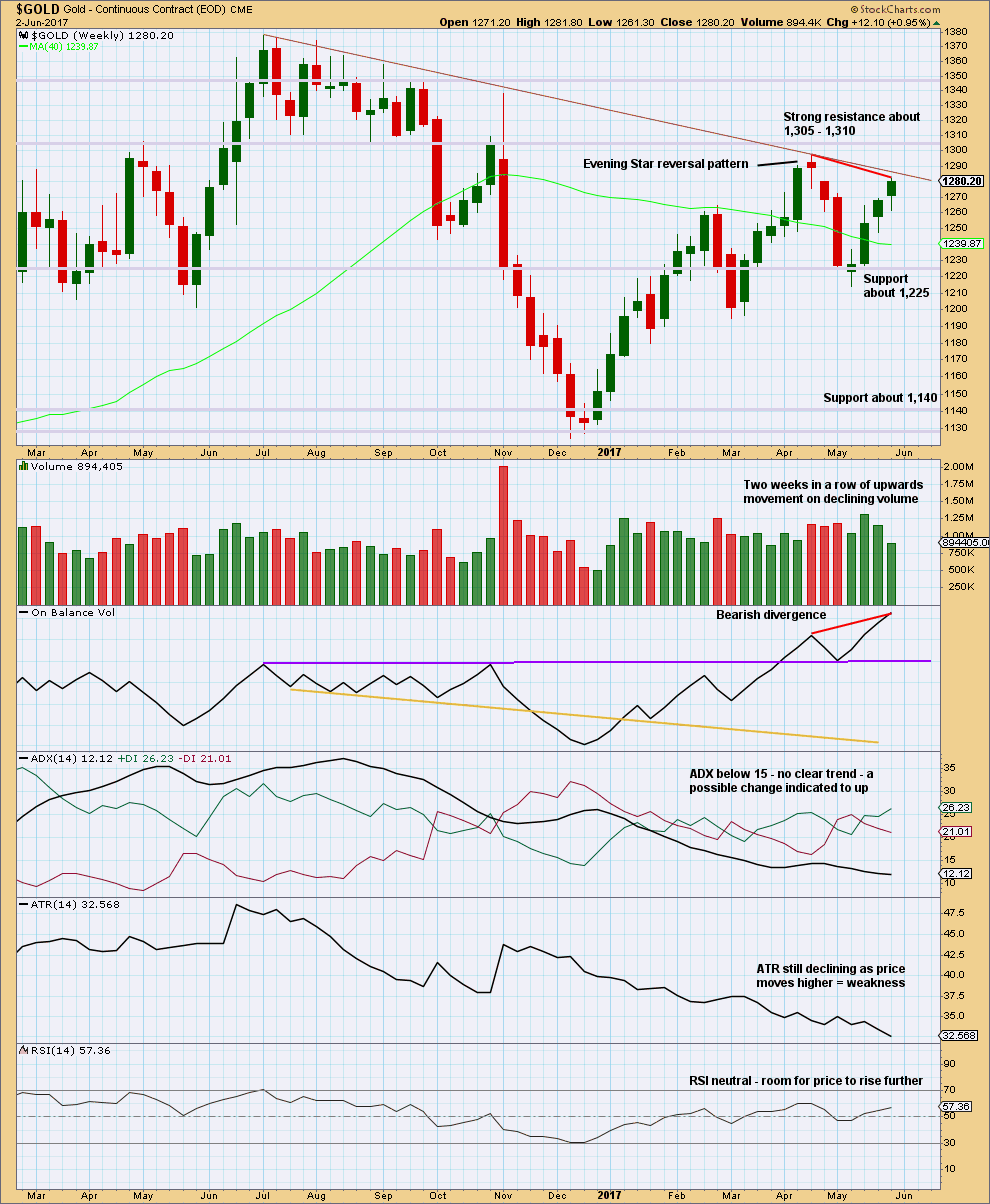
Last week completes an Advance Block candlestick pattern. This is a three candlestick pattern; three green candlesticks with the second and third candlesticks showing signs of weakening. However, this pattern does not come within a mature upwards trend, so the warning is weak and further weakened by the longer lower wicks on the last two candlesticks, which are bullish.
Declining volume along with declining range is bearish.
Strong divergence between price and On Balance Volume is bearish.
There is still room for price to rise further, but the short lived upwards trend at this time looks weak.
The maroon trend line is added to this weekly chart, using the same anchor points as the Elliott wave charts.
DAILY CHART
Click chart to enlarge. Chart courtesy of StockCharts.com.
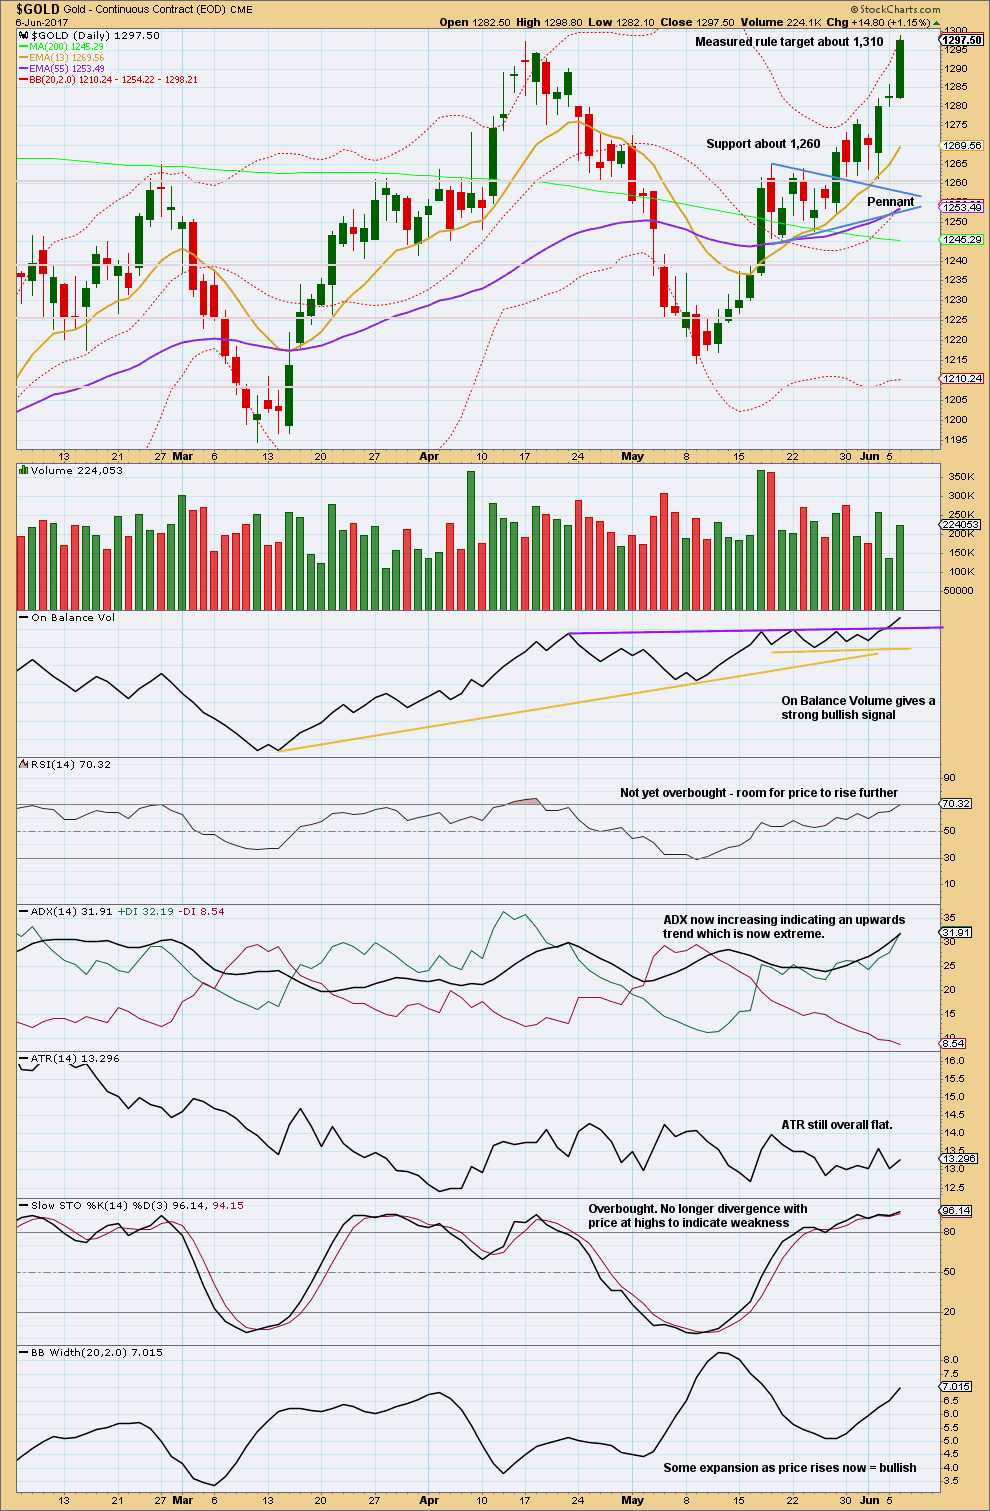
The pennant pattern suggests an upwards breakout (which happened) to be followed by more upwards movement to the target at 1,310. So far it looks like this target may be met now.
A strong bullish signal is given today from On Balance Volume. There was some support today for upwards movement from volume, but overall volume is still declining slightly as price moves higher.
There is room for price to continue higher; RSI is not yet overbought and there is no divergence between price and Stochastics.
Flat ATR supports the first weekly chart; there is some weakness in this trend.
GDX
DAILY CHART
Click chart to enlarge. Chart courtesy of StockCharts.com.
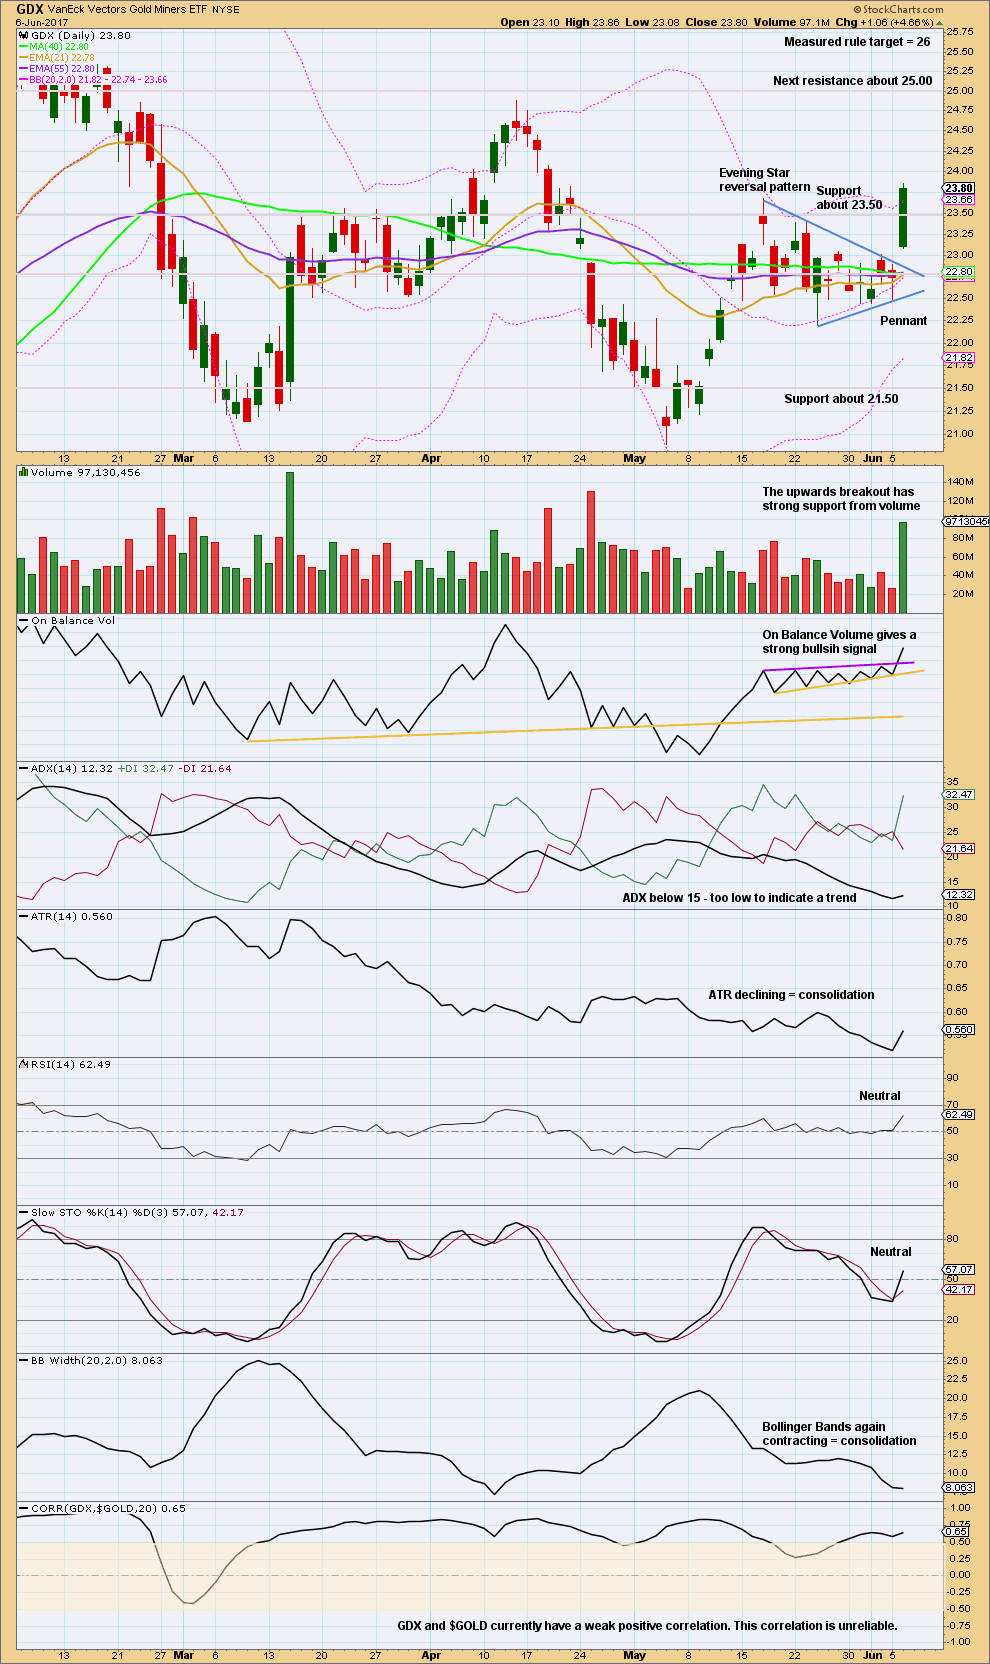
This time Gold has led GDX. The correlation between these two markets is unreliable. This switch in which one leads and which one follows nicely illustrates why analysis of one should not be used to guide analysis of the other.
The pattern looks like a completed pennant. The measured rule target remains the same.
This analysis is published @ 10:33 p.m. EST.
While price remains above 1,281.94 the wave count will assume that this downwards movement is minuette (iv). If price makes a new low below 1,281.94 by any amount at any time frame then the count will see minute iii complete and the downwards movement minute iv.
Minor C still needs to complete as a five wave structure. It still looks incomplete. It’s not holding to trend channels very well, it keeps breaking the lower edge. That looks like weakness.
Now, less than 19 hours until former FBI Director James Comey says nothing. ECB rate decision and the UK elections tomorrow, are likely to be non-events as well. Gold is going lower.
Hi John. You may be right. Gold price has stalled and still needs to show us a break below 1282. Imo Gold price remains a Buy the dips and it would take a break below 1278-74-72 for Gold price to go deeper; I wouldn’t bank on that happening though; only time will tell…. GL!
Yeh, thanks Verne, just jumped on the short board. Here’s hoping that something keeps moving in a constant direction!!
Hope members taking advantage of Lara’s oil count. Looks like third down at multiple degrees underway with mindless bots attempting to buy the dip. We have a ways to go… 🙂
Alan : Gold Cloud chart for you. Waiting for your analysis.
A powerful bullish candlestik chart pattern out of the cloud. Expect one day Harami (inside day) candle if it happens.
Papudi. Our posts were out roughly the same time. I do agree that yesterday had been very bullish, and hence the euphoria among members. I expect today to be sluggish, a harami like you predicted. Investors are waiting for Thursday’s events to rock the markets one way or the other.
Ichimoku Gold Daily Analysis
Data as at 6:45 am ET June 7
========================
Gold prices progressed higher in a steady manner towards 1294.96 and with this target achieved, we saw some selling begin to creep into the gold market and this has helped to push back prices towards the 1290-1292 region where we are now entrenched.
On the daily chart, gold remains in a bullish trend; there is still no sign of a reversal. The tenkan-sen is comfortably camped above the kijun-sen, and gold trades above these two lines. The cloud remains green. This is the textbook strong bullish trend according to Ichimoku analysis.
I would expect prices to be choppy in the next few days as the 1294.96 target has been reached. Moreover, Thursday sees a confluence of high profile news. On that day, we have the UK polls, the Comey testimony and also the ECB rate decision, and each of these is likely to bring in a lot of volatility on its own. It remains to be seen what kind of majority May is able to get, whether Comey will blame Trump for interfering in any investigation and whether the ECB will continue to be hawkish about the economy, and all of these are likely to pull the short-term price of gold in different directions.
If prices do continue to rise, and convincingly move past the 1294.96 region, then it will will confirm that the long term uptrend from the December 2016 low of 1123.08 has resumed. This could trigger another rise to the next resistance level at the November 2016 high of 1336.14. If this level gives way, gold will find resistance at the July 2016 high of 1374.91.
On the downside, the current tenkan-sen support is at 1274.68, followed by the upper cloud boundary support, which is dropping, and then the current kijun-sen support at 1255.23. We can safely say that prices would not pullback lower than the lower cloud boundary at 1245.30 because the bear would suddenly find itself thrown into the limelight again. The Weekly I scenario is invalidated at the Hourly level below 1281.94, and below 1269.45 at the Daily level. With investor sentiment somewhat uncertain due to super-Thursday and the possibility of the US dollar moving back to its high perch, it remains to be seen whether 1281.94, followed by 1269.45, can hold out.
The triangle scenario that I have for GDX is still intact, although I did raise the price target for this leg up. Looking for the upper 24 range to be hit likely within 2-4 days.
https://www.tradingview.com/x/2oXuhg2P/
With the strength in Gold today, I reworked my version of a triangle count for Gold. It has about the same target for this leg up. If this is correct, it won’t go as low as Lara’s main triangle count on the next leg down and ultimately has more bullish upside.
https://www.tradingview.com/x/054YYU20/
Yes, another valid possibility.
Goodness. There really are so many alternate ideas currently valid. That is typical actually for the middle of a B wave.