
Last week the main wave count expected a continuation of downwards movement, which is what has happened. This week members are offered advice on how to manage short positions, which were opened after a channel was breached on the 25th and 26th of May.
Summary: Pull stops down using the best fit channel on the main daily chart, which today is about 45.14. If the channel is breached, exit short positions. More risk tolerant members may then consider a short term long position.
If price remains within the channel, hold onto short positions for a target at 35.82 in the first instance.
New updates to this analysis are in bold.
MONTHLY ELLIOTT WAVE COUNT
Click chart to enlarge.
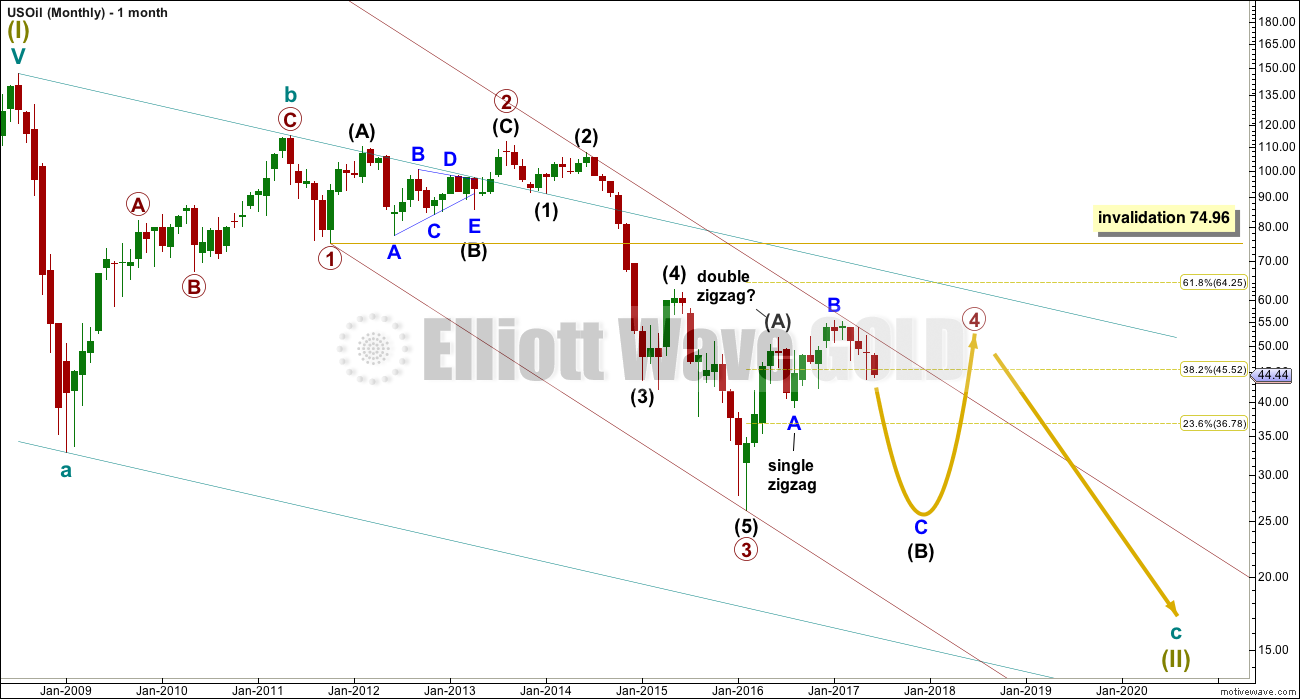
Within the bear market, cycle wave b is seen as ending in May 2011. Thereafter, a five wave structure downwards for cycle wave c begins.
Within cycle wave c, at this stage it does not look like primary wave 5 could be complete. That would only be possible if primary wave 4 was over too quickly.
Primary wave 1 is a short impulse lasting five months. Primary wave 2 is a very deep 0.94 zigzag lasting 22 months. Primary wave 3 is a complete impulse with no Fibonacci ratio to primary wave 1. It lasted 30 months.
Primary wave 4 is likely to exhibit alternation with primary wave 2. Primary wave 4 is most likely to be a flat, combination or triangle. Within all of these types of structures, the first movement subdivides as a three. The least likely structure for primary wave 4 is a zigzag.
Primary wave 4 is likely to end within the price territory of the fourth wave of one lesser degree; intermediate wave (4) has its range from 42.03 to 62.58.
If primary wave 4 is incomplete, then it looks like it may not remain contained within the channel. Sometimes fourth waves overshoot channels and this is why Elliott developed a second technique to redraw the channel when it does not contain a fourth wave.
Primary wave 4 is most likely to be shallow to exhibit alternation in depth with primary wave 2. So far it has passed the 0.382 Fibonacci ratio at 45.52. It may now continue to move mostly sideways in a large range. The alternate wave count below looks at the possibility that it may be very close to completion.
Primary wave 4 may not move into primary wave 1 price territory above 74.96.
At this stage, primary wave 4 has completed intermediate wave (A) only. Intermediate wave (B) is incomplete.
WEEKLY ELLIOTT WAVE COUNT
Click chart to enlarge.
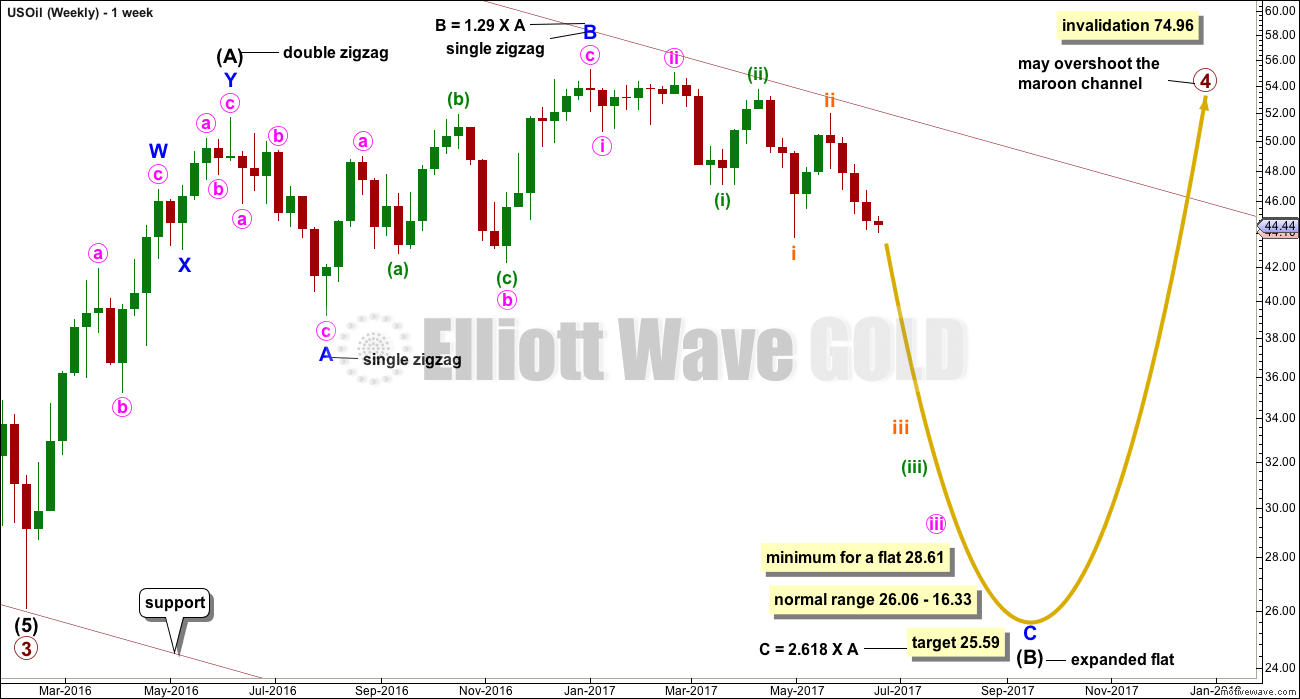
The whole structure of primary wave 4 is seen here in more detail.
The first wave labelled intermediate wave (A) is seen as a double zigzag, which is classified as a three.
Intermediate wave (B) is also a three. This means primary wave 4 is most likely unfolding as a flat correction if my analysis of intermediate wave (A) is correct. Flats are very common structures.
Intermediate wave (B) began with a zigzag downwards. This indicates it too is unfolding most likely as a flat correction.
Within intermediate wave (B), the zigzag upwards for minor wave B is a 1.29 correction of minor wave A. This indicates intermediate wave (B) may be unfolding as an expanded flat, the most common type.
The normal range for intermediate wave (B) within a flat correction for primary wave 4 is from 1 to 1.38 the length of intermediate wave (A) giving a range from 26.06 to 16.33.
Primary wave 4 may not move into primary wave 1 price territory above 74.96.
Within the larger expanded flat correction of primary wave 4, intermediate wave (B) must retrace a minimum 0.9 length of intermediate wave (A) at 28.61 or below.
DAILY ELLIOTT WAVE COUNT
Click chart to enlarge.
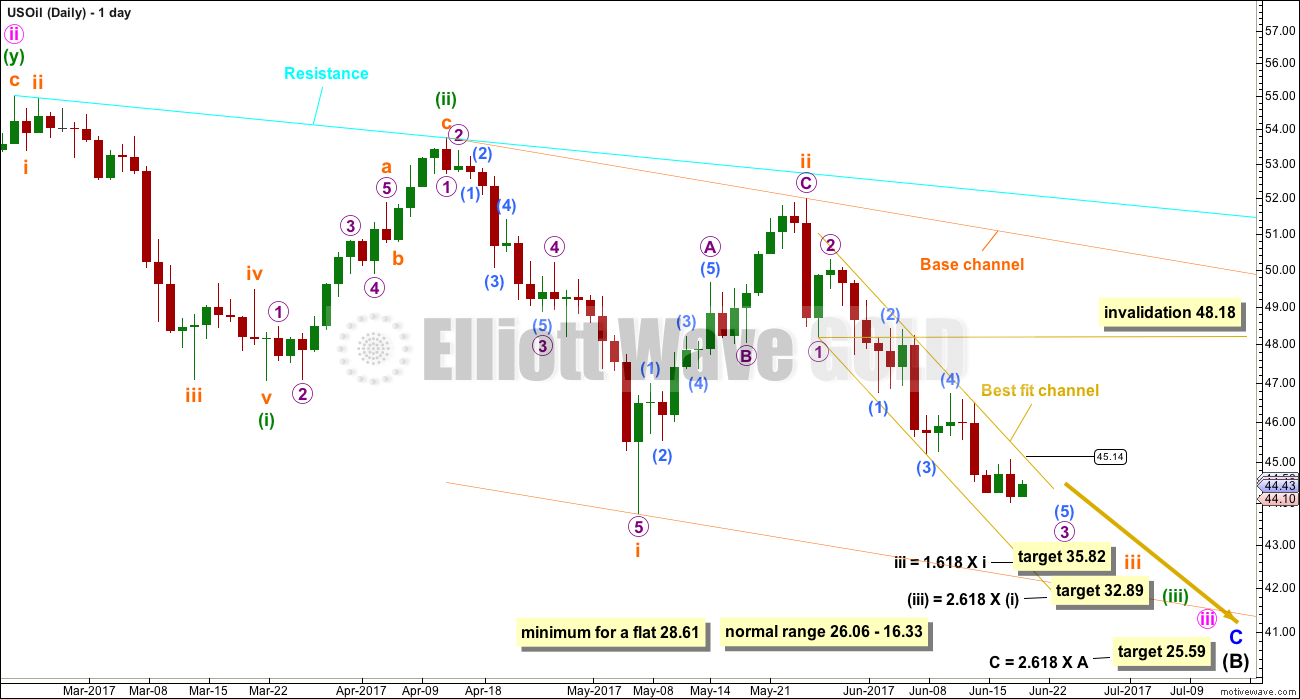
Minor wave C downwards must subdivide as a five wave structure.
So far now there would be four overlapping first and second waves within this wave count. This indicates a possible strong increase in downwards momentum to come as the middle of a third wave passes.
When third waves extend, as this one is, they necessarily begin with a series of overlapping first and second waves. Third wave extensions are extended in both price and time, and they show lower degree corrections within them on higher time frames. This one so far looks like a normal start to a third wave.
Within micro wave 3, it is still possible that the middle may have passed. The degree of labelling for sub-micro waves (3) and (4) may also be moved down one, because the middle of the third wave may still be ahead.
Micro wave 4, when it arrives, may not move back up into micro wave 1 price territory above 48.18.
A narrow best fit channel is drawn about micro wave 3. If this channel is breached by upwards movement before the first target at 35.82 is met, then the probability of this main wave count would reduce in favour of the alternate below.
One or more of micro wave 5, subminuette wave v, minuette wave (v), and minute wave v should be expected to be a strong extension. This is typical of commodities.
The target for minuette wave (iii) remains the same.
ALTERNATE WEEKLY ELLIOTT WAVE COUNT
Click chart to enlarge.
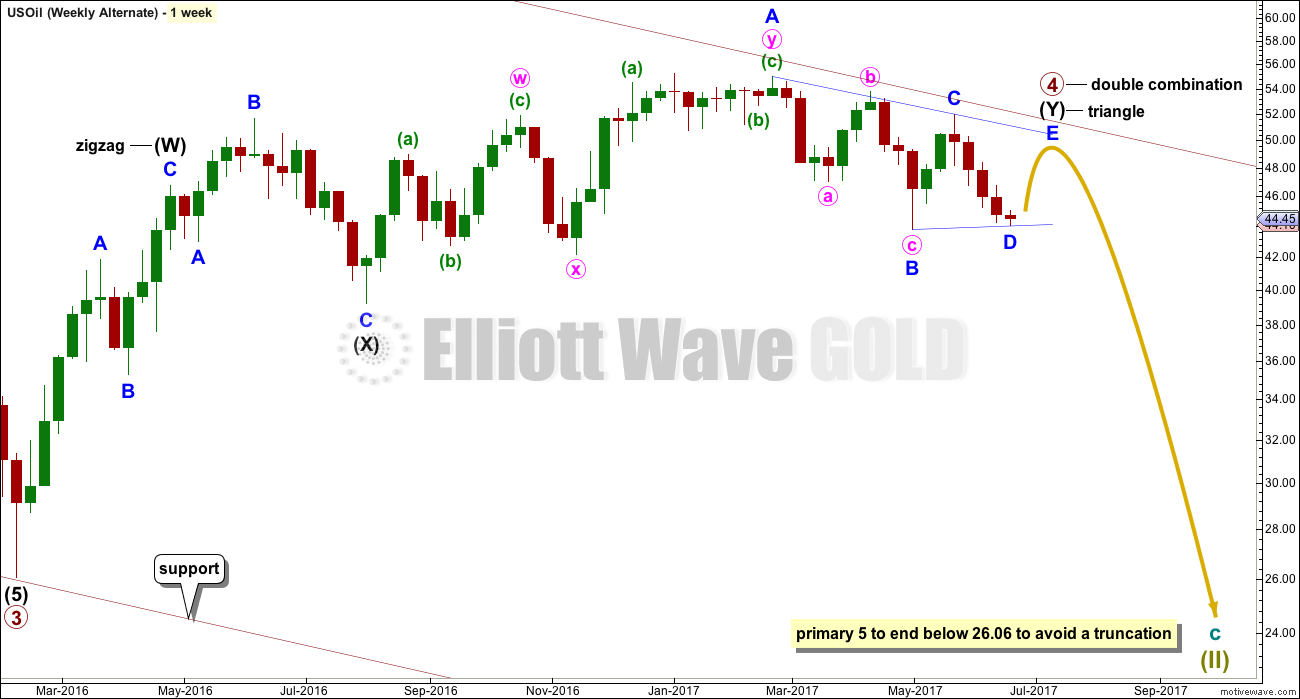
What if primary wave 4 is closer to an end and remains within the maroon channel copied over from the monthly chart? What structure could it be?
Primary wave 4 will fit as an almost complete double combination: zigzag – X – triangle. This would see price remain within the maroon channel.
A combination would exhibit good alternation with the zigzag of primary wave 2. Primary wave 2 lasted 22 months. So far primary wave 4 would have lasted 15 months and be incomplete, so the proportion is acceptable.
This combination does not look normal though. Intermediate wave (X) is too shallow. Although intermediate wave (Y) would end close to the same level as intermediate wave (W), because of the shallow X wave the whole thing still has an upwards slope and is not overall a mostly sideways movement. However, it does fit and is technically possible. It will be considered as an alternate.
ALTERNATE DAILY ELLIOTT WAVE COUNT
Click chart to enlarge.
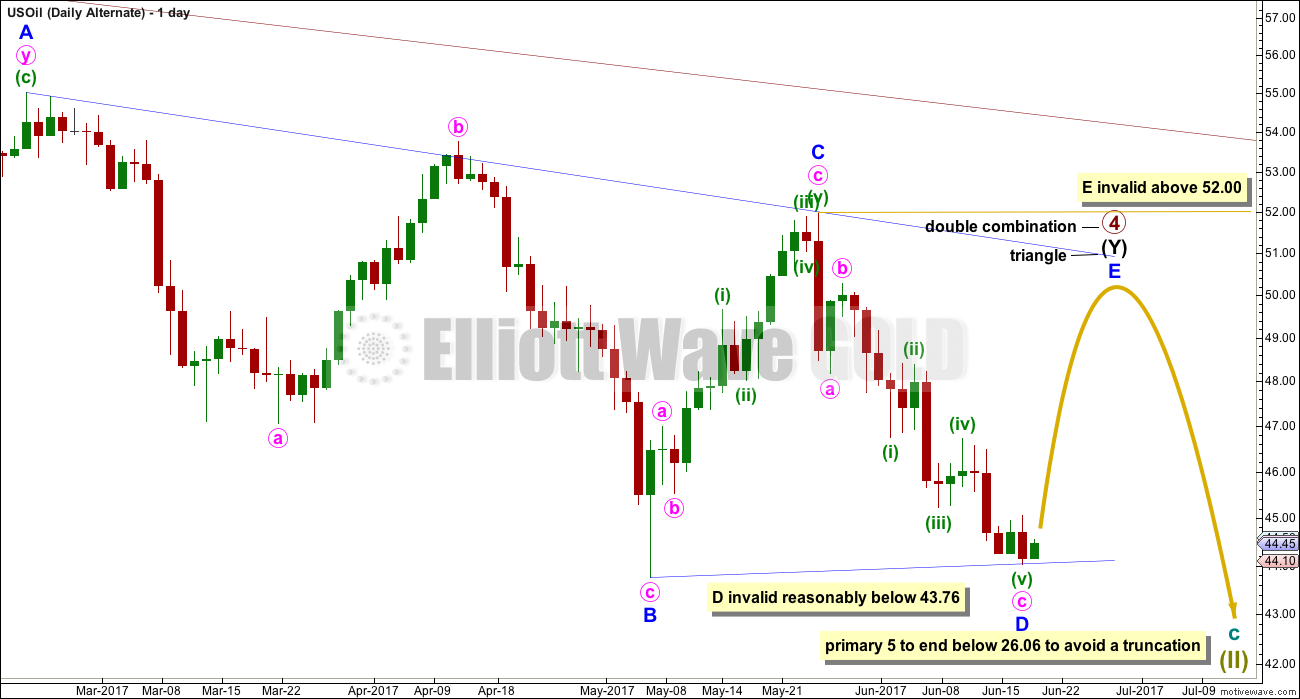
The triangle of intermediate wave (Y) is shown here in more detail.
Four of the five waves of a triangle must subdivide into zigzags, or zigzag multiples, and only one may be a multiple. So far minor wave A fits best as a double zigzag. All remaining triangle sub-waves must be simple threes.
Minor wave D now looks like it may be complete here, although it may continue a little lower still. If intermediate wave (Y) is a contracting triangle, then minor wave D may not move beyond the end of minor wave B below 43.76. If intermediate wave (Y) is a barrier triangle, then minor wave D may end about the same level as minor wave B at 43.76. As long as the B-D trend line remains essentially flat the triangle will remain valid.
As soon as the B-D trend line has a downwards slope, then this triangle wave count may be discarded. That would offer strong confidence to the main wave count.
Minor wave E of both a contracting or barrier triangle may not move beyond the end of minor wave C above 52.00. Minor wave E would be very likely to fall short of the A-C trend line.
TECHNICAL ANALYSIS
DAILY CHART
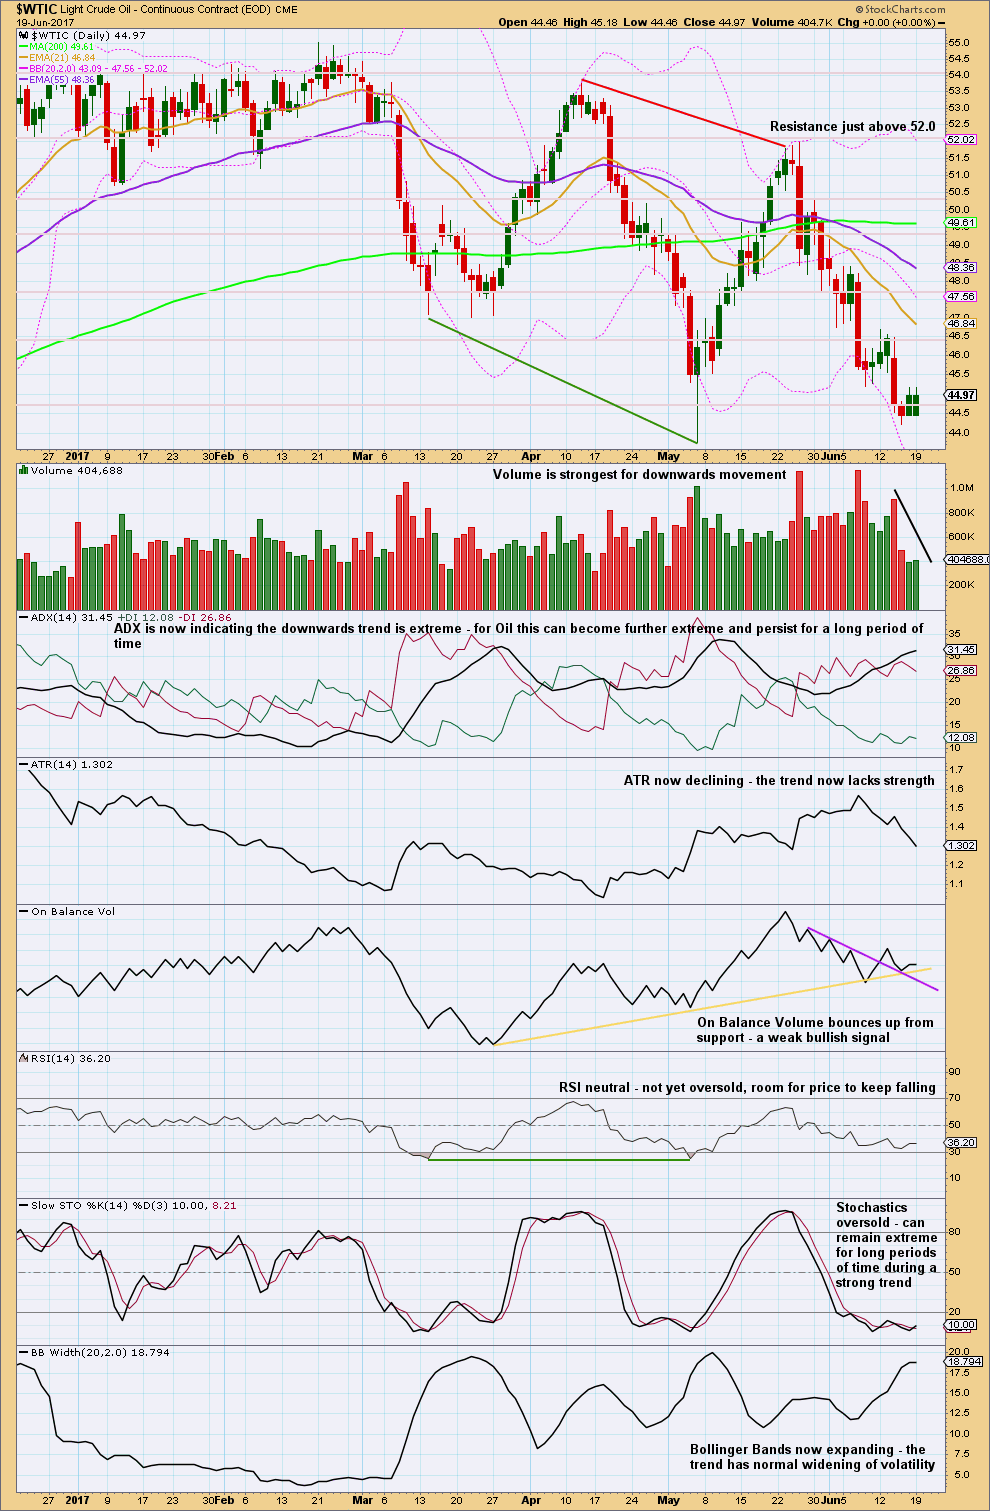
Click chart to enlarge. Chart courtesy of StockCharts.com.
Overall, now volume is falling as price is falling; the market is falling of its own weight. This can happen for some time during a strong trend for Oil, but it does support the alternate Elliott wave count this week.
This week all three moving averages now have a negative slope. The shortest is below the mid term, which is below the long term, and price is below all three. This is a full bore bearish look. This supports the Elliott wave count at the monthly chart level.
ATR and On Balance Volume offer some support to the alternate Elliott wave count this week. Members are strongly advised to protect profits on short positions and be prepared to exit the market during a counter trend bounce, which may again be deep.
VOLATILITY INDEX
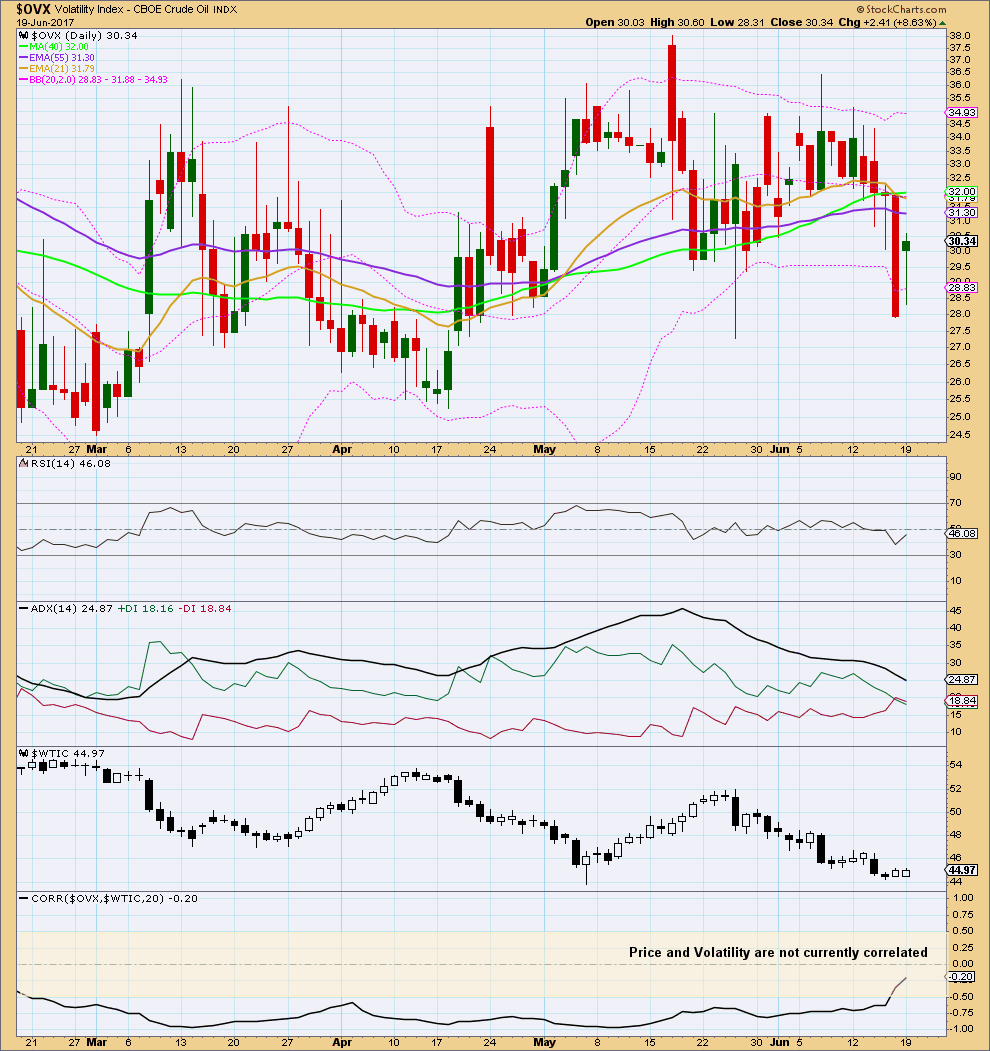
Click chart to enlarge. Chart courtesy of StockCharts.com.
Normally, volatility should decline as price rises and volatility should increase as price falls. Divergence from this normal can provide a bullish or bearish signal for Oil. However, it is noted that this signal occurs both in minor and major lows and it cannot be used to distinguish between them.
At this time, volatility and price do not have a negative correlation. Volatility cannot be used at this time to signal if a low is in place or not.
This analysis is published @ 03:33 a.m. EST.
Crude should begin next leg down soon or we will break out of the downward channel
I’m going to adjust that channel ever so slightly so it’s a slightly better fit, containing all movement. I’ll add the anchor points to the daily chart so you can see exactly how I’ve drawn it.
Lara,
Do you see, Micro [4] done at today’s high at 44.20 and subminuette iii done at today’s low at 42.05 ?
If so any likely targets for subminuette iv near 46
?
Excellent analysis and TIA.
You know what, TBH I just don’t know.
At this stage there are multiple ways to label this wave down. Micro 3 may not even be over, it could be extending.
What I am reasonably confident of is the yellow best fit channel. While price remains within it expect it to keep going down. If that channel is breached, exit shorts.
I don’t want to get too hung up on labelling all the little corrections along the way down.
Just use that channel to manage shorts. Pull stops lower, protect profit, add to short positions when price has a day or two up.
I’m going to pull my stops today down to about 44.82. I’ll look to see if today closes green, if it does I’ll add to short positions.
Thanks Lara.
the new low today at 42.94 is far enough below the prior swing low at 43.76 for the B-D trend line now to have a downwards slope
the alternate is discarded
only one count remains
Useful reminder, thanks. Nevertheless, we’re probably due a 1-3 day correction soon I would think.
If that happens use it as an opportunity to add to short positions I think.
Hi Lara,
Would it be fair to say a proper breach of the channel is a confidence point for the Alt Daily?
Tks
Yes, I think that would be fair.