
Downwards movement continues as the Elliott wave analysis overall expects.
Summary: Overall, downwards movement is still expected and bounces are an opportunity to enter short or to add to short positions.
At this time, stops may be set just above the last swing high about 52.00. The profit target for now is at 32.89, but this may be not low enough. Always use a stop and do not invest more than 1-5% of equity on any one trade.
New updates to this analysis are in bold.
MONTHLY ELLIOTT WAVE COUNT
Click chart to enlarge.
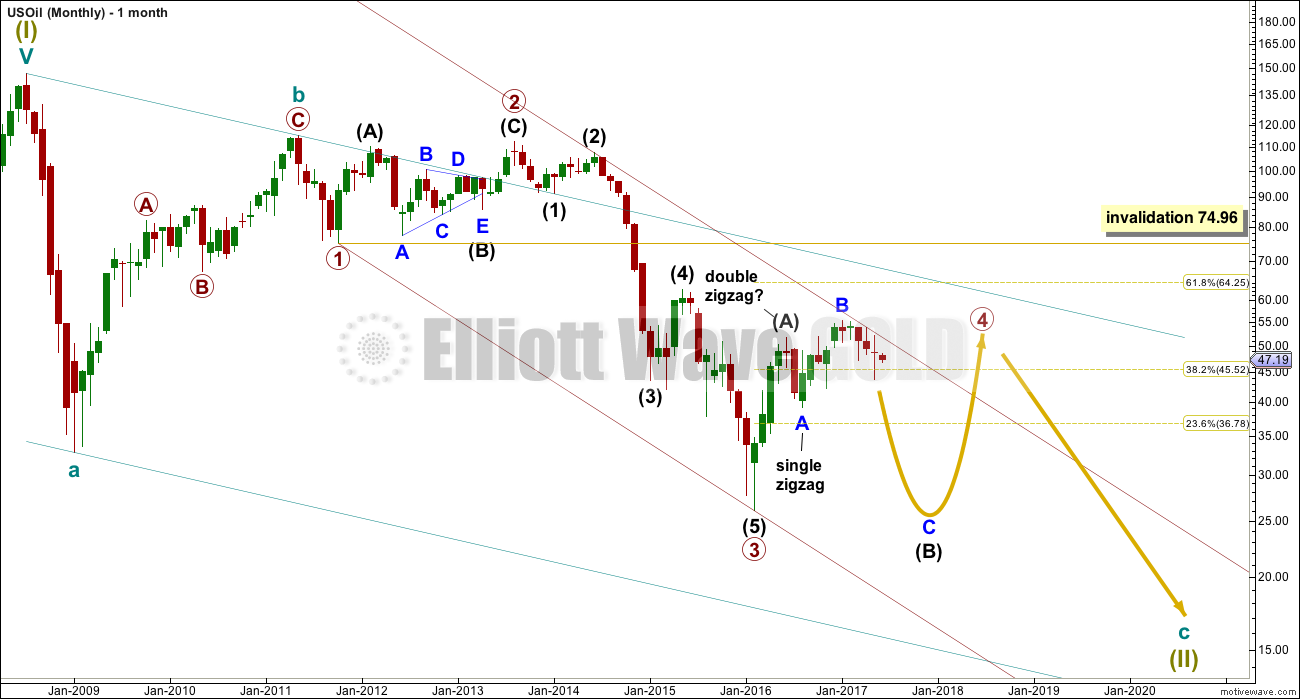
Within the bear market, cycle wave b is seen as ending in May 2011. Thereafter, a five wave structure downwards for cycle wave c begins.
Within cycle wave c, at this stage it does not look like primary wave 5 could be complete. That would only be possible if primary wave 4 was over too quickly.
Primary wave 1 is a short impulse lasting five months. Primary wave 2 is a very deep 0.94 zigzag lasting 22 months. Primary wave 3 is a complete impulse with no Fibonacci ratio to primary wave 1. It lasted 30 months.
Primary wave 4 is likely to exhibit alternation with primary wave 2. Primary wave 4 is most likely to be a flat, combination or triangle. Within all of these types of structures, the first movement subdivides as a three. The least likely structure for primary wave 4 is a zigzag.
Primary wave 4 is likely to end within the price territory of the fourth wave of one lesser degree; intermediate wave (4) has its range from 42.03 to 62.58.
If primary wave 4 is incomplete, then it looks like it may not remain contained within the channel. Sometimes fourth waves overshoot channels and this is why Elliott developed a second technique to redraw the channel when it does not contain a fourth wave.
Primary wave 4 is most likely to be shallow to exhibit alternation in depth with primary wave 2. So far it has passed the 0.382 Fibonacci ratio at 45.52. It may now continue to move mostly sideways in a large range. The new alternate weekly wave count below looks at the possibility that it may be very close to completion.
Primary wave 4 may not move into primary wave 1 price territory above 74.96.
At this stage, primary wave 4 has completed intermediate wave (A) only. Intermediate wave (B) is incomplete.
WEEKLY ELLIOTT WAVE COUNT
Click chart to enlarge.
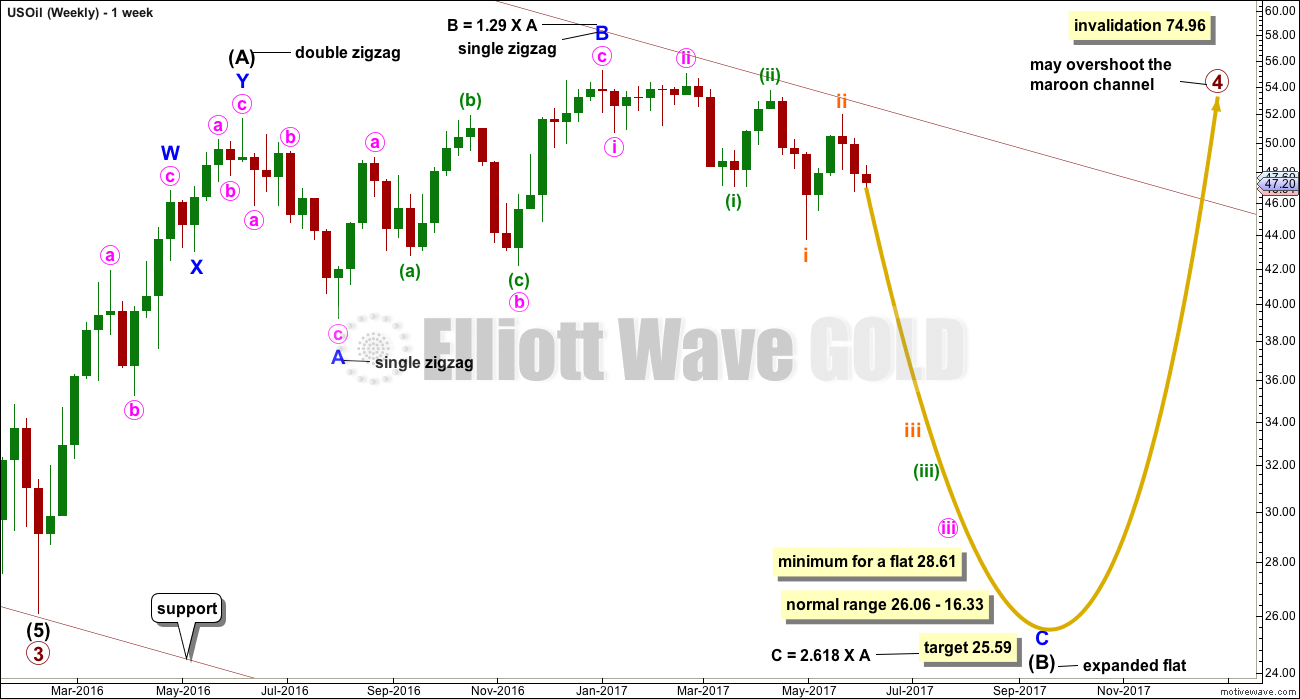
The whole structure of primary wave 4 is seen here in more detail.
The first wave labelled intermediate wave (A) is seen as a double zigzag, which is classified as a three.
Intermediate wave (B) is also a three. This means primary wave 4 is most likely unfolding as a flat correction if my analysis of intermediate wave (A) is correct. Flats are very common structures.
Intermediate wave (B) began with a zigzag downwards. This indicates it too is unfolding most likely as a flat correction.
Within intermediate wave (B), the zigzag upwards for minor wave B is a 1.29 correction of minor wave A. This indicates intermediate wave (B) may be unfolding as an expanded flat, the most common type.
The normal range for intermediate wave (B) within a flat correction for primary wave 4 is from 1 to 1.38 the length of intermediate wave (A) giving a range from 26.06 to 16.33.
Primary wave 4 may not move into primary wave 1 price territory above 74.96.
Within the larger expanded flat correction of primary wave 4, intermediate wave (B) must retrace a minimum 0.9 length of intermediate wave (A) at 28.61 or below.
DAILY ELLIOTT WAVE COUNT
Click chart to enlarge.
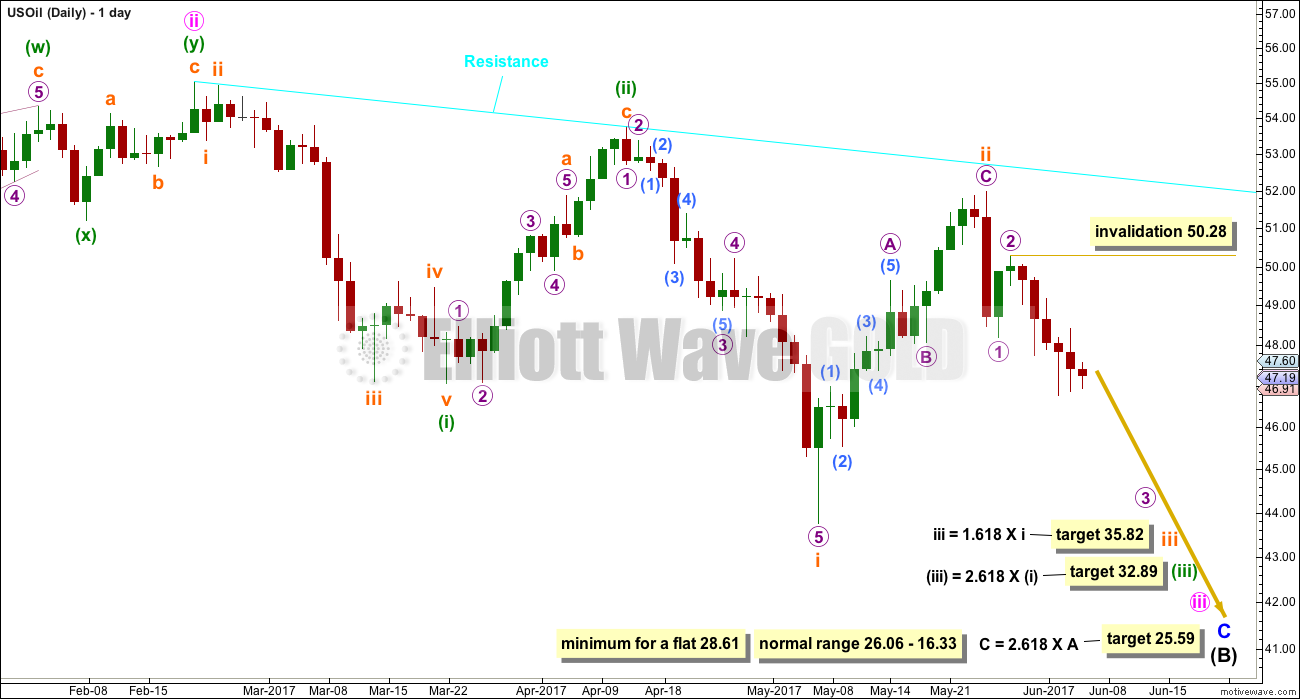
Minor wave C downwards must subdivide as a five wave structure.
So far now there would be four overlapping first and second waves within this wave count. This indicates a possible strong increase in downwards momentum to come as the middle of a third wave passes.
When third waves extend, as this one is, they necessarily begin with a series of overlapping first and second waves. Third wave extensions are extended in both price and time, and they show lower degree corrections within them on higher time frames. This one so far looks like a normal start to a third wave.
Within micro wave 3, no second wave correction may move beyond the start of its first wave above 50.28.
A target is supplied this week for subminuette wave iii to end.
Be aware though that subminuette wave iv may be a relatively brief and shallow correction and short positions may still be held through it. Subminuette wave iv may not move back up into subminuette wave i price territory above 43.76, so short positions opened comfortably above this point may still remain profitable while it unfolds.
The target for minuette wave (iii) remains the same.
ALTERNATE WEEKLY ELLIOTT WAVE COUNT
Click chart to enlarge.
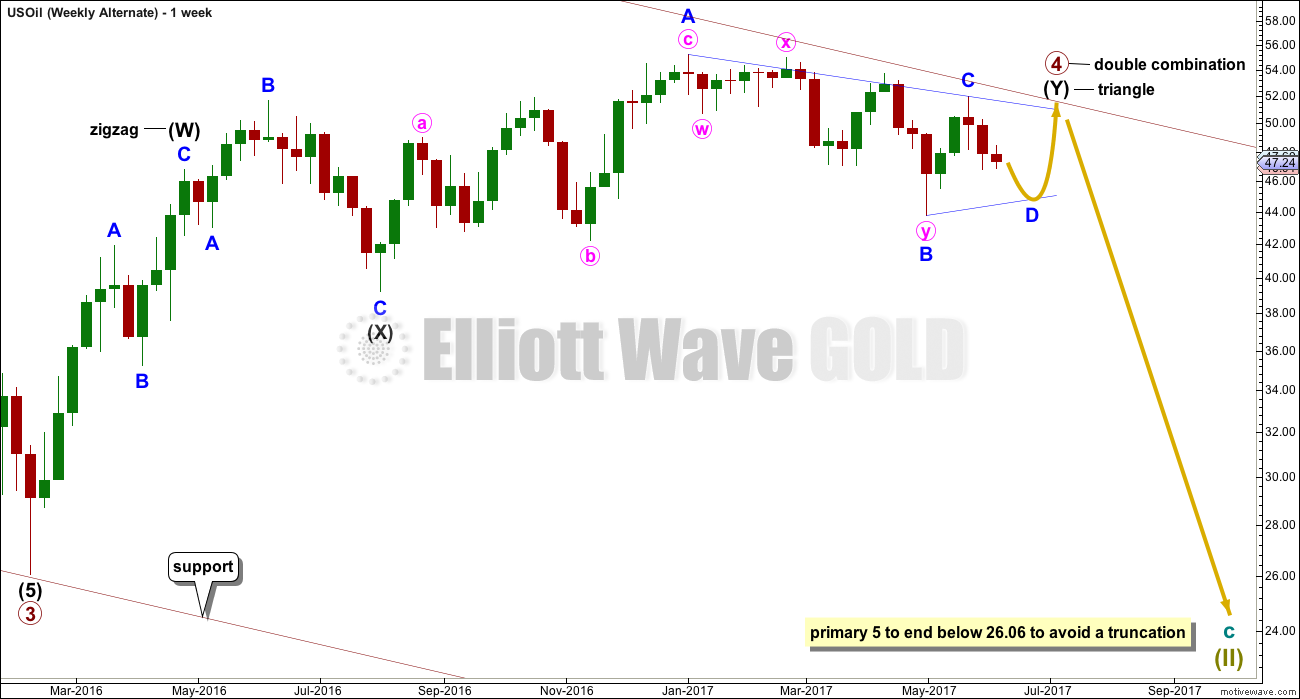
What if primary wave 4 is closer to an end and remains within the maroon channel copied over from the monthly chart? What structure could it be?
Primary wave 4 will fit as an almost complete double combination: zigzag – X – triangle. This would see price remain within the maroon channel.
A combination would exhibit good alternation with the zigzag of primary wave 2. Primary wave 2 lasted 22 months. So far primary wave 4 would have lasted 15 months and be incomplete, so the proportion is acceptable.
This combination does not look normal though. Intermediate wave (X) is too shallow. Although intermediate wave (Y) would end close to the same level as intermediate wave (W), because of the shallow X wave the whole thing still has an upwards slope and is not overall a mostly sideways movement. However, it does fit and is technically possible. It will be considered as an alternate.
TECHNICAL ANALYSIS
DAILY CHART
Click chart to enlarge. Chart courtesy of StockCharts.com.
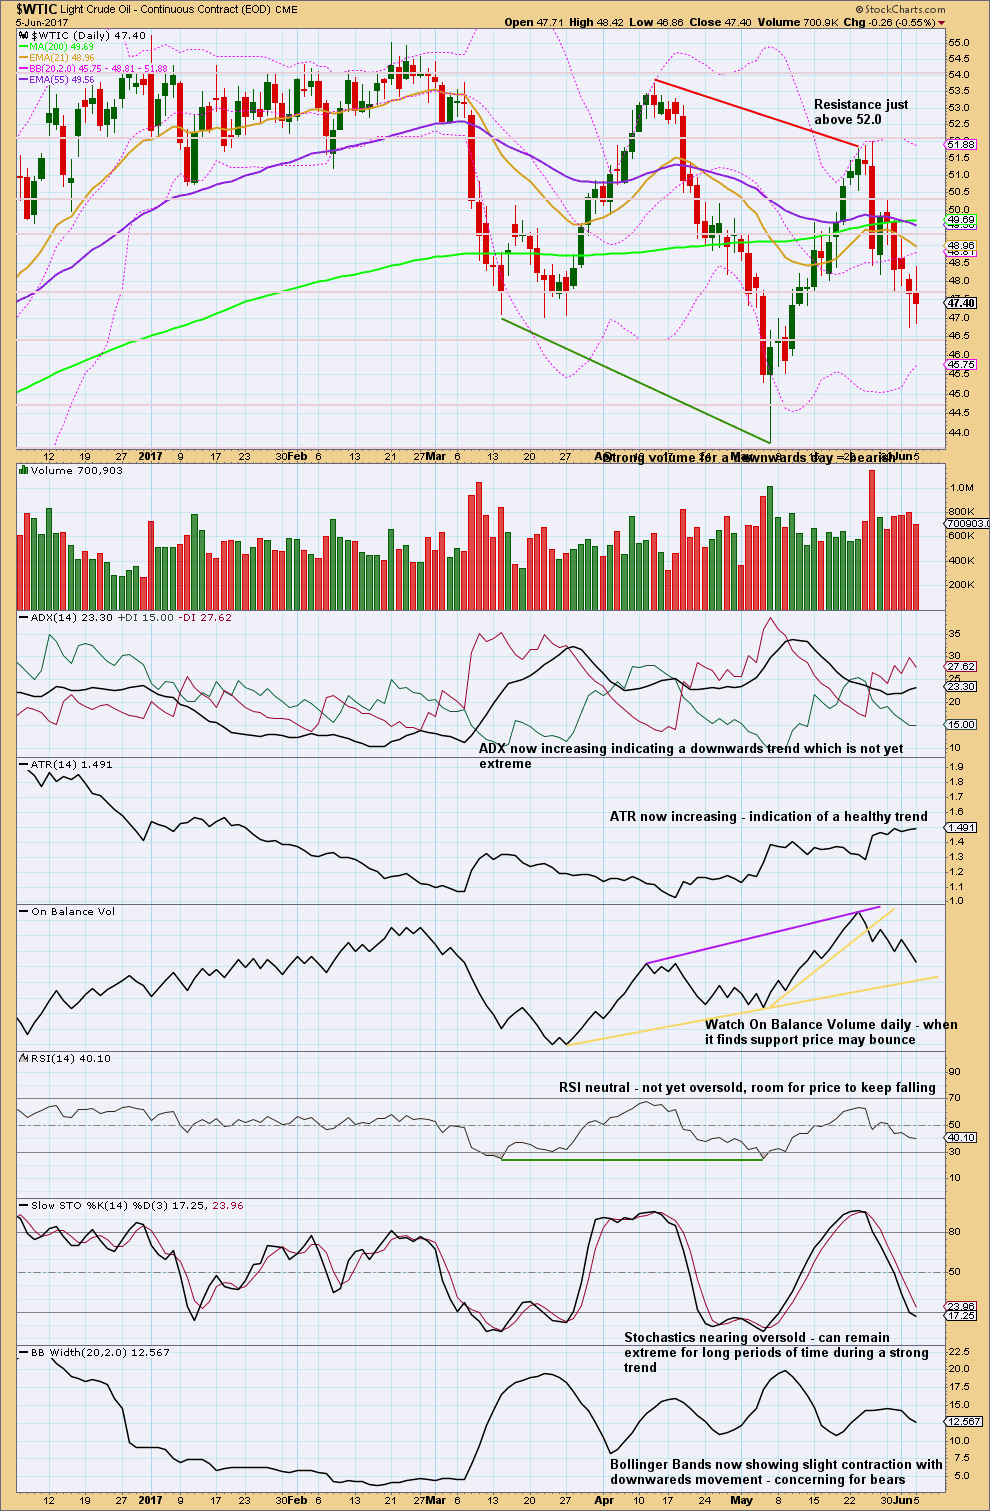
The first four days of current downwards movement come with some increase in volume. The volume profile remains bearish: each time as price falls volume rises and when price rises volume falls.
The long lower wick on the candlestick for the 2nd of June is bullish, and now the spinning top candlestick for the 5th of June is neutral.
The short term moving average now has a negative slope and is below both mid and long term averages. The mid term moving average has a negative slope and is below the long term average. The long term 200 day moving average still has a positive slope. Overall, these averages give a bearish picture.
Overall, this chart is bearish and offers support to the Elliott wave analysis.
The only concern today is Bollinger Bands not widening with the trend, so this may slightly support the alternate weekly chart.
VOLATILITY INDEX
Click chart to enlarge. Chart courtesy of StockCharts.com.
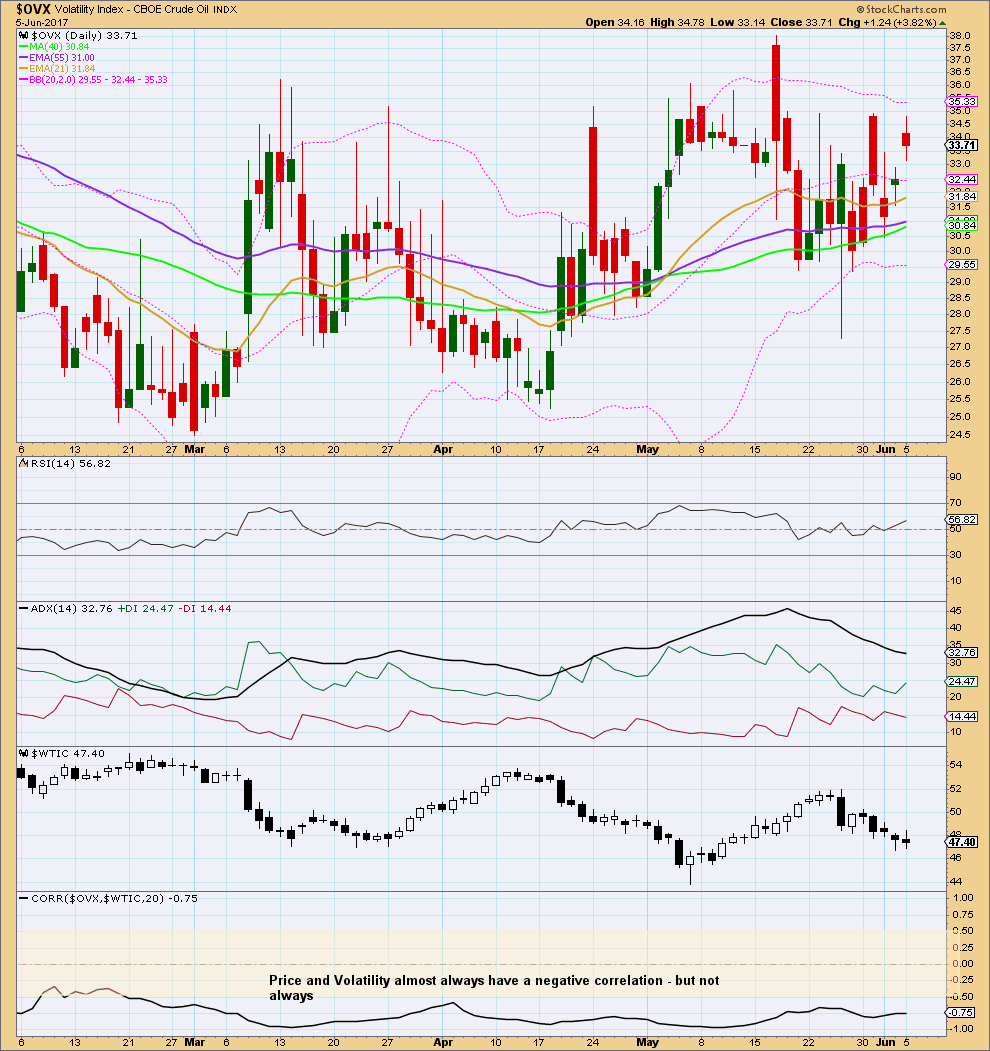
Normally, volatility should decline as price rises and volatility should increase as price falls. Divergence from this normal can provide a bullish or bearish signal for Oil. However, it is noted that this signal occurs both in minor and major lows and it cannot be used to distinguish between them.
There is no divergence today between price and volatility.
This analysis is published @ 02:40 a.m. EST.
Lara if the primary is in play, are we on the midst of a 3rd of 3rd decline here?
That’s the expectation. Third wave extensions show their subdivsions on higher time frames, so the corrections along the way so far look pretty normal.
Anyone watching oil?
Looks like v of c done on the correction at ~46.67
Nailed the oil count Lara, nice!
Nice work on Cl.
Thanks Lara.
Looks like we just completed C of (2).
If correct, (3) should begin shortly.
Inventory report due tomorrow