
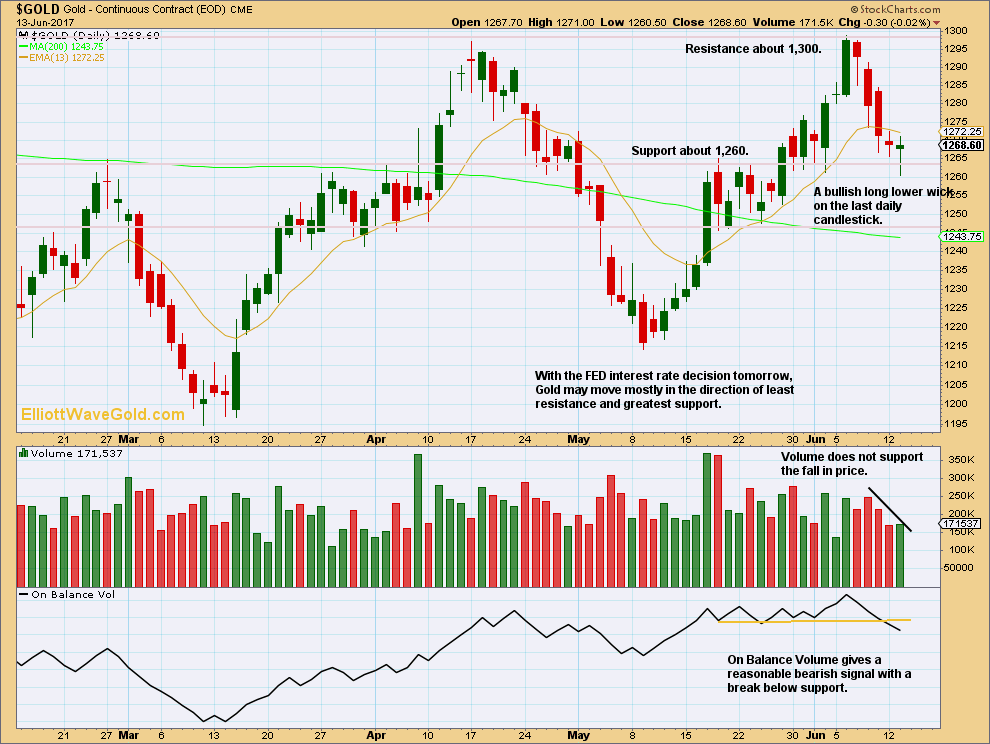
Technical analysis chart of Gold with Volume and On Balance Volume indicators, and support and resistance lines, may give guidance as to the direction Gold may take after FED Interest rate decision.
Click chart to enlarge. Chart courtesy of StockCharts.com.
The recent fall in price over the last three days does not have support from volume and this suggests a bounce should be expected here or very soon. Additionally, there is strong, bullish support for Gold’s price at about 1,260. These support the idea of upwards movement after the FED Interest rate decision.
However, the latest and now most important signal comes from On Balance Volume breaking below support. This is bearish.
Given that a technical analysis approach would expect Gold to move mostly in the direction of least resistance and away from greatest support, the expectation is for Gold to breakout upwards. But because of On Balance Volume’s bearish signal, any upside movement is expected to be relatively short lived.
Also, On Balance Volume supports my current Elliott wave count.
This analysis is published @ 03:30 a.m. EST.