
A pullback was expected when price made a new low below 1,244.28, but it was expected to be a little deeper though: price fell $6 short of the first target at 1,238.
The overall trend remains up, which still fits the Elliott wave count.
Summary: For now the trend is up, but it may be coming to an end in one more session to a few days. Use the blue Elliott channel on the main daily and hourly chart. Assume the trend remains upwards while price remains within the channel. The target is at 1,277.
When this channel is breached by downwards movement, that shall indicate a trend change.
Always use a stop. Invest only 1-5% of equity on any one trade.
New updates to this analysis are in bold.
Last monthly charts and alternate weekly charts are here, video is here.
Grand SuperCycle analysis is here.
MAIN ELLIOTT WAVE COUNT
WEEKLY CHART
Click chart to enlarge.
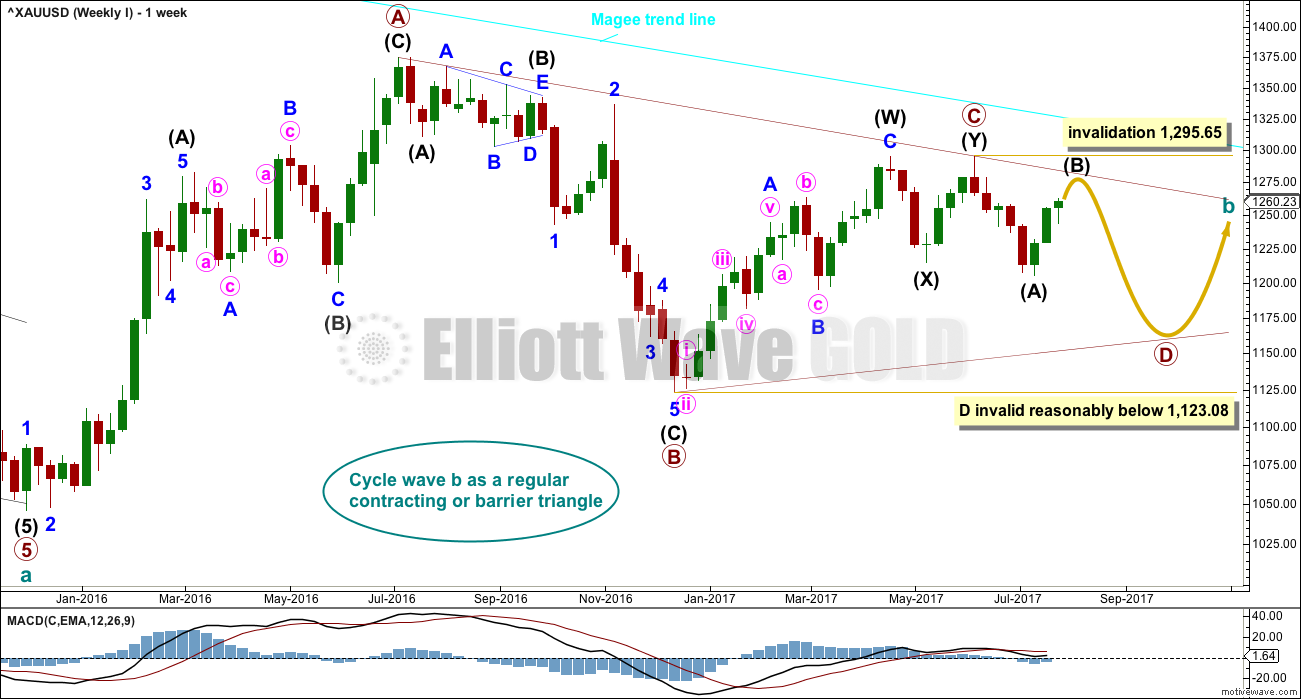
The Magee bear market trend line is added to the weekly charts. This cyan line is drawn from the all time high for Gold on the 6th of September, 2011, to the first major swing high within the following bear market on the 5th of October, 2012. This line should provide strong resistance.
At this stage, a triangle still looks possible and has the best fit for cycle wave b. It has some support from declining ATR and MACD now beginning to hover about zero.
Within a triangle, one sub-wave should be a more complicated multiple, which may be primary wave C. This is the most common sub-wave of the triangle to subdivide into a multiple.
Primary wave D of a contracting triangle may not move beyond the end of primary wave B below 1,123.08. Contracting triangles are the most common variety.
Primary wave D of a barrier triangle should end about the same level as primary wave B at 1,123.08, so that the B-D trend line remains essentially flat. This involves some subjectivity; price may move slightly below 1,123.08 and the triangle wave count may remain valid. This is the only Elliott wave rule which is not black and white.
Triangles normally adhere very well to their trend lines. So far the A-C trend line has been tested 11 times; this line has very strong technical significance. If this wave count is correct, then intermediate wave (B) should find very strong resistance if it gets up to the A-C trend line. A small overshoot is acceptable. A breach is not. If price reaches up to that trend line in the next one to few days, it would offer a good entry point for a short position. Stops then may be set a little above the line, or just above the invalidation point.
Finally, primary wave E of a contracting or barrier triangle may not move beyond the end of primary wave C above 1,295.65. Primary wave E would most likely fall short of the A-C trend line. But if it does not end there, then it can slightly overshoot that trend line.
Primary wave A lasted 31 weeks, primary wave B lasted 23 weeks, and primary wave C may have been complete in 25 weeks.
Primary wave D should now be expected to last a Fibonacci 13 or 21 weeks in total.
DAILY CHART
Click chart to enlarge.
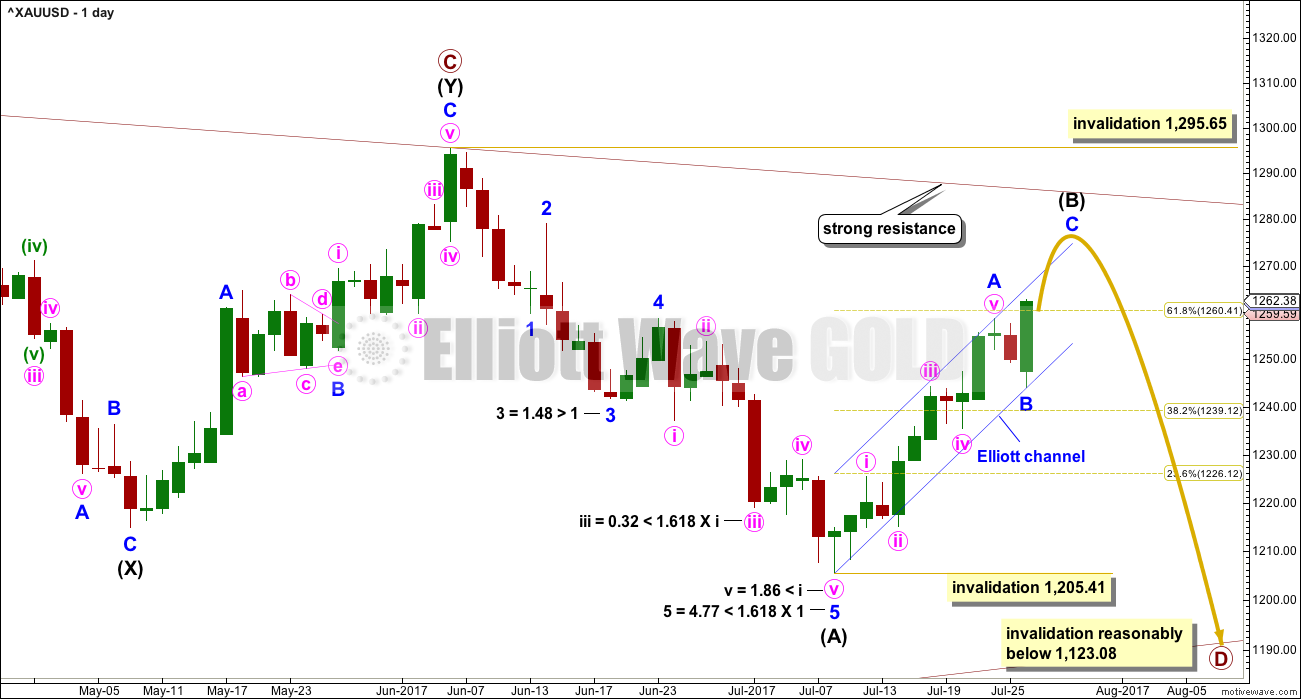
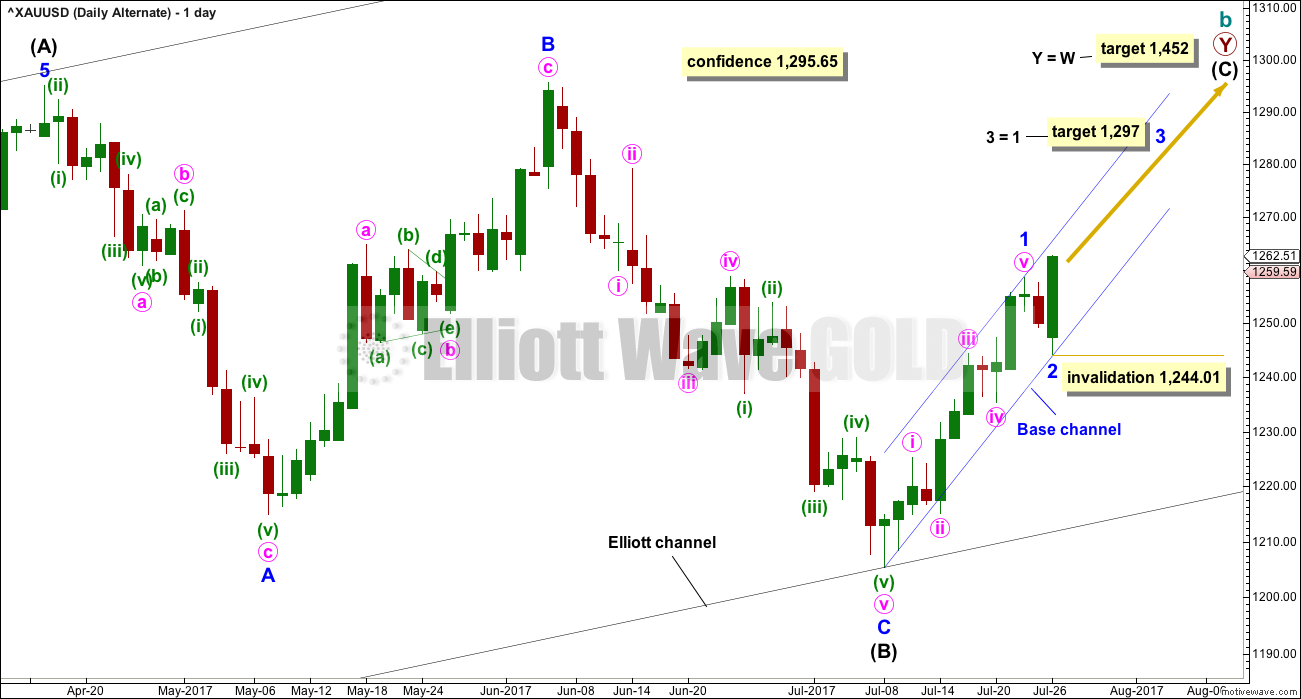
A common range for triangle sub-waves is from about 0.8 to 0.85 the prior sub-wave, this gives a range for primary wave D from 1,158 to 1,149. At this stage, to try and see the whole of primary wave D complete at last week’s low does not look right. The B-D trend line would be too steep for a normal looking contracting Elliott wave triangle, and primary wave D would have been far too brief at only 5 weeks duration. For the wave count to have the right look and good proportions (as Gold almost always does), primary wave D should not be labelled over yet.
If primary wave C is correctly labelled as a double zigzag, then primary wave D must be a simple A-B-C structure and would most likely be a zigzag.
With only intermediate wave (A) complete and now intermediate wave (B) a large and deep correction, primary wave D is beginning to look very typically like a large exaggerated zigzag.
Intermediate wave (B) looks to be unfolding as a zigzag, a three wave structure. Corrective waves have a count of 3, 7, 11, 15 etc. Each extension adds another 4. So far intermediate wave (B) has a count of 7 on the daily chart, so it may now possibly be complete at any stage.
Draw an Elliott channel about the zigzag of intermediate wave (B). Use this as a guide to when it may be over. When price breaks below the lower edge, that may be taken as an indication of a trend change.
So far intermediate wave (B) has lasted 12 days. The next Fibonacci number in the sequence is 13, which would see intermediate wave (B) end in a further one day.
Within the zigzag of primary wave D, intermediate wave (B) may not move beyond the start of intermediate wave (A) above 1,295.65.
HOURLY CHART
Click chart to enlarge.
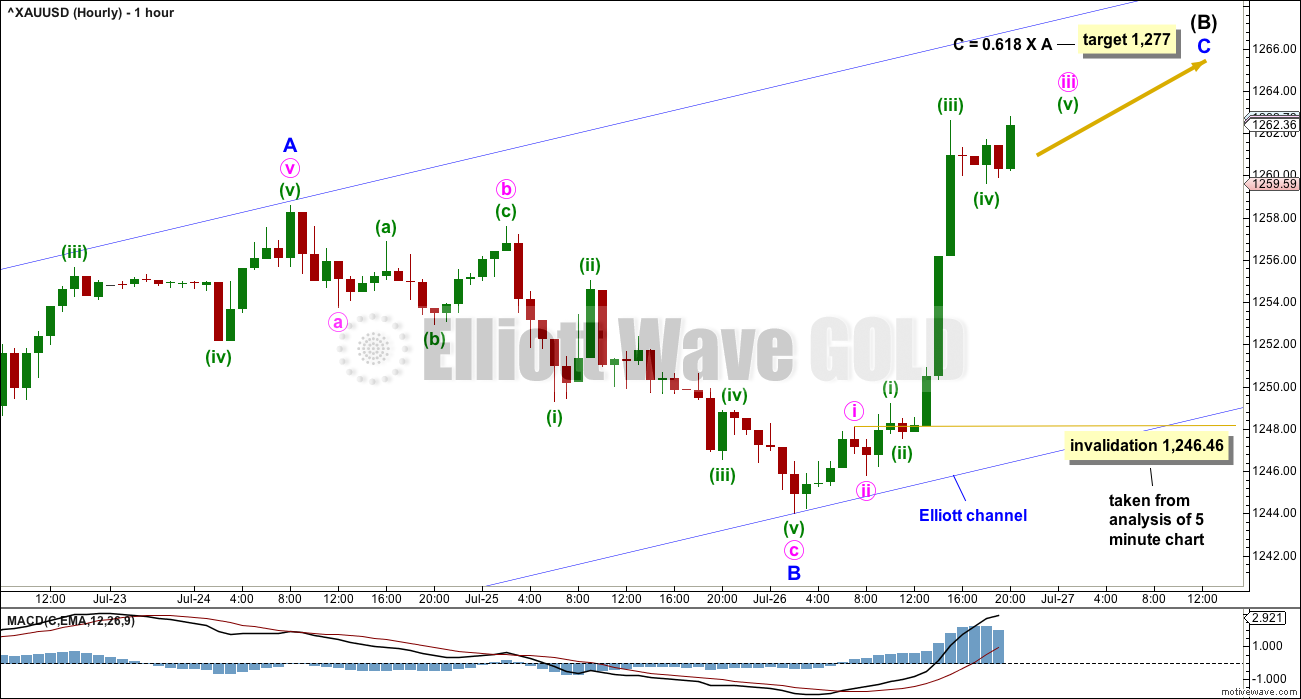
After analysis of the five minute chart, upwards movement for this last session is labelled as an incomplete minor wave C.
Minor wave C must subdivide as a five wave motive structure. It is unfolding as an impulse. On the five minute chart, upwards movement today began with a series of three overlapping first and second waves (only two degrees can be shown on the hourly chart). Upwards movement for this session looks like an incomplete impulse.
Because minor wave A was so long, minor wave C should be shorter. Were minor wave C to reach equality in length with minor wave A that would take price above the invalidation point at 1,295.65. The target uses the 0.618 Fibonacci ratio for this reason.
If minor wave C is expected to be shorter in length than minor wave A, then it would most likely also be shorter in duration. Minor wave A was a stretched out extension. The guideline of alternation may be applied here to expect minor wave C to not be extended.
If minor wave C is not extended, then it may not show the subdivisions within it at the daily chart level. Minute waves ii and iv may be over more quickly, as corrections within a session and not multi day corrections.
Within minor wave C, minute wave iv may not move into minute wave i price territory below 1,246.46 (this point is taken exactly from analysis of the five minute chart, which is intra hour).
ALTERNATE ELLIOTT WAVE COUNT
WEEKLY CHART
Click chart to enlarge.
This wave count has been published only in historical analysis. At this stage, it will be published on a daily basis.
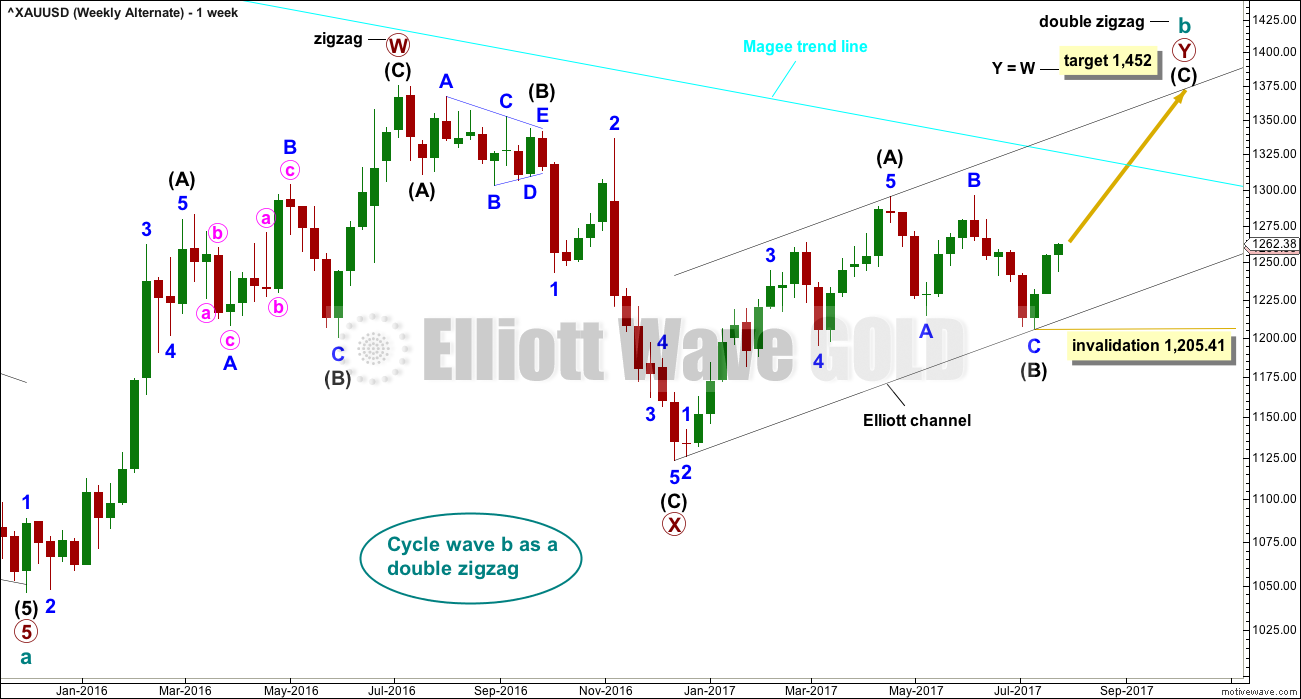
There are more than 23 possible corrective structures that B waves may take, and although cycle wave b fits best at this stage as a triangle (main wave count), it may still be another structure. This wave count looks at the possibility that it may be a double zigzag.
If cycle wave b is a double zigzag, then current upwards movement may be part of the second zigzag in the double, labelled primary wave Y.
The biggest problem with this wave count is the structure of intermediate wave (A) within primary wave Y. This upwards wave looks very much like a three and not a five. This upwards wave must be seen as a five for this wave count to work.
Within the second zigzag of primary wave Y, intermediate wave (B) is a completed regular flat correction. Minor wave C ends just slightly below the end of minor wave A avoiding a truncation. There is no Fibonacci ratio between minor waves A and C.
The target remains the same as previously published for this wave count.
Along the way up, some resistance should be expected at the cyan Magee trend line.
Within intermediate wave (C), no second wave correction may move beyond the start of its first wave below 1,205.41.
DAILY CHART
Click chart to enlarge.
Intermediate wave (C) may be unfolding as an impulse.
Minor wave 2 may be over as a very quick and shallow zigzag. Strong upwards movement at the end of this session may be the start of minor wave 3.
Because minor wave 1 was a long extension, the target for minor wave 3 is for equality with minor wave 1.
Within minor wave 3, no second wave correction may move beyond the start of its first wave below 1,244.01.
HOURLY CHART
Click chart to enlarge.
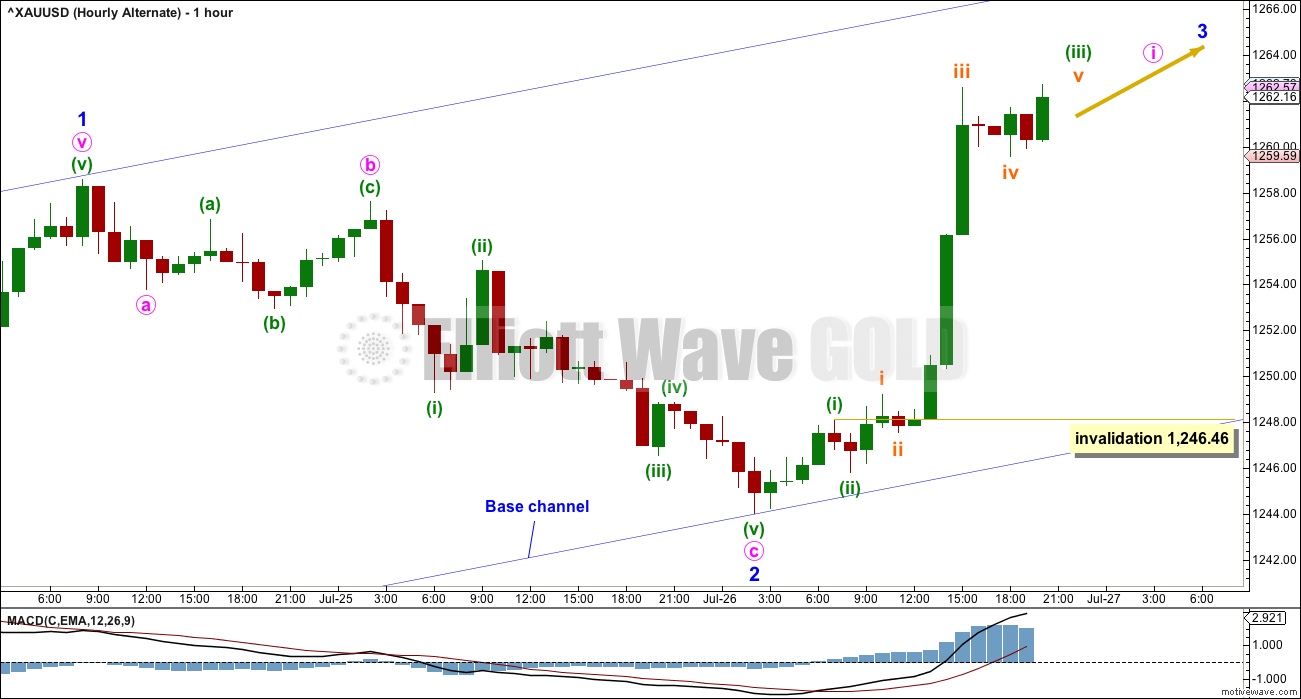
If minor wave 3 for this alternate is to be an extension reaching equality with minor wave 1, then its subdivisions may show up on the daily chart like those for minor wave 1 do.
Minute wave i may be incomplete. Within minute wave i, the upcoming correction for minuette wave (iv) may not move into minuette wave (i) price territory below 1,246.46.
When minute wave i could be a complete five wave impulse, then the next correction for minute wave ii should find strong support at the lower edge of the blue base channel. A breach of that channel would put significant doubt on this alternate wave count. A new low at that stage below the start of minor wave 3 at 1,244.01 would invalidate it.
TECHNICAL ANALYSIS
WEEKLY CHART
Click chart to enlarge. Chart courtesy of StockCharts.com.
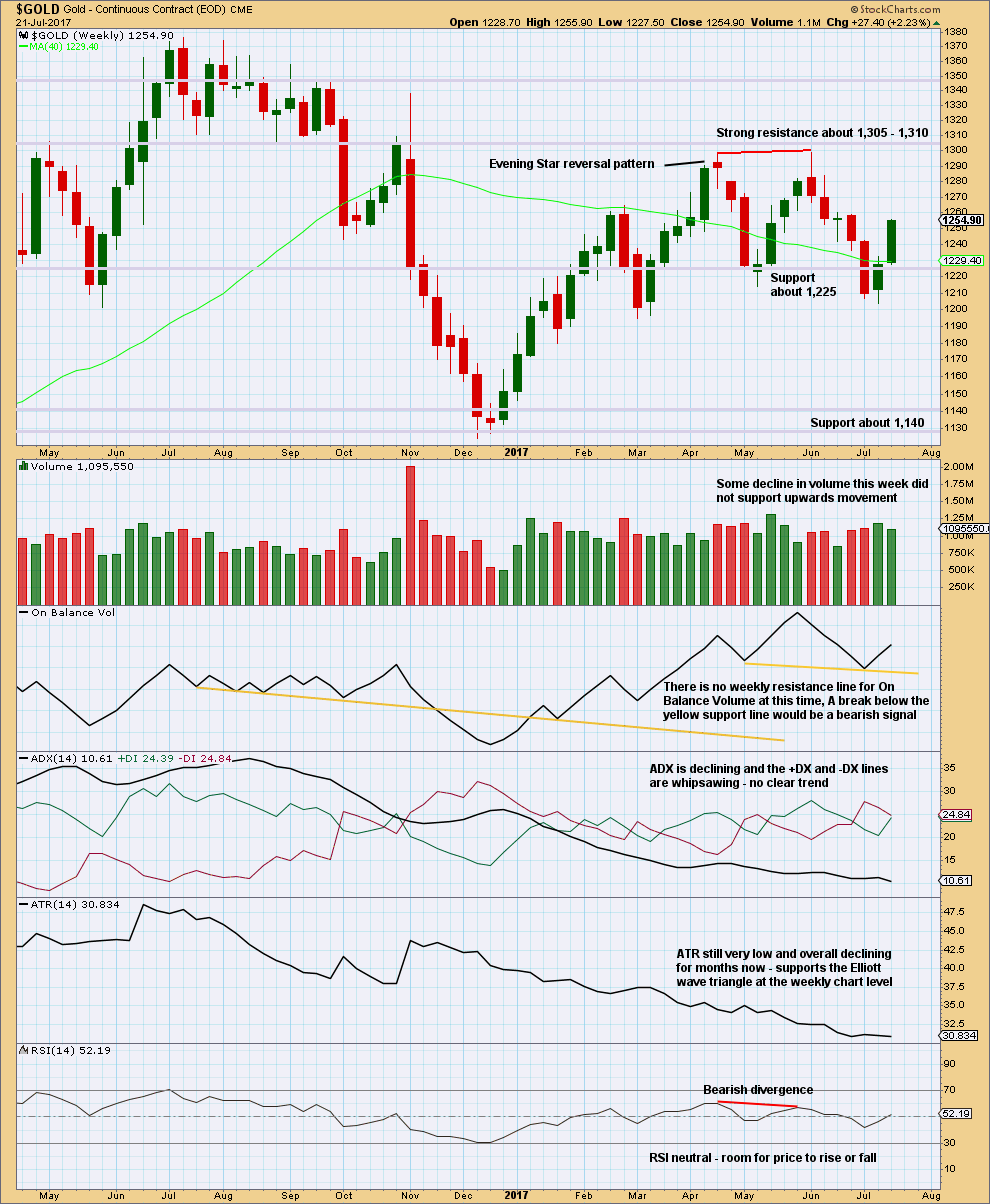
A lack of support for upwards movement from volume favours the main Elliott wave count.
ADX and ATR favour the main Elliott wave count.
DAILY CHART
Click chart to enlarge. Chart courtesy of StockCharts.com.
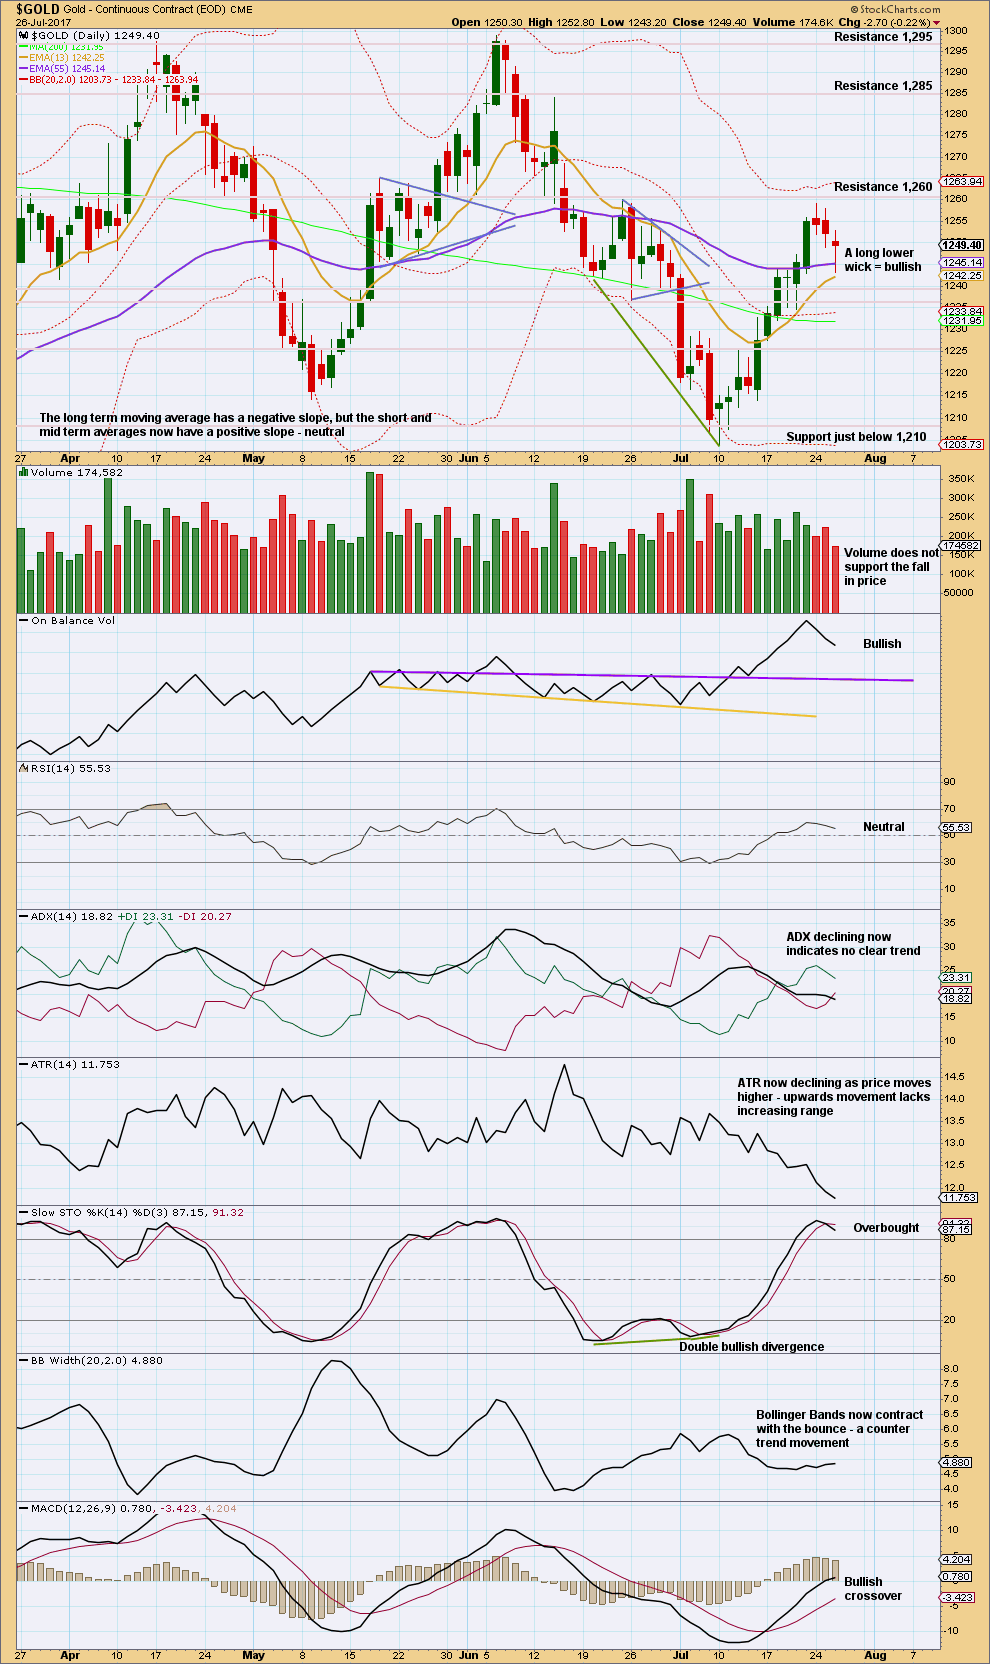
Volume and the candlestick wick are both bullish today. This supports both Elliott wave counts for the short term.
ATR and Bollinger Bands both still support the main Elliott wave count over the alternate.
GDX
DAILY CHART
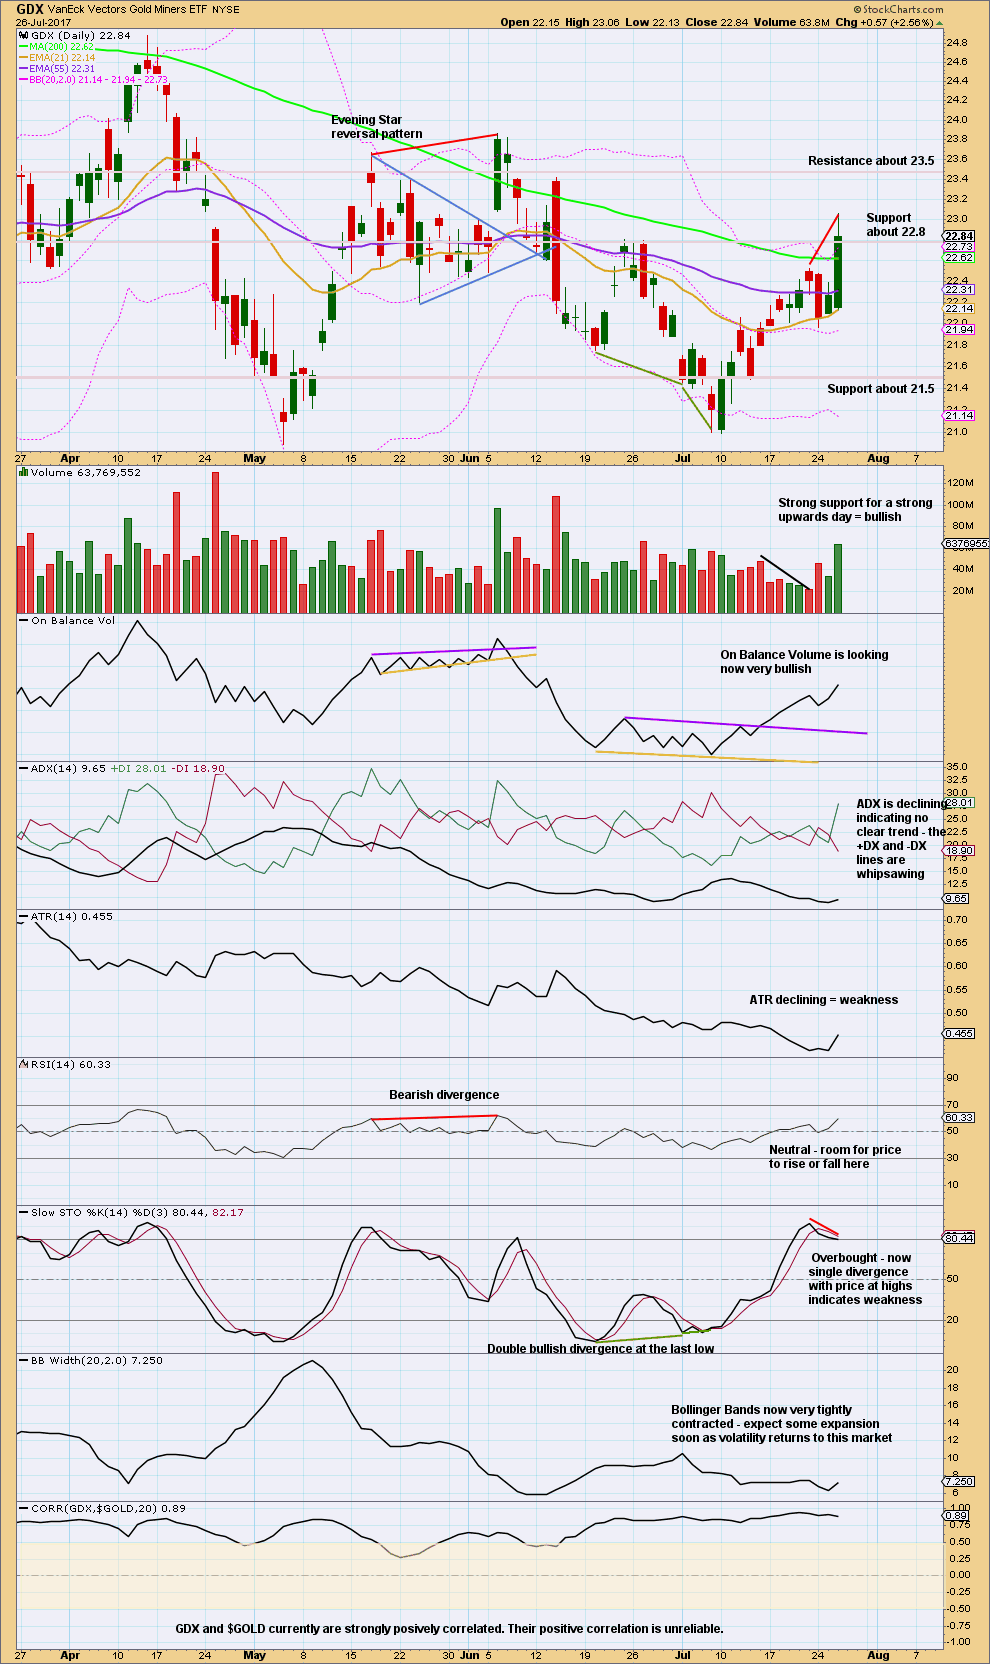
Click chart to enlarge. Chart courtesy of StockCharts.com.
While volume is bullish, Stochastics indicates some weakness within upwards movement. This may develop further before a high may be in place, or it may disappear.
There is room for more upwards movement; RSI is not yet overbought. Next resistance is about 23.50.
Published @ 09:41 p.m. EST.
The structure may now be complete, but we cannot have confidence in a trend change while price remains within the blue channel. That’s the bottom line. After the channel is breached there is very likely to be a throwback to find resistance at the lower edge, and so being patient and waiting for confidence then a set up may be well rewarded.
The alternate idea to this of course is to move the degree of labelling within minor C all down one degree. The five up here may be only minute wave i, minor C may still extend higher.
A new low below 1,244.01 would invalidate that idea and so provide further confidence in a trend change.
VIX starting to run 😳
Indeed. Intense action today. Did not expect such a deep dip in gold either. Gold stocks slapped back and weak but still holding on to buy signal, barely. And gold clinging to 1260, also barely, which i thought was rock solid support after yesterday. Could all of this simply be presaging a stock market big correction/crash?
Lara said a primary degree SPX correction was almost here. Could be starting
i sure do hope gold goes up if that happens. I’m not in the mood to try and short the stock market. That’s been a sure recipe for me to lose money in the past and I’ve sworn off of it lol
My apologies for this post which is later than usual. My medical appointment today lasted a wee bit longer than the norm.
=========================
Gold Ichimoku Daily Analysis
Data as at 6:45 am ET, July 27
=========================
Gold prices climbed to a six-week’s high on Wednesday with the release of a dovish FOMC statement which included a cautious US inflation outlook meaning that interest rates are likely to remain low for a while.
Gold prices sustained above the 1240 level which was previous support. It seems that an inverse head-and-shoulders pattern is developing, with the neckline drawn in blue as shown. The left shoulder is 1241.68, and the right shoulder is 1244.01, yielding a neckline average of 1242.84. The head resides at 1205.41. So, the target for the IHS pattern will be 1280.28. This is agreeable with Lara’s target of 1277.
The Daily Ichimoku Chart shows that gold prices had entered into the cloud, and is attempting to breach the top cloud boundary. Once it does so, the trend will change to become strongly bullish. Tenkan-sen had made a positive crossover with the kijun-sen last Friday, July 21. With prices trading above these two lines, the impetus of a thrust towards the 1277-1280 region appears to be strong. I believe that, following an expected shallow Minute 4 (because Minute 2 was very deep), Minute 5 ought to present a good opportunity for a long trade. Minute 4 should not drop below 1255.23, the lower cloud boundary.
Alan, thank you so much for your frequent updates. Your work is greatly appreciated. I disagree with your ihs call though. Left shoulder has an overshoot, not accounted for. Right shoulder includes the overshoot on Wednesday. L & R shoulders look very different. R is almost non-existent.
Not being critical to argue, just my personal opinion.
John. Not to worry. It’s good to be able to learn from each other. That’s how we can progress.
I’ve also thought that the IHS does look a bit weird, not having the textbook look and feel. That’s why I said it “seems” to be developing. In a pinch, who knows, it may work.
Alan, there is an inverse head & shoulders pattern forming on the weekly chart.
I’m not sure how to post a chart here.
But the head is the low on 11/30/15.
Vince, like this?
Just save the StockCharts graph as an image file and upload.
Yes, that’s it.
Alan, do you think iii (pink) completed at 1265 @ 8:30 this morning or could C already be done?
Very difficult to see this as a wave iv
1266 could very well be the top.
Looks like 5 clean waves down off the top.
Bounce of 1255~ yes, but only a bounce imo
Agree with you.
Wave 4’s can be difficult to analyse.
I’ll simply take it that if there is no further drop below 1256.72, then Minute 4 is done. A 5-wave movement down can be only Minuette A of Minute 4, part of a 5-3-5 zigzag.
Patrick, I think it is pink iii (i.e. Minute 3).
Oh oh. Gold price has dropped below 1255.23, and is also a wee bit below the kijun-sen at the 1-hour timeframe; it has already dropped past the higher placed tenkan-sen. This could indicate Minute 4 is already completed. If not, then my analysis has to be reworked.
Any one look at Oil? looks like it is going to top and roll over soon.
Please refer to the details in my update in yesterday’s EW Gold, or the same one in Oil.
Oil price has risen above the cloud top boundary but is still below the 200 SMA. It has not tested the purple downward resistance trendline yet. Above the cloud means there is a bit more of upside. Until a test of resistance occurs, I feel that a drop is not here yet. It is near though.
Update on Copper:
A recent triangle has a nice fit. The breakout has been upwards. The green line is very significant: it goes back to 2011, and is repeatedly tested.
Now that pice is above this line look for price to curve down to test support. If that happens I will enter long there.
My previous hourly GDX count was invalidated today with a move above 22.53. I wasn’t expecting such a strong move up, but a stop was in place to protect capital.
Todays price action doesn’t change the bigger picture count which still sees this move up as a corrective wave within a trading range likely part of a large triangle.
Frankly, this move up has been difficult to analyze with all the overlapping. It is reworked today as an ABC move up with Minuette wave a as a leading expanding diagonal with a contracting ending diagonal within to end wave 5.
**Note to Lara: I’ve checked all the lengths for both diagonals and they meet the rules. If you see any issues, please advise. Thx
So overall, I think we have another 1-2 days of sideways and upward movement to complete Minute wave b. The target is 23.52, with invalidation of this count at 23.86.
https://www.tradingview.com/x/DMljvvEL/
Any thoughts on Oil?
Likely a good short now with a stop somewhere above the pink line on Lara’s chart
Thank you.
I got in a bit earlier but I am adding to my position
I’m not going to jump in right yet… the long lower wicks on the last two daily candlesticks for Oil look bullish and are putting a bit of doubt in my mind as to an upcoming trend change right now…
I’ll wait and watch for another day or so to see what happens.