
A downwards breakout was expected for Monday or Tuesday. A new low reasonably below 1,237.06 was the price point which provided confirmation. This happened quickly on Monday.
Summary: Members who entered short when price moved below 1,237.06 should now consider taking profits today. Members who did not enter short should exert patience and wait for an entry point which may come later this week.
Expect price to now move sideways and slowly higher over a few days to end about 1,237.
It is strongly recommended that members keep all trades with the trend: the trend is down. Always use a stop and invest only 1-5% of equity on any one trade. Stops should technically be set just above 1,248.09, profit target is now at 1,160.
New updates to this analysis are in bold.
Last monthly charts and alternate weekly charts are here, video is here.
Grand SuperCycle analysis is here.
WEEKLY CHART
Click chart to enlarge.
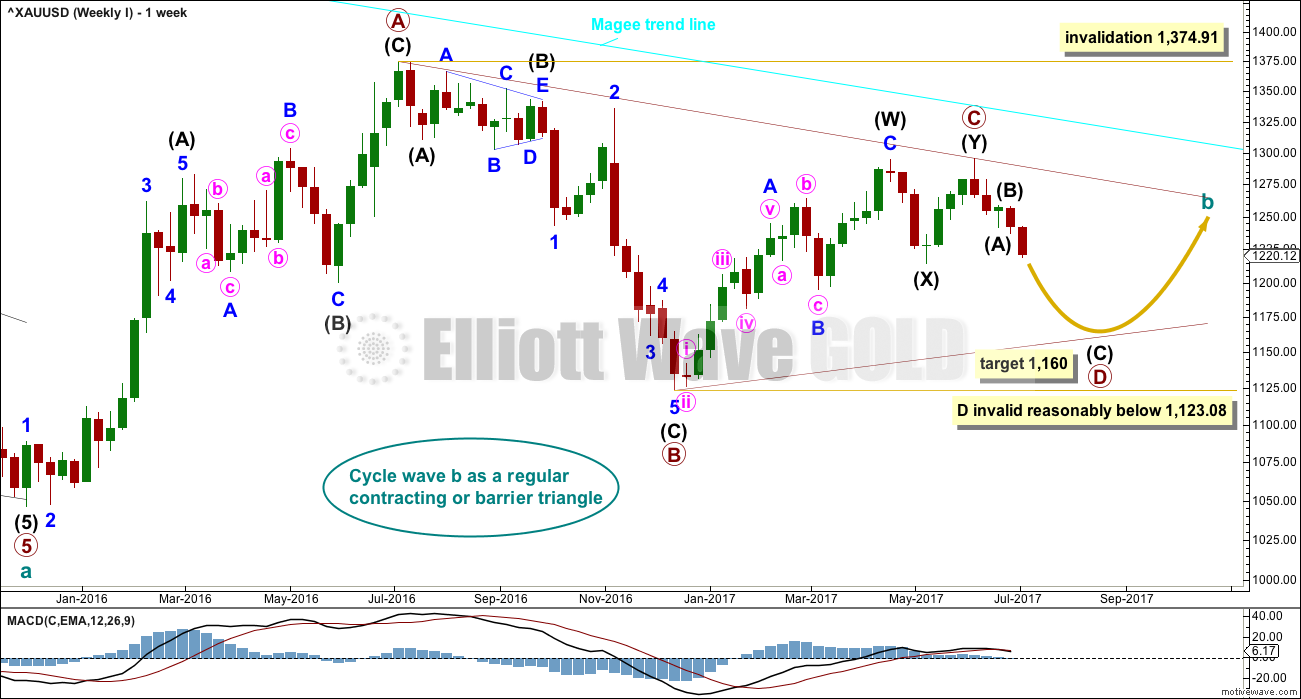
The Magee bear market trend line is added to the weekly charts. This cyan line is drawn from the all time high for Gold on the 6th of September, 2011, to the first major swing high within the following bear market on the 5th of October, 2012. This line should provide strong resistance.
At this stage, a triangle still looks most likely and has the best fit for cycle wave b.
Within a triangle, one sub-wave should be a more complicated multiple, which may be primary wave C. Primary wave C may not move beyond the end of primary wave A above 1,374.91. This invalidation point is black and white.
At this stage, it looks like primary wave C is now complete at the hourly and daily chart level. However, at the weekly chart level, it looks possible it may continue higher. This possibility must be acknowledged while price remains above 1,214.81. Within intermediate wave (Y), minor wave B may not move beyond the start of minor wave A.
Primary wave D of a contracting triangle may not move beyond the end of primary wave B below 1,123.08. Contracting triangles are the most common variety.
Primary wave D of a barrier triangle should end about the same level as primary wave B at 1,123.08, so that the B-D trend line remains essentially flat. This involves some subjectivity; price may move slightly below 1,123.08 and the triangle wave count may remain valid. This is the only Elliott wave rule which is not black and white.
There are three alternate wave counts that have been published in the last historic analysis, which is linked to above. They are all very bullish. They will only be published on a daily basis if price shows them to be true with a new high now above 1,295.65.
DAILY CHART
Click chart to enlarge.
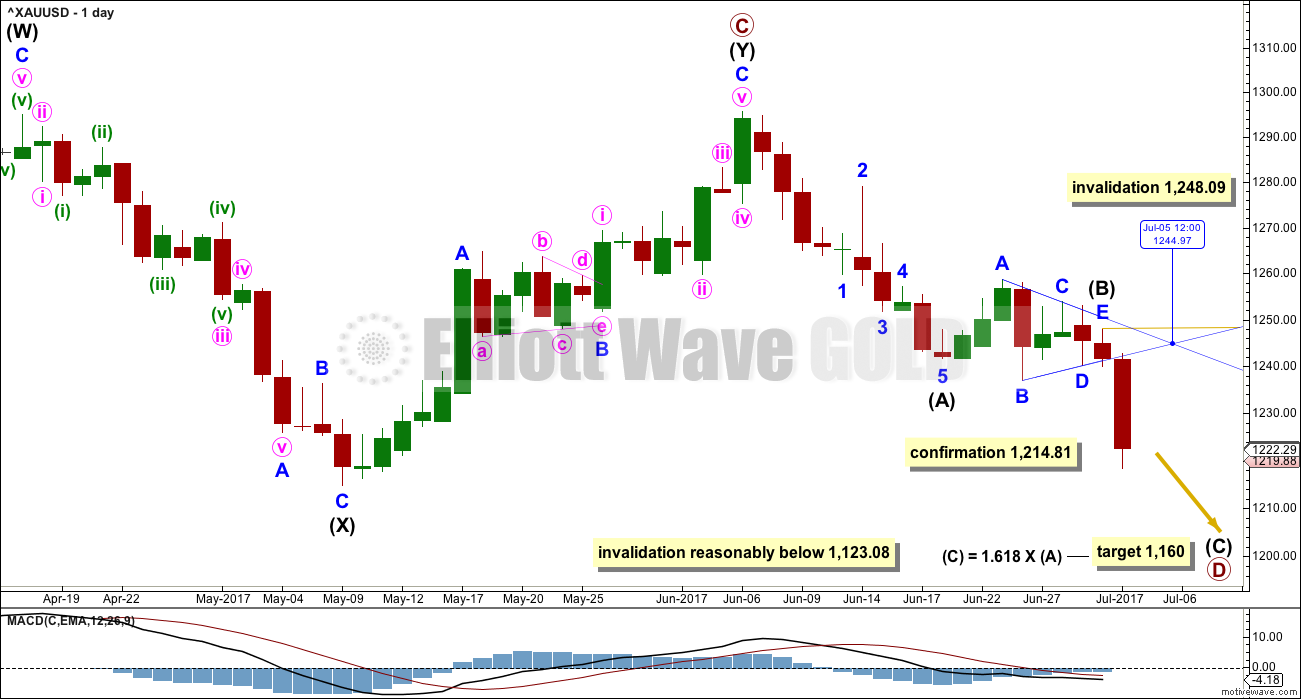
Intermediate wave (Y) may now be a complete zigzag if it is accepted that a triangle completed in the position labelled minor wave B. This has a perfect fit on the hourly chart.
A new low below 1,214.81 could not be minor wave B within intermediate wave (Y) and would provide strong confirmation that intermediate wave (Y) is over.
A common range for triangle sub-waves is from about 0.8 to 0.85 the prior sub-wave, this gives a range for primary wave D from 1,158 to 1,149. A Fibonacci ratio is used to calculate a target, which is just above this common range, for intermediate wave (C) now that intermediate waves (A) and (B) look to be complete.
The point in time when an Elliott wave triangle’s trend lines cross over often (not always) sees a trend change. That point in time is for the 5th of July for this triangle. This trend change is not always a large one; it may be a smaller change within a consolidation.
If primary wave C is correctly labelled as a double zigzag, then primary wave D must be a simple A-B-C structure and would most likely be a zigzag. Within intermediate wave (C), no second wave correction may move beyond the start of its first wave above 1,239.98.
Intermediate wave (A) lasted only ten days. Intermediate wave (B) has lasted eight days. As intermediate wave (C) is expected to be longer in length than intermediate wave (A), it may also be longer in duration and may last a Fibonacci thirteen days as the first expectation or a Fibonacci twenty one days as the next expectation.
Primary wave A lasted 31 weeks, primary wave B lasted 23 weeks, and primary wave C may have been complete in 25 weeks.
Primary wave D should be expected to last at least 8 weeks (but most likely longer). The next Fibonacci ratio in the sequence would be a Fibonacci 13 and then 21.
HOURLY CHART – INTERMEDIATE (B) TRIANGLE
Click chart to enlarge.
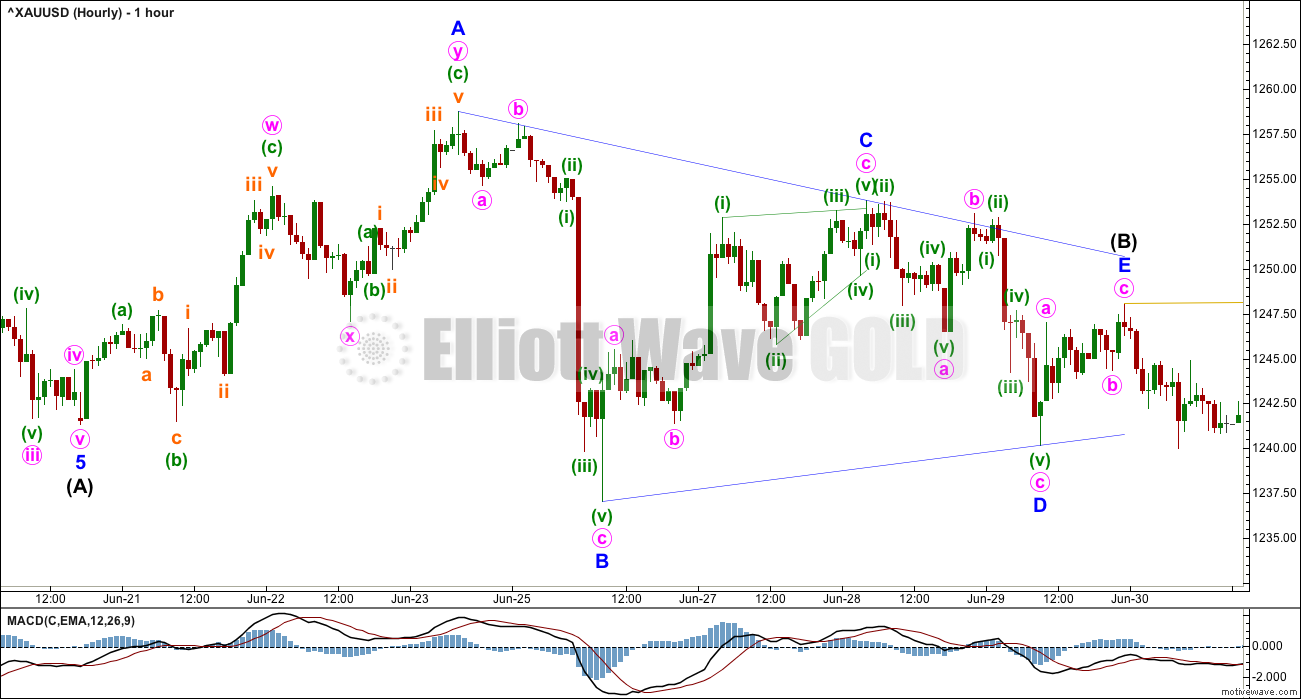
This first hourly chart shows the whole structure of intermediate wave (B). This is a neat running contracting triangle with minor wave A as a double zigzag and all other sub-waves as single zigzags.
The triangle adheres well to its trend lines. There are a couple of very small overshoots within minor wave D, but not breaches. Minor wave E fell well short of the A-C trend line, the most common point for an E wave of a triangle to end.
The only thing that looks a little atypical here is that after minor wave E ended price did not move immediately strongly out of the triangle.
HOURLY CHART
Click chart to enlarge.
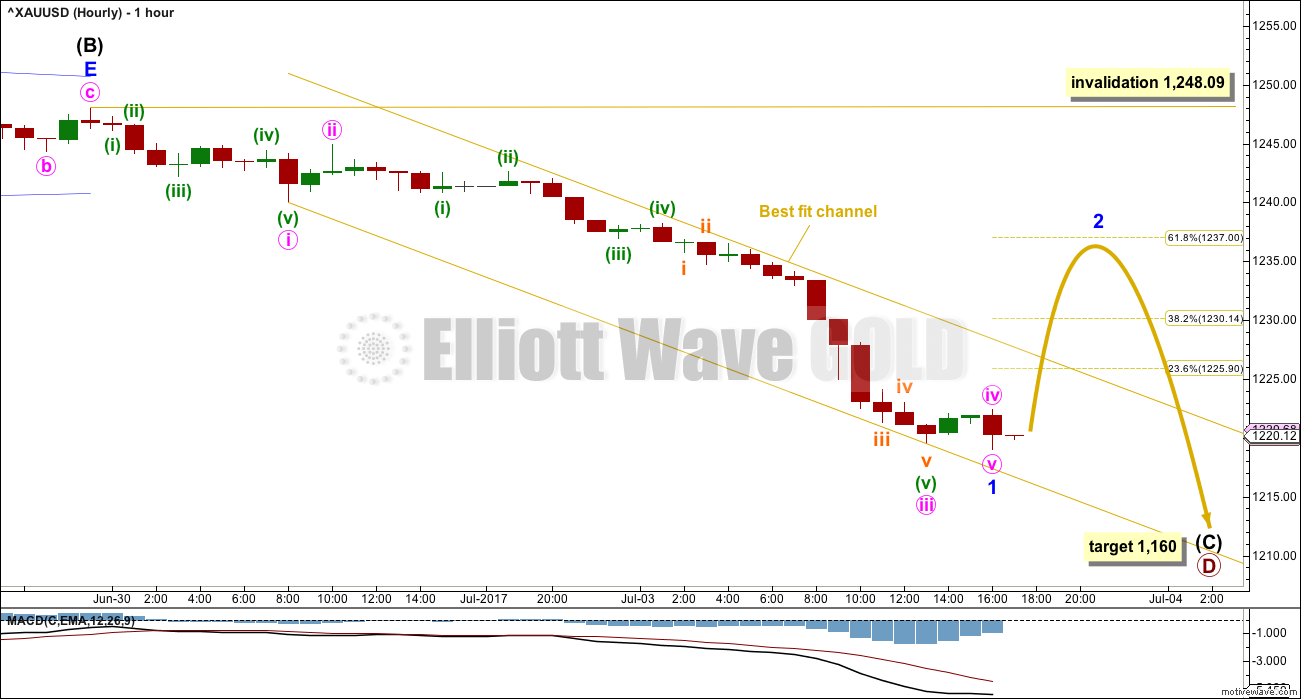
This hourly chart shows all of intermediate wave (C) so far.
Intermediate wave (C) must subdivide as a five wave motive structure, either an impulse (much more likely) or an ending diagonal. Let us assume the more likely structure until proven otherwise.
So far a five wave structure downwards may be complete here or very soon for minor wave 1. Minor wave 2 may correct to either the 0.382 or 0.618 Fibonacci ratios of minor wave 1. The 0.618 Fibonacci ratio is slightly more likely. This may be a typical curve back up to retest resistance at prior support after the breakout.
If minor wave 1 continues a little lower, then redraw the Fibonacci retracement along its length and adjust the target for minor wave 2 accordingly.
The best fit channel may be used to manage short positions. Either exit short positions now, or wait for the channel to be breached by upwards movement. It is entirely possible that my labelling of minor wave 1 as complete is wrong; it may continue lower, but it is very likely to end within the next 24 hours. Waiting for the channel breach would provide confidence that minor wave 1 is over and minor wave 2 has begun.
For any members who did not enter short after price broke below 1,237.06, exert some patience and wait for the end of minor wave 2. That may provide a good entry point for a short position to hold for at least a week or maybe up to three weeks.
Minor wave 2 may not move beyond the start of minor wave 1 above 1,248.09.
The trend is down. All trades should be with the trend. Always use a stop. Invest only 1-5% of equity on any one trade. Only add to existing positions when those existing positions have stops at breakeven or have some profit protected.
TECHNICAL ANALYSIS
WEEKLY CHART
Click chart to enlarge. Chart courtesy of StockCharts.com.
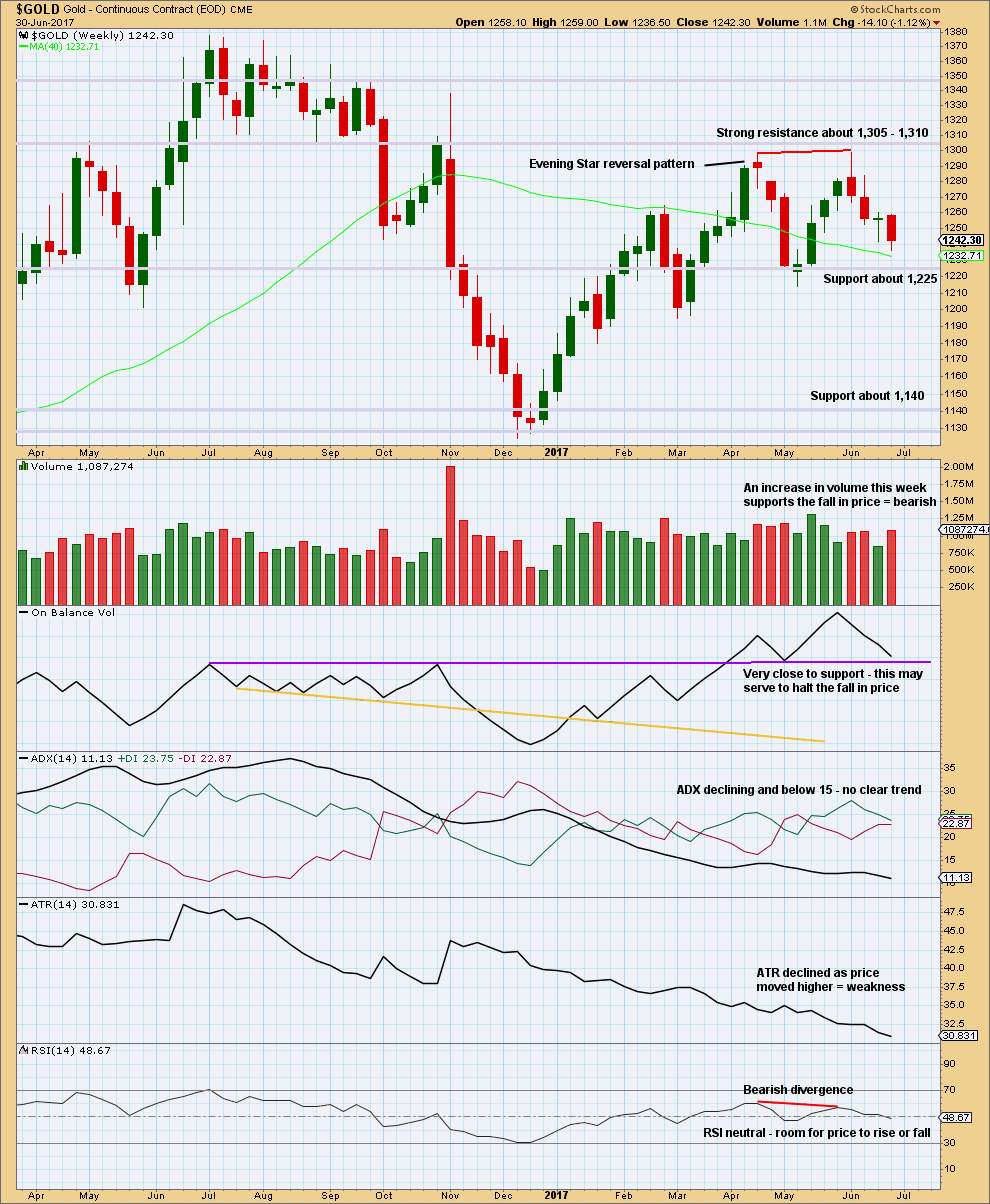
Volume last week supports the downwards trend at least short term.
If On Balance Volume breaks below the purple support line, it would offer a bearish signal. If it bounces up from this line, it would offer a bullish signal.
Declining ATR for a long time fits neatly with the expectation of a large triangle unfolding.
DAILY CHART
Click chart to enlarge. Chart courtesy of StockCharts.com.
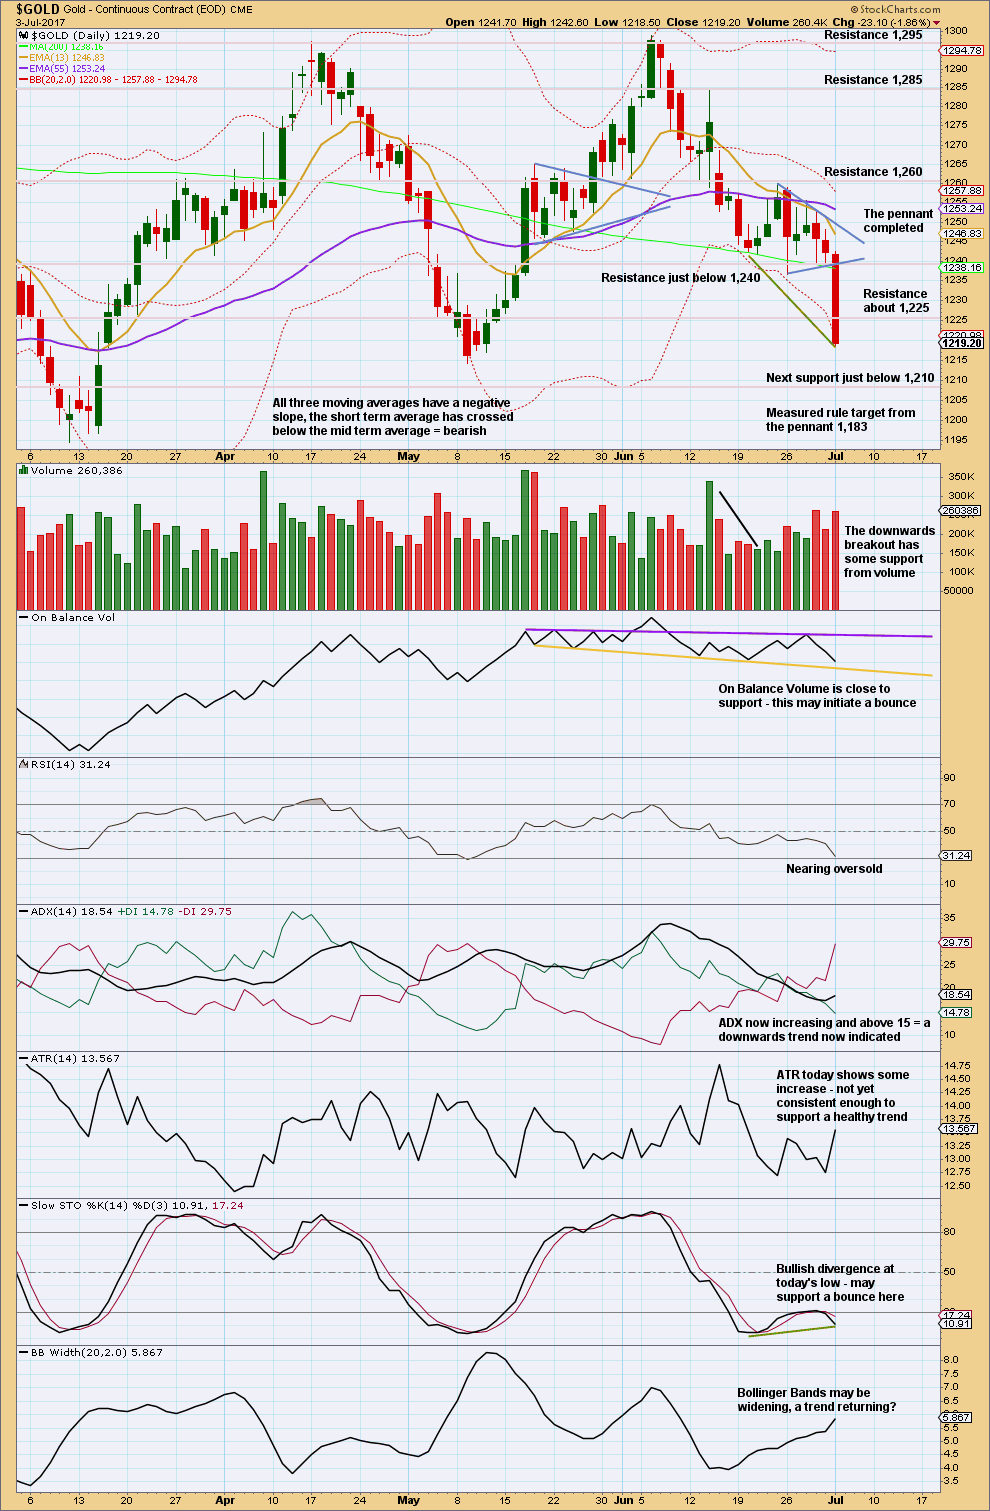
The pennant has been completed and is followed by a downwards breakout that has support from volume. Have confidence in the downwards trend at this time.
Pennants are reliable continuation patterns. I want to draw members attention to a prior pennant on this chart from the 18th to 26th of May: price broke out upwards as expected from that pennant on the 26th of May. After the breakout price curved around effecting another small consolidation that found its low four days later. This low was very close to the upper edge of the pennant pattern. This was a typical curve around to retest support at prior resistance.
Expect it is fairly likely (but not certain) that price may do the same again here and now, in reverse. Look out now for a curve back up and sideways to retest resistance at prior support. That resistance may now be about 1,235 – 1,240. This fits neatly with the Elliott wave expectation for minor wave 2 to bounce up to about 1,237.
If price behaves in this typical fashion, it would provide a high confidence entry point for a short position that may be held for weeks. Some patience is required to wait for the set up.
Stochastics and On Balance Volume support this view.
GDX
DAILY CHART
Click chart to enlarge. Chart courtesy of StockCharts.com.
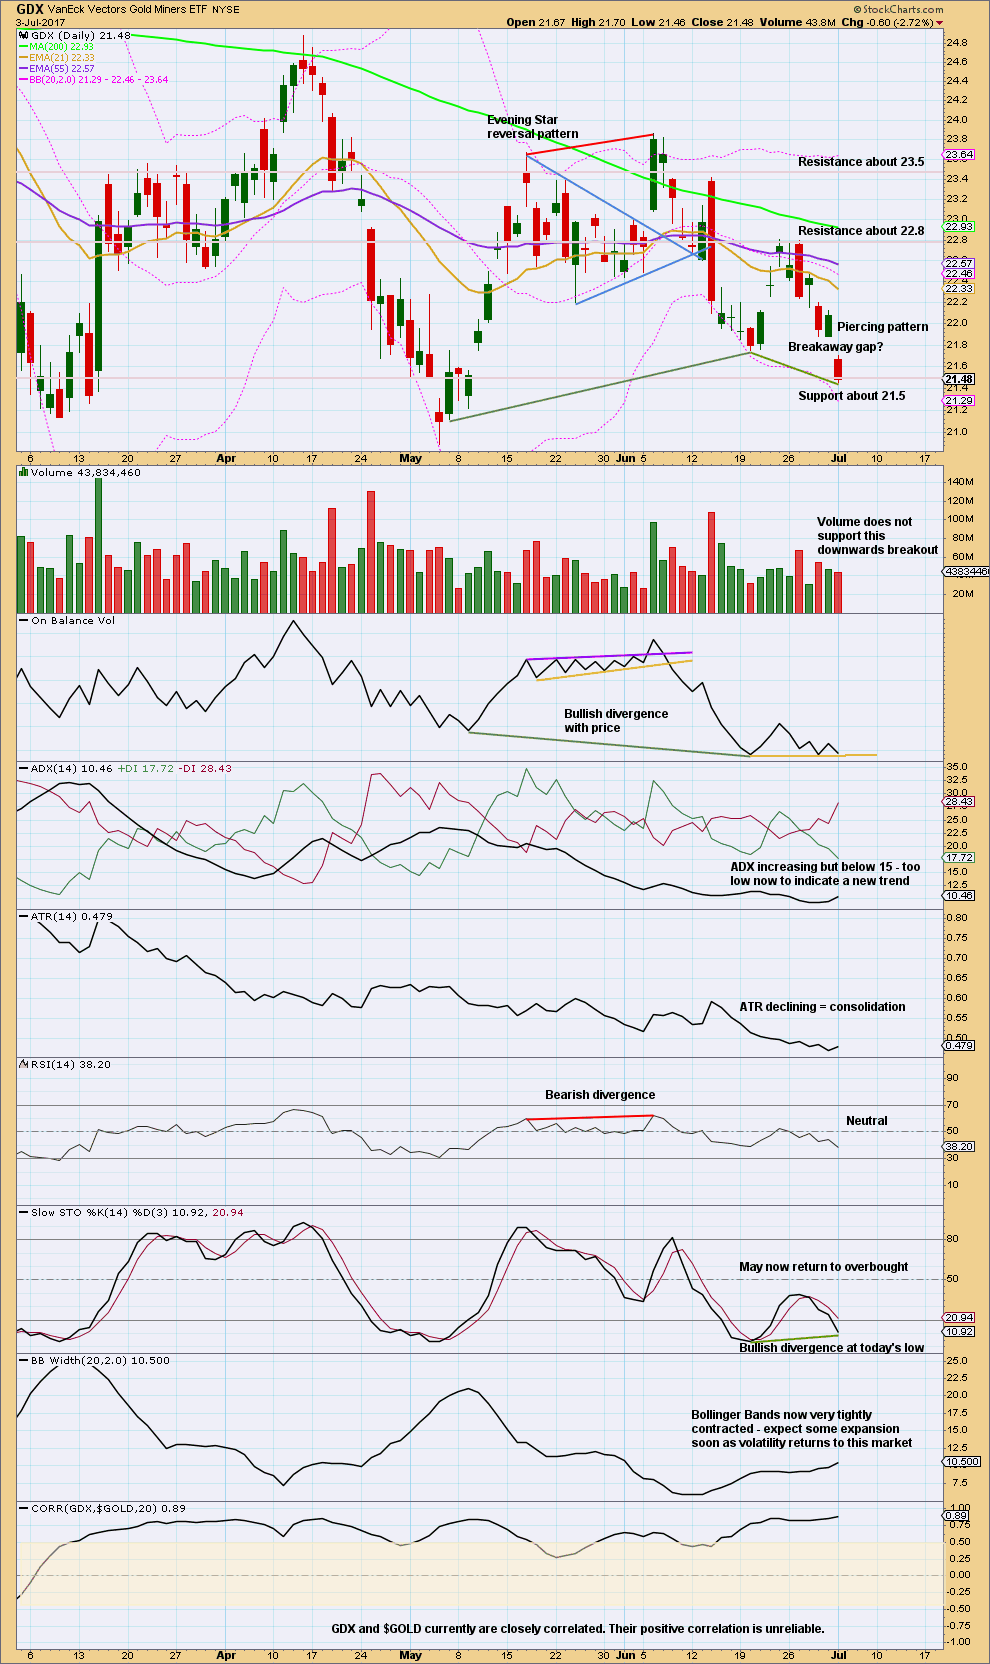
Price has broken out downwards from the consolidation, but the breakout is suspicious because it is not supported by volume. But we must keep in mind that not all downwards breakouts are supported by volume though; the market can fall of its own weight.
If the gap today is correctly labelled as a breakaway gap, then the upper edge should offer resistance. Breakaway gaps are not usually closed. This resistance is at 21.88.
Look out for a curve up now to retest resistance at prior support.
A new support line is added today to On Balance Volume. This along with divergence with Stochastics and price supports the idea of a curve up from here.
This analysis is published @ 07:13 p.m. EST.
Ichimoku Gold Analysis
Data as at market close, July 3
=========================
With the breach of the key short-term brown support uptrend line on Monday, we would need to step back to a longer timeframe to glean the overall picture.
Gold has stayed below the bearish resistance downtrend line (drawn in purple). This line was drawn from the June 6 high at 1295.65. As long as price is below this trendline, the bearish movement could be expected to continue. I would expect that this week would see a retest of the brown uptrend support line, now turned resistance, for a final farewell “kiss”. Following this, prices should continue to drop in the now established bearish downtrend. The extent of this drop can be monitored using a longer term trendline (pink), which is drawn using the two prior lows, 1046.27 and 1123.08. I believe that it is extremely unlikely that this trendline can be breached.
Continued drops in gold prices would next test the May 9 key support at 1214.81. A breakdown below this level will confirm that the uptrend from the December 15 low of 1123.08 have already completed at the June 6 high of 1295.65, and that the ongoing bearish movement would bring price into the 1165 zone, where the pink support uptrend line resides. This should happen with greater momentum as prices would then fall below the lowest portions of the red cloud, giving bears the all-clear.
The Weekly Ichimoku Chart shows that gold prices had dropped below both the tenkan-sen and the kijun-sen, as well as the bottom cloud boundary. The cloud is turning red, and Ichimoku predicts that it will remain so for a long time to come. A strongly bearish downtrend is hence confirmed. All that remains is a feeble attempt by the bulls to break above the brown uptrend support line. That would certainly be a tall order, because they have to surmount a barrage of major obstacles, respectively the 200 day SMA at 1232.60, and the lower cloud boundary at 1235.50. If it can succeed (which I highly doubt), then there are the 50 day SMA at 1251.17 and the upper cloud resistance at 1256.55 to contend with.
My money is on a backtest of the brown uptrend line, using the 200 day SMA and the lower cloud boundary as markers, my entry point for a short trade. Shorting will be indeed rewarding as there would be roughly a $70 drop. Having exited DUST at 33.60 last night from a low of 30.93 bought last Friday, I am raring to go once again.
May I take this opportunity to wish folks who are celebrating America’s independence today a happy holiday.
Thank you very much Alan for adding this TA for Gold.
I agree, the breach of that brown trend line is very significant. That’s a strong bearish signal.
Copper update:
It looks like copper has a high in place. That trend line is still providing strong resistance. I’ve drawn it from the start of FXCM’s copper data on 1st September, 2011, to 30th January, 2013. On a semi-log scale. It’s been tested multiple times now and so far looks like it’s still holding so this should be a good short entry.
The next wave down may be a third wave folks.
Stops just above the last high of 30th June. Invest only 1-5% of equity on this one trade.
Thanks Lara for keeping copper in your analysis 🙂
My apologies everybody for not updating Oil today. TBH it would be a copy and paste from last week. Upwards movement is nearing the 0.618 Fibonacci ratio, look out for it to end soon.
Here’s a chart before I do a full update tomorrow.
Most unfortunately this bounce doesn’t fit neatly into a trend channel. So it’s going to be a few days after the high before we can have a channel breach = confidence in a trend change.
There are a couple of ways around that, but they involve more risk. I don’t like picking highs.
If price gets up to the 0.618 Fibonacci ratio you could take a punt on the short side there. Stops technically should be just above the invalidation point. Because of higher risk only invest 1-2% here. Leave some power dry.
We could use a steeper trend line along the last upwards bit and wait for that to be breached. But the steeper a trend line the less technical significance it has. Again, only 1-2% of equity there is recommended, stops should be just above the invalidation point.
I’m waiting for another few days for Oil to see what happens.
Update on NZDUSD:
Maybe another shot at entering short for this one now. Stops just above the last high please. Invest only 1-5% of equity on any one trade.
Look out now for a curve up to retest resistance at prior support now the channel has been breached. So if entering here be prepared to have an underwater position for a few days.
I’m jumping in anyhow now. I don’t mind having an underwater position. I’m planning on holding this for weeks.
oops, hadn’t updated the target for minor 3. it should be 0.62658.
this target is conservative. it may reach below this point.
Today appears to be a recognition day for Gold and the Miners. Gold had it’s biggest down day in some time, and GDX gapped down below the weekly 200MA as well as the weekly Ichimoku Cloud.
Furthermore, GDX may have exited the triangle to the downside that has been forming over the last year. I think it’s time to put the bullish counts in hibernation until proven otherwise.
Zooming out to the weekly level, this count may match up well with Lara’s main Gold count. It’s very similar, although GDX appears to be exiting the triangle sooner. This may make sense as the miners often lead. Time will tell. If this count proves itself a little more, I’ll update a daily chart and maybe an hourly one. Hourly charts are very challenging with GDX as 3’s and 5’s are often interchangeable.
https://www.tradingview.com/x/vAuBreFx/
Thank you very much Dreamer for sharing your EW counts for GDX. I know it’s greatly appreciated by many here.
Thank you Dreamer for your chart. Thanks for sharing your knowledge with all of us….
With this bearish count…. after green c wave is completed, then (a) green is completed as well? and we go up for green (b)?
thanks…..
Exactly. Cycle c (green) should take one to several years though, so going up after it’s done is far away.
thank you for your response…..
The way GLD took out its 200 day SMA today was quite precipitous. It looked a lot like some sort of capitulation downside move. At some point I think we are going to see a similar gap back above the line. Hopefully we hit the downside target area with all due haste! 🙂