
Last analysis expected a downwards breakout below support at 16.05 – 15.70. This happened on the 7th of July.
Summary: Expect a new low. The Elliott wave target is at 15.17. Thereafter, expect a trend change and an upwards wave that should last weeks.
New updates to this analysis are in bold.
Last monthly chart is here.
ELLIOTT WAVE COUNTS
FIRST WAVE COUNT
WEEKLY CHART
Click chart to enlarge.
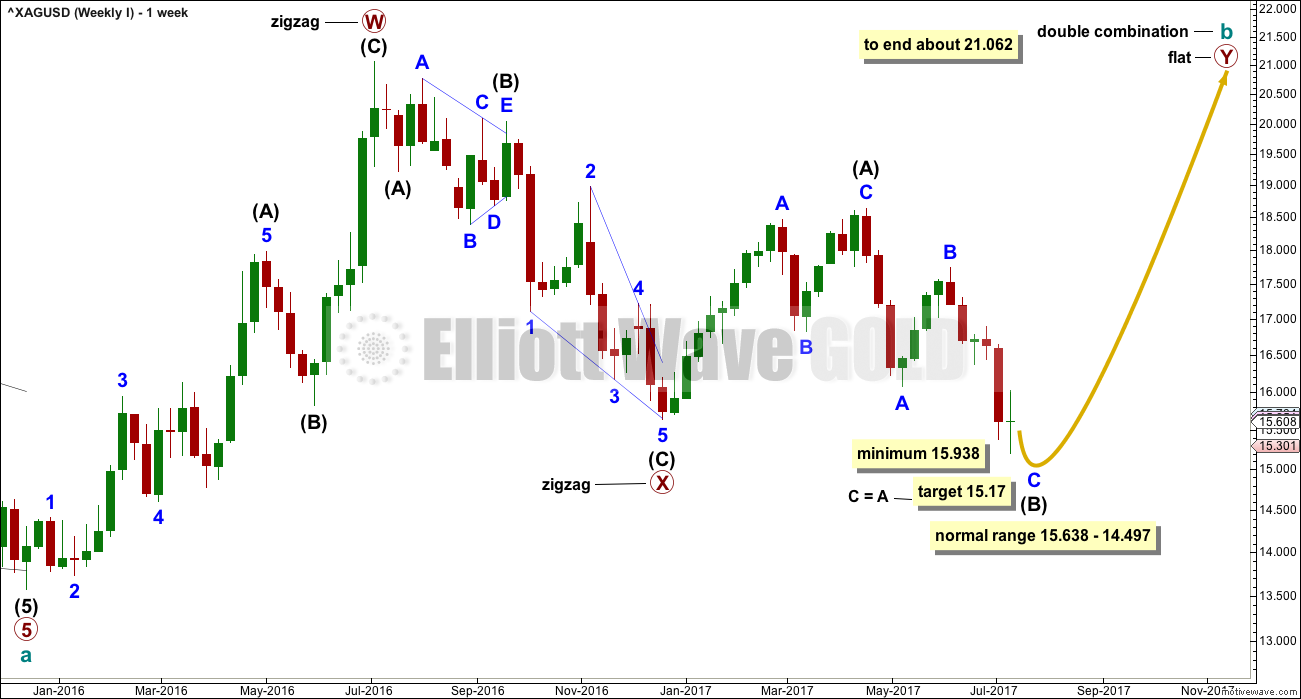
Cycle wave b may be completing as a double combination: zigzag – X – flat. The second structure, a flat correction for primary wave Y, may be underway.
Within a flat correction, intermediate wave (B) must retrace a minimum 0.9 length of intermediate wave (A) at 15.938. The common range for intermediate wave (B) is from 1 to 1.38 the length of intermediate wave (A). The target calculated would see intermediate wave (B) reach to within the common range and pass its minimum requirement. If minor wave B moves any higher, then the target for intermediate wave (B) must also move correspondingly higher.
Intermediate wave (B) may make a new price extreme beyond the start of intermediate wave (A), as in an expanded flat, which are very common structures.
The bigger picture for cycle wave b would expect primary wave Y to end about the same level as primary wave W about 21.062. The purpose of combinations is to take up time and move price sideways. To achieve this purpose the second structure in the double normally ends about the same level as the first.
The maximum number of corrective structures is three within combinations (and multiple zigzags). This maximum applies to sub-waves W, Y and Z. Within these structures, they may only be labelled as simple A-B-C corrections (or A-B-C-D-E in the case of triangles). They may not themselves be labeled multiples as that would increase the number of corrections within the structure beyond three and violate the rule.
X waves are joining structures and they are not counted in the maximum total of three (otherwise the maximum would be five). X waves may be any corrective structure, including multiples.
While the combination wave count at the weekly chart level does not currently work for Gold, it does still work for Silver. They do not have to complete the same structures for cycle wave b, and fairly often their structures are different.
DAILY CHART
Click chart to enlarge.
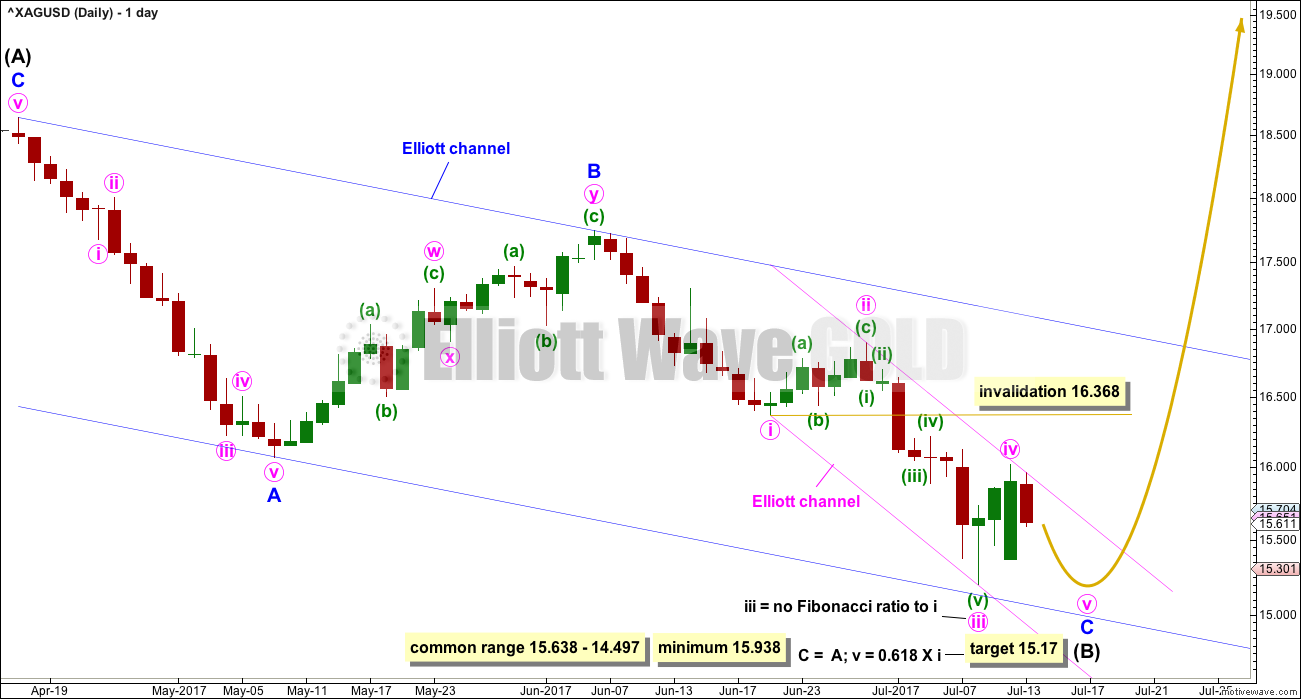
Minor wave C must complete as a five wave motive structure. It looks like an almost complete impulse, the most likely structure.
The target calculated is exactly the same at two wave degrees. It should have a reasonable probability.
Minute wave iv perfectly found resistance at the upper edge of the Elliott channel. After a new low, if price turns up and breaches the upper edge of the channel, then it shall offer confirmation that the downwards wave of minor wave C is over and the next wave up should then be underway.
Minute wave iv may not move back up into minute wave i price territory above 16.368.
SECOND WAVE COUNT
WEEKLY CHART
Click chart to enlarge.
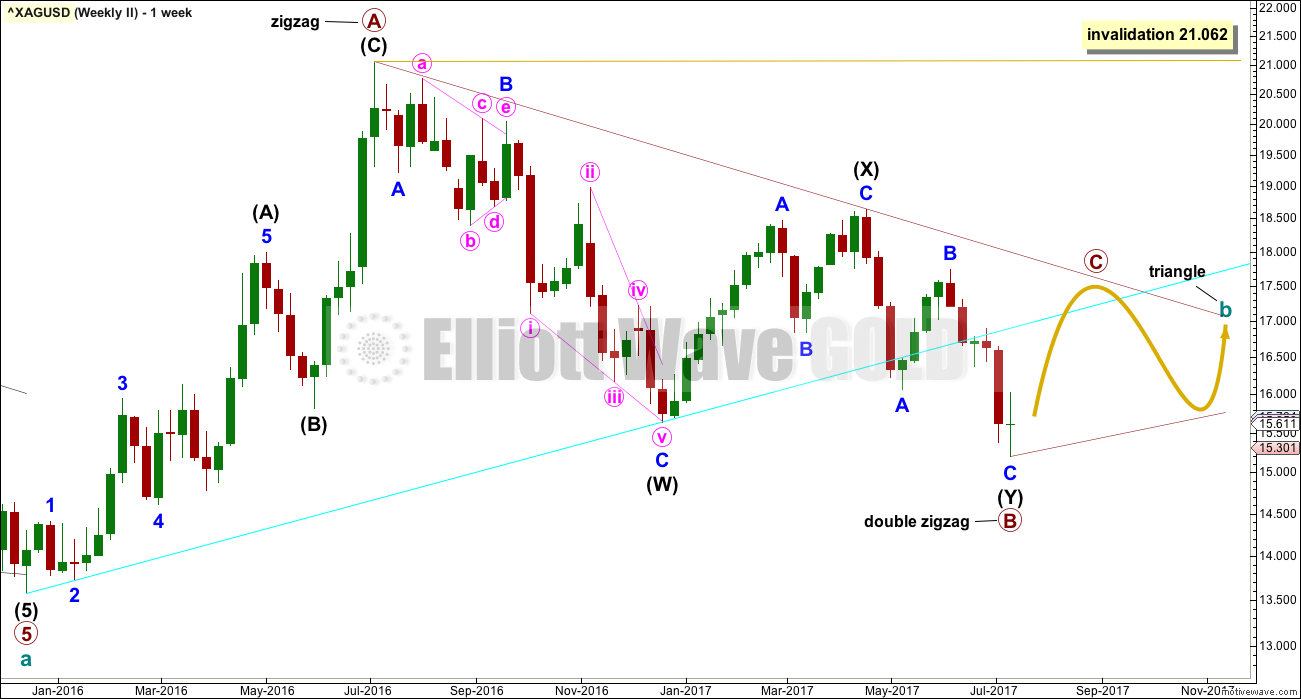
This wave count is changed substantially after last labelling was invalidated.
A material change comes from seeing the downwards wave labelled intermediate wave (W) as a single zigzag. In last analysis this wave was seen as a double zigzag. If minor wave C is seen as an ending contracting diagonal, then this wave fits perfectly as a single zigzag.
Within a triangle, one of the sub-waves must be a more complicated multiple, usually a multiple zigzag. This may be almost complete for primary wave B.
When primary wave B is over, then primary wave C upwards should unfold as a single zigzag that may not move beyond the end of primary wave A above 21.062. The A-C trend line may be drawn across prior highs; primary wave C may end here.
A triangle is still possible for cycle wave b. It may come to a relatively quick end if the A-C trend line is drawn here correctly.
DAILY CHART
Click chart to enlarge.
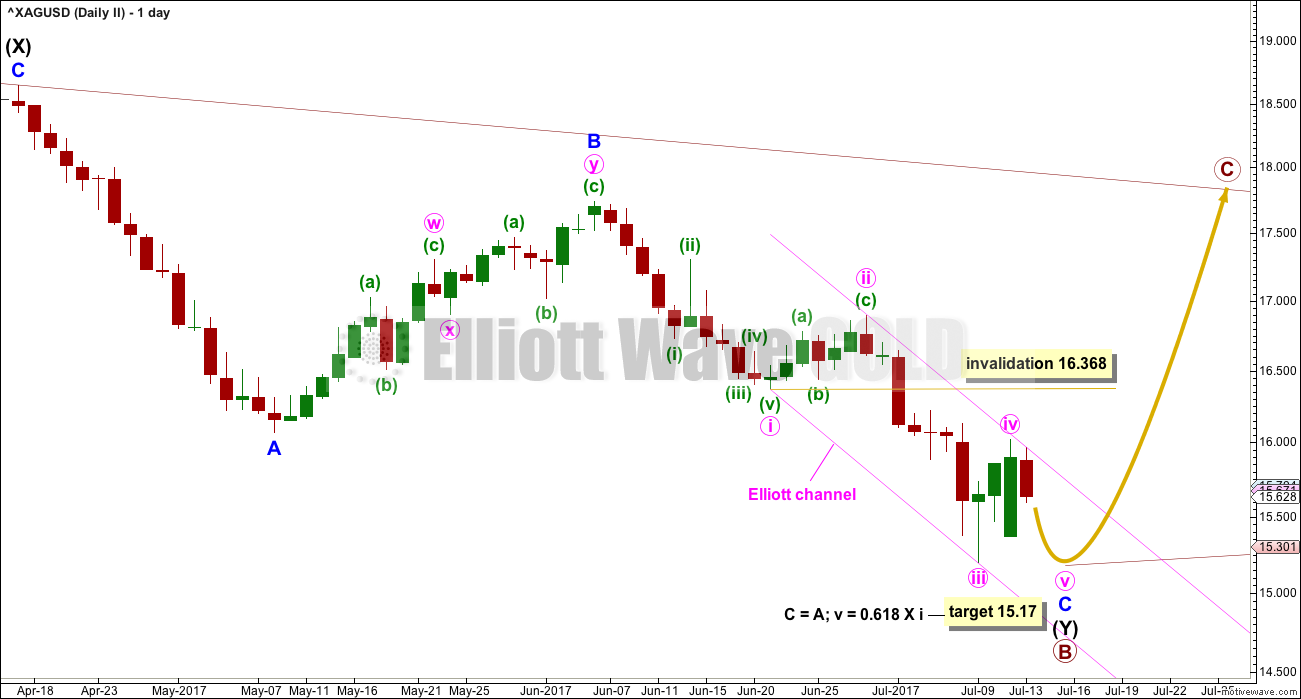
Both wave counts see a five wave structure downwards ending shortly for minor wave C. The targets are the same.
Both wave counts expect a reversal soon.
This wave count expects a shorter upwards wave to follow than the first wave count.
TECHNICAL ANALYSIS
WEEKLY CHART
Click chart to enlarge. Chart courtesy of StockCharts.com.
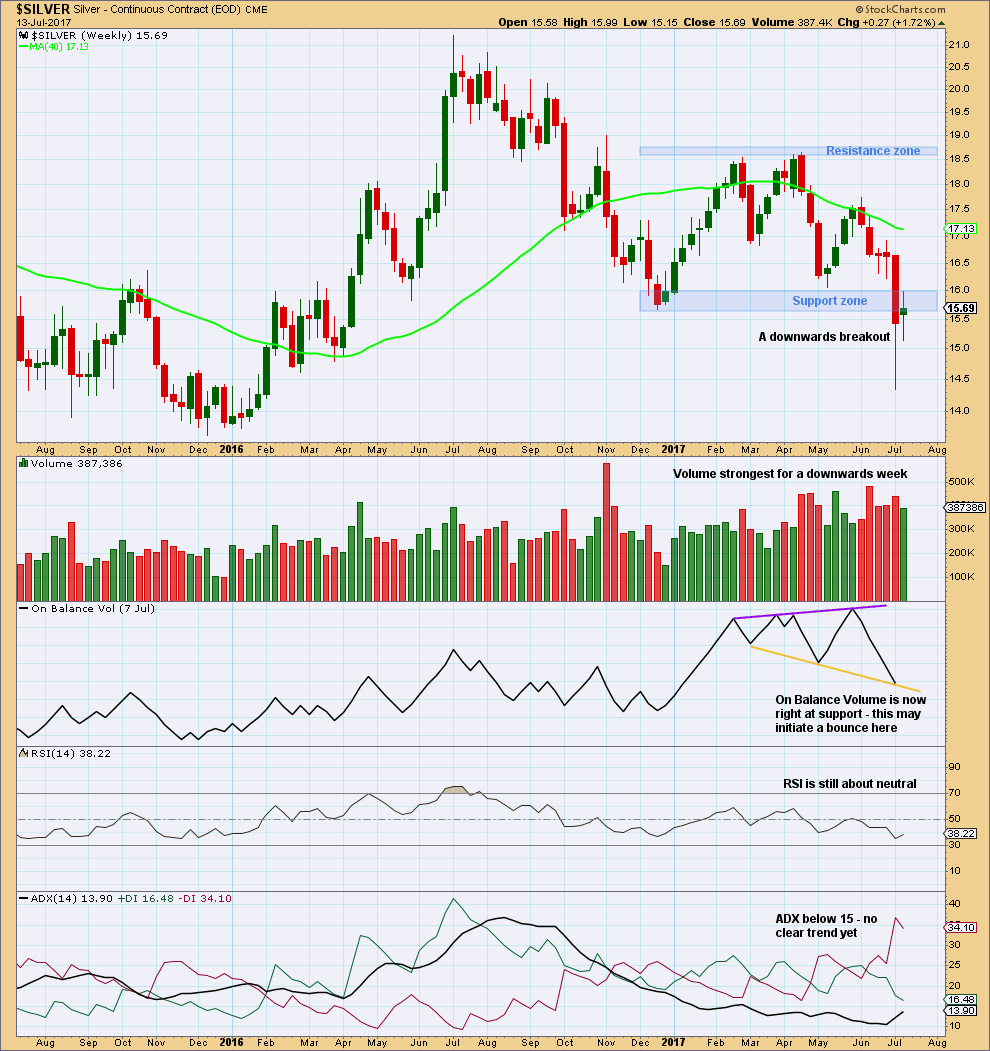
The very long lower wick of the last complete red weekly candlestick is bullish. This is now being followed by a bounce and price is now finding resistance at the upper edge of the prior support zone.
On Balance Volume strongly suggests downwards movement is very limited here. This supports the target on the Elliott wave counts.
DAILY CHART
Click chart to enlarge. Chart courtesy of StockCharts.com.
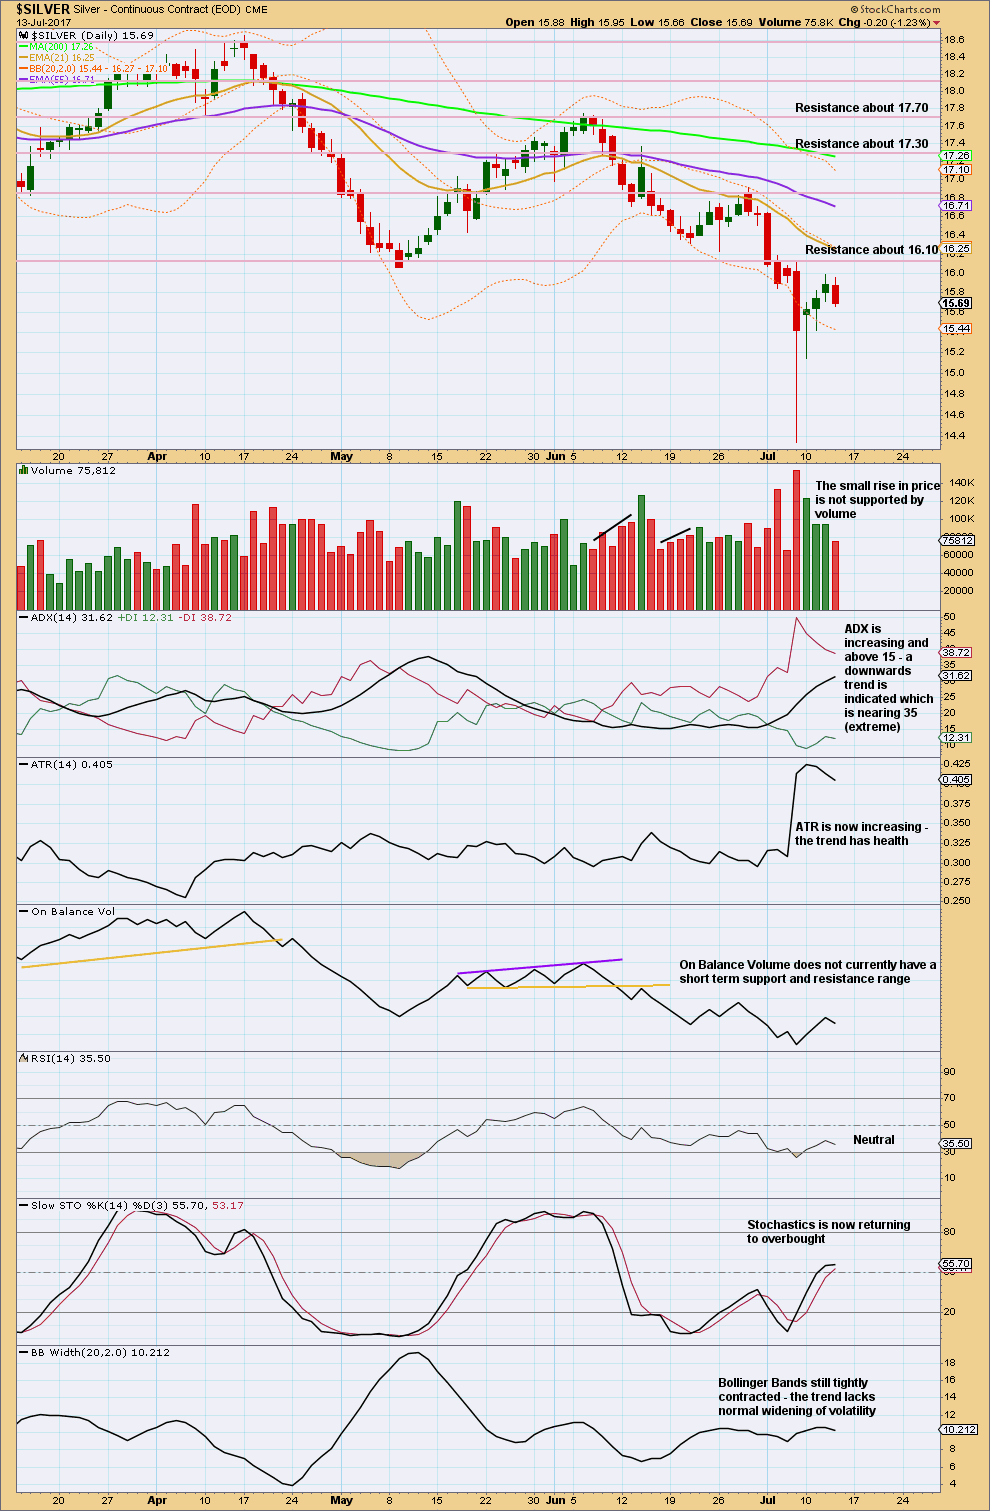
If this small bounce continues, expect resistance at 16.10.
Volume suggests more downwards movement. If price does make new lows, look for any divergence between price and RSI. If there is divergence, then expect a trend change. RSI reached oversold at the last low. When it does that and then exhibits subsequent divergence with price, it offers a fairly reliable indication of the end of downwards movement. This does not always work, but it does work more often than not.
This analysis is published @ 11:41 p.m. EST.
Sure looks like the low is in and that $15.17 is not materializing? Could be a nice bull run up from here?
awesome commentary and accuracy Lara!!! Thank you.
You’re most welcome Robert 🙂