
Price was expected to fall for Friday, but it moved slightly higher.
Summary: A pullback may end on Monday or Tuesday about 1,275. If this is how price behaves, it may offer us an entry opportunity to join the upwards trend. The final target is now at 1,320.
Always use a stop. Invest only 1-5% of equity on any one trade.
New updates to this analysis are in bold.
Last monthly charts and alternate weekly charts are here, video is here.
Grand SuperCycle analysis is here.
MAIN ELLIOTT WAVE COUNT
WEEKLY CHART
Click chart to enlarge.
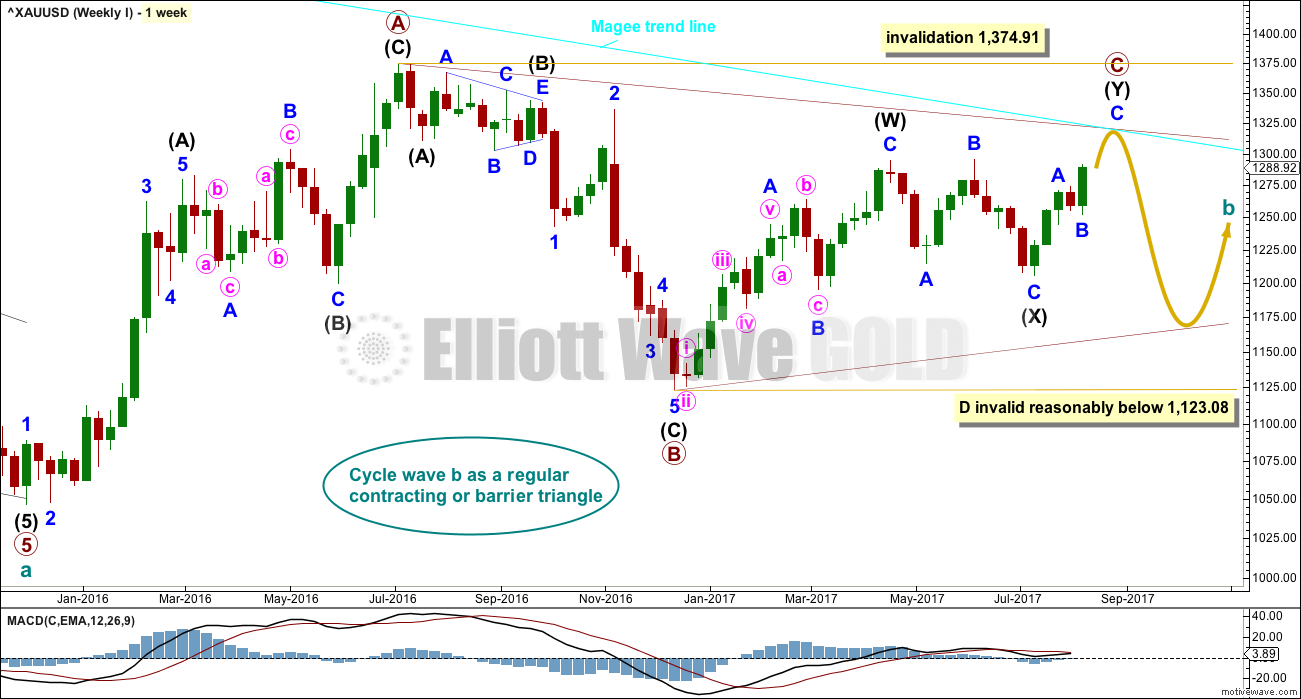
The Magee bear market trend line is added to the weekly charts. This cyan line is drawn from the all time high for Gold on the 6th of September, 2011, to the first major swing high within the following bear market on the 5th of October, 2012. This line should provide strong resistance.
At this stage, a triangle still looks possible and has the best fit for cycle wave b. It has some support from declining ATR and MACD now beginning to hover about zero.
Within a triangle, one sub-wave should be a more complicated multiple, which may be primary wave C. This is the most common sub-wave of the triangle to subdivide into a multiple.
Intermediate wave (Y) now looks like a developing zigzag at the weekly chart level, and minor wave B within it shows up with one red weekly candlestick. Primary wave C may end at the Magee trend line.
Primary wave D of a contracting triangle may not move beyond the end of primary wave B below 1,123.08. Contracting triangles are the most common variety.
Primary wave D of a barrier triangle should end about the same level as primary wave B at 1,123.08, so that the B-D trend line remains essentially flat. This involves some subjectivity; price may move slightly below 1,123.08 and the triangle wave count may remain valid. This is the only Elliott wave rule which is not black and white.
Finally, primary wave E of a contracting or barrier triangle may not move beyond the end of primary wave C above 1,295.65. Primary wave E would most likely fall short of the A-C trend line. But if it does not end there, then it can slightly overshoot that trend line.
Primary wave A lasted 31 weeks, primary wave B lasted 23 weeks, and primary wave C may now have just completed its 34th week. A double zigzag may be expected to be longer lasting than single zigzags within a triangle, and so this continuation of primary wave C is entirely acceptable and leaves the wave count with the right look at this time frame.
DAILY CHART
Click chart to enlarge.
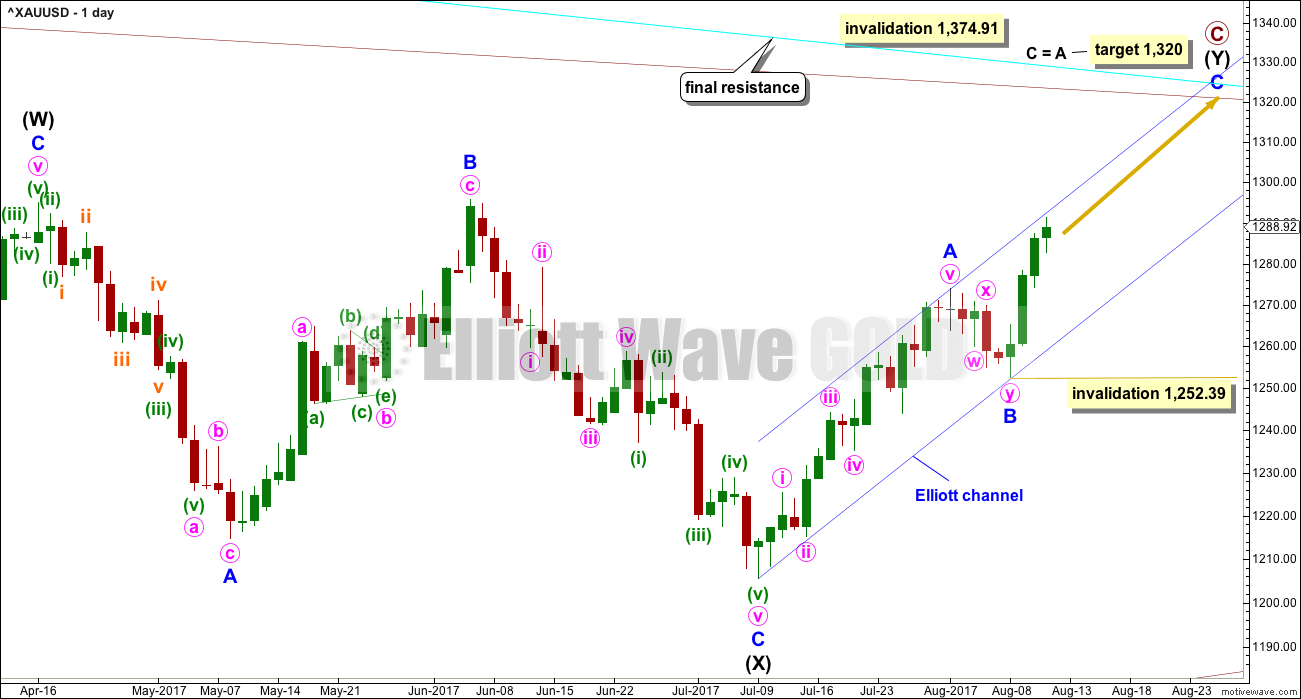
A target for primary wave C to end is calculated using the most common Fibonacci ratio between minor waves A and C. If the target is wrong, it may be too high; there is very strong resistance about 1,305 to 1,310.
Within minor wave C, no second wave correction may move beyond the start of its first wave below 1,252.39. Along the way up, corrections should find final support at the lower edge of the blue Elliott channel.
Minor wave C may only unfold as a five wave structure, either an impulse or an ending diagonal. An impulse is much more common and will be expected until shown otherwise by price.
Within an impulse for minor wave C, the corrections of minute waves ii and iv would most likely show up on the daily chart, like they do within minor wave A. Minute waves ii and iv within minor wave A both lasted two sessions, so they may also last about two to three sessions within minor wave C.
Minute wave ii may reasonably be expected to begin about here, with price at the upper edge of the Elliott channel providing resistance.
Minute wave ii may be used as an entry opportunity to join the current upwards trend.
HOURLY CHART
Click chart to enlarge.
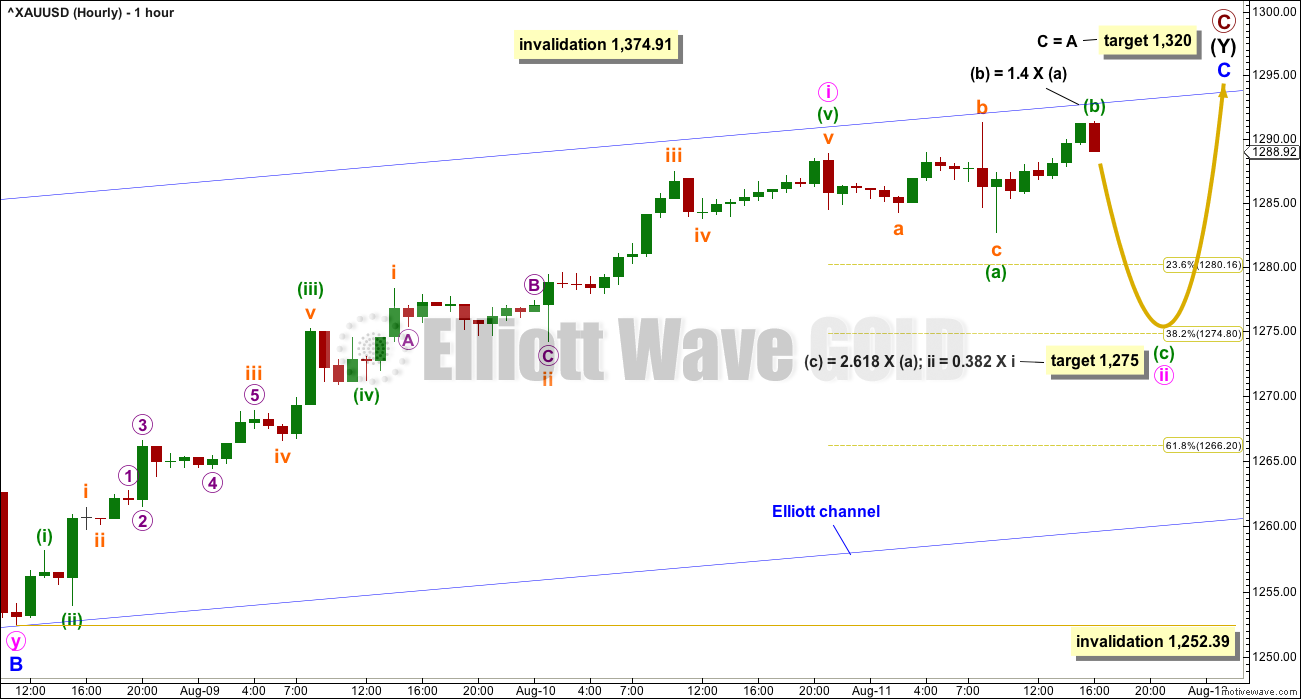
A channel drawn about minute wave i is now breached by sideways movement of Friday’s session. The upwards wave labelled minute wave i now looks like a separate wave to sideways movement labelled minute wave ii.
Minute wave ii may be unfolding as an expanded flat correction; these are very common structures. Minute wave ii may not move beyond the start of minute wave i below 1,252.39. But if it is deep, it should find very strong support above the invalidation point at the blue trend line.
A target is calculated for minute wave ii to end at two wave degrees.
ALTERNATE ELLIOTT WAVE COUNT
WEEKLY CHART
Click chart to enlarge.
This wave count has been published only in historical analysis. At this stage, it will be published on a daily basis.
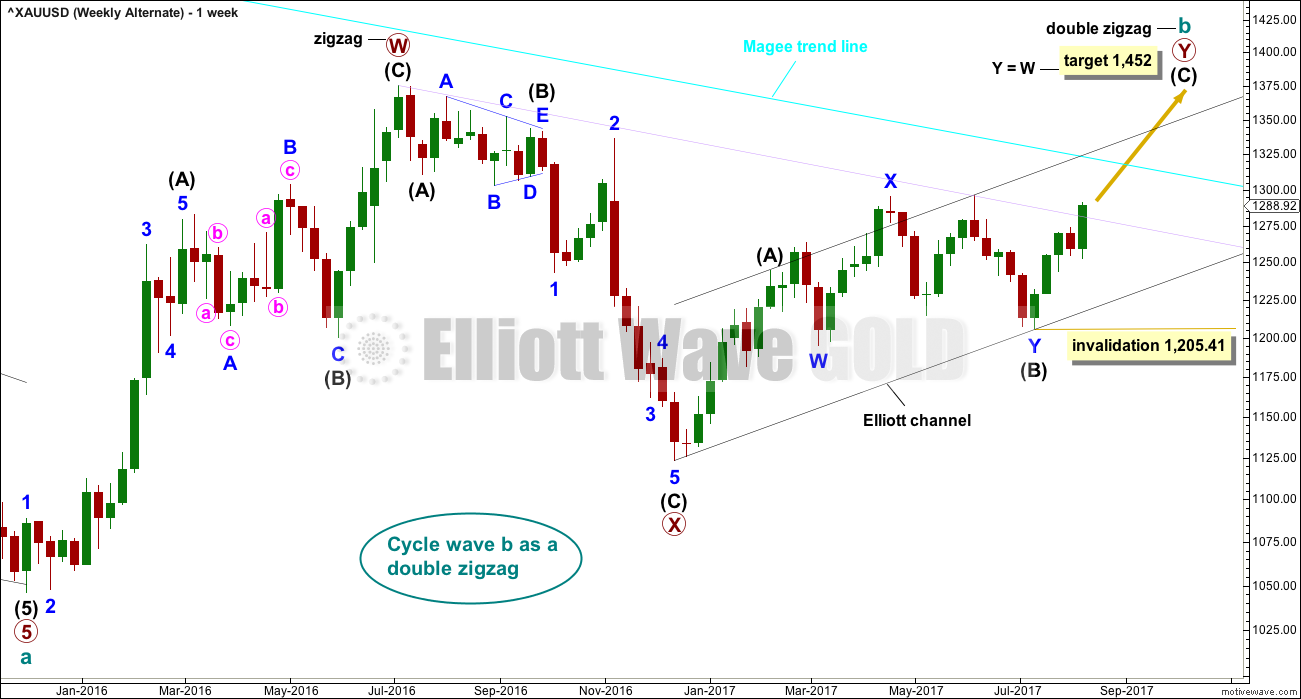
There are more than 23 possible corrective structures that B waves may take, and although cycle wave b fits best at this stage as a triangle (main wave count), it may still be another structure. This wave count looks at the possibility that it may be a double zigzag.
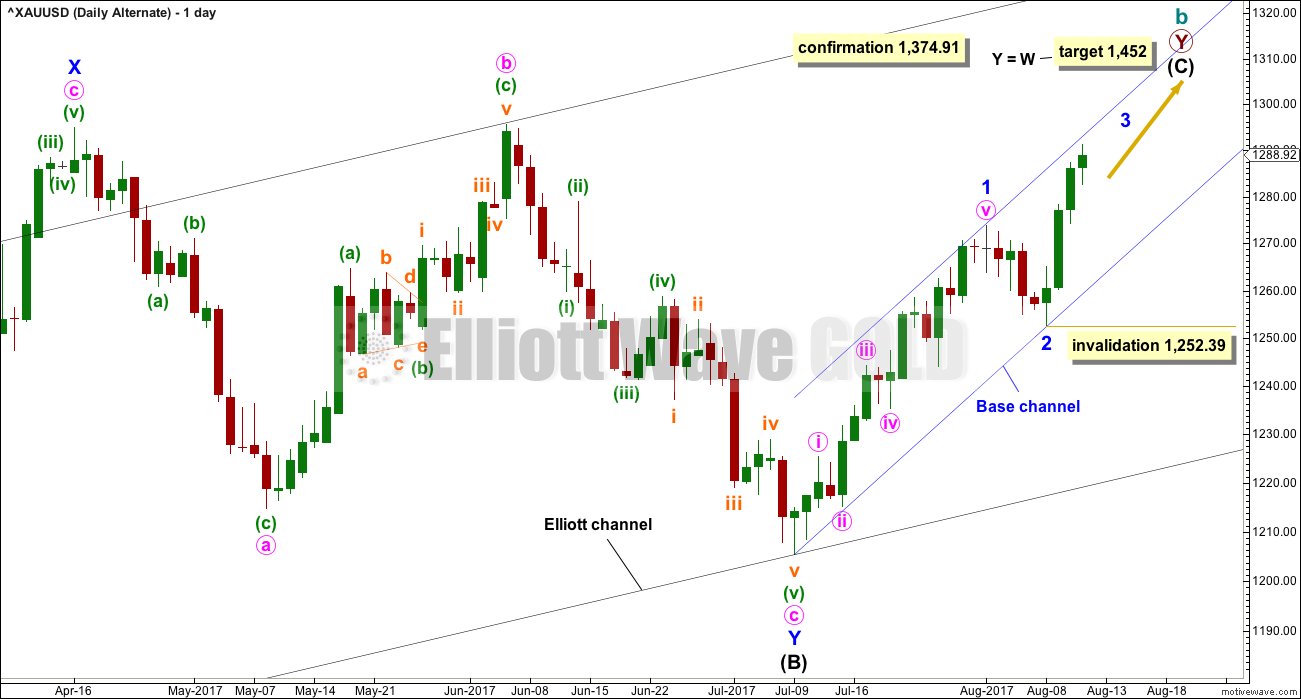
If cycle wave b is a double zigzag, then current upwards movement may be part of the second zigzag in the double, labelled primary wave Y.
The target remains the same as previously published for this wave count.
Along the way up, some resistance should be expected at the cyan Magee trend line. Because this wave count requires price to break above the Magee trend line, it must be judged to have a lower probability for this reason. This trend line is tested multiple times and goes back to 2011. It is reasonable to expect price to find resistance there, until proven otherwise.
Within intermediate wave (C), no second wave correction may move beyond the start of its first wave below 1,205.41.
DAILY CHART
Click chart to enlarge.
Intermediate wave (C) may be unfolding as an impulse.
Only minor wave 1 may have been over at the last high. Minor wave 2 may have begun. Minor wave 2 today may be continuing further as an expanded flat correction. It would be possible to label it over at the last low, but that would see minor wave 2 remarkably brief and shallow. It would still have better proportion and be of more normal depth if it continued as a very common expanded flat.
Minor wave 2 may not move beyond the start of minor wave 1 below 1,205.41.
A-B-C of a zigzag subdivides 5-3-5, exactly the same as 1-2-3 of an unfolding impulse. The hourly chart now for both Elliott wave counts would be exactly the same in terms of subdivisions and short term expectations. The blue channel which should provide support for any deep pullbacks would also be exactly the same.
TECHNICAL ANALYSIS
WEEKLY CHART
Click chart to enlarge. Chart courtesy of StockCharts.com.
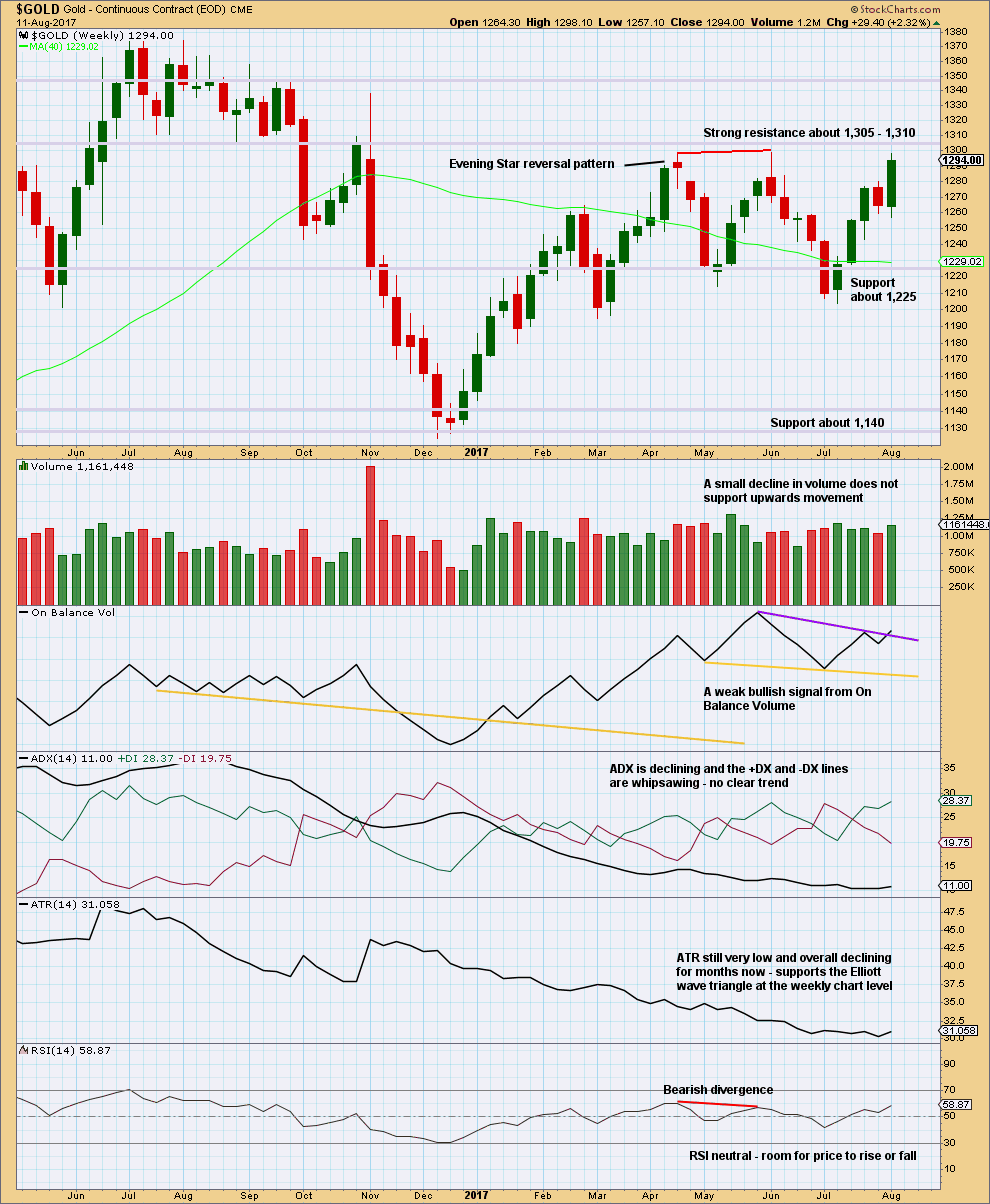
This upwards week has support from volume. Look out for strong resistance now close by. A pullback about 1,305 to 1,310 is a reasonable expectation.
On Balance Volume gives a weak bullish signal. This supports both Elliott wave counts.
ADX and ATR both support the main weekly Elliott wave count. This is what a triangle should look like.
DAILY CHART
Click chart to enlarge. Chart courtesy of StockCharts.com.
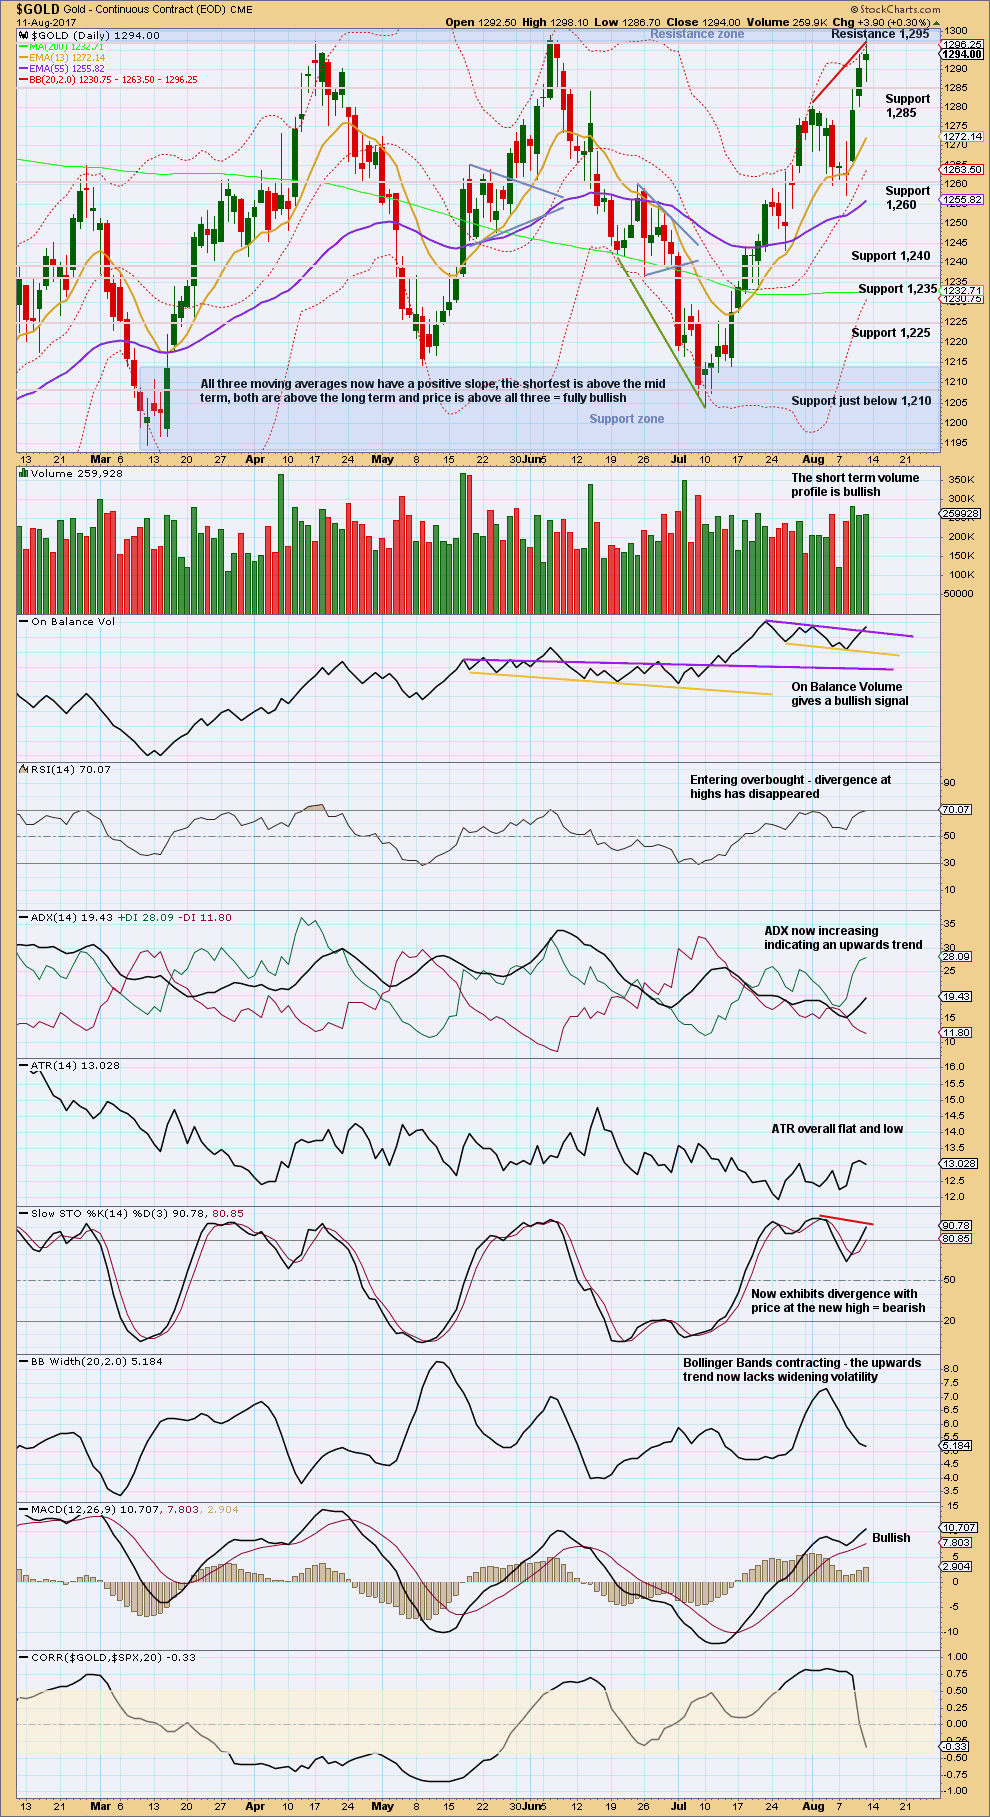
Price is at strong resistance here. The spinning top candlestick pattern and strong resistance support the idea of a pullback here.
The bullish signal from On Balance Volume is a bit weak, but still give it weight.
RSI and Stochastics may move higher and may remain extreme for a reasonable period of time before price turns.
Volume supports upwards movement.
Overall, the picture is bullish but look out for a pullback at resistance.
GDX
DAILY CHART
Click chart to enlarge. Chart courtesy of StockCharts.com.
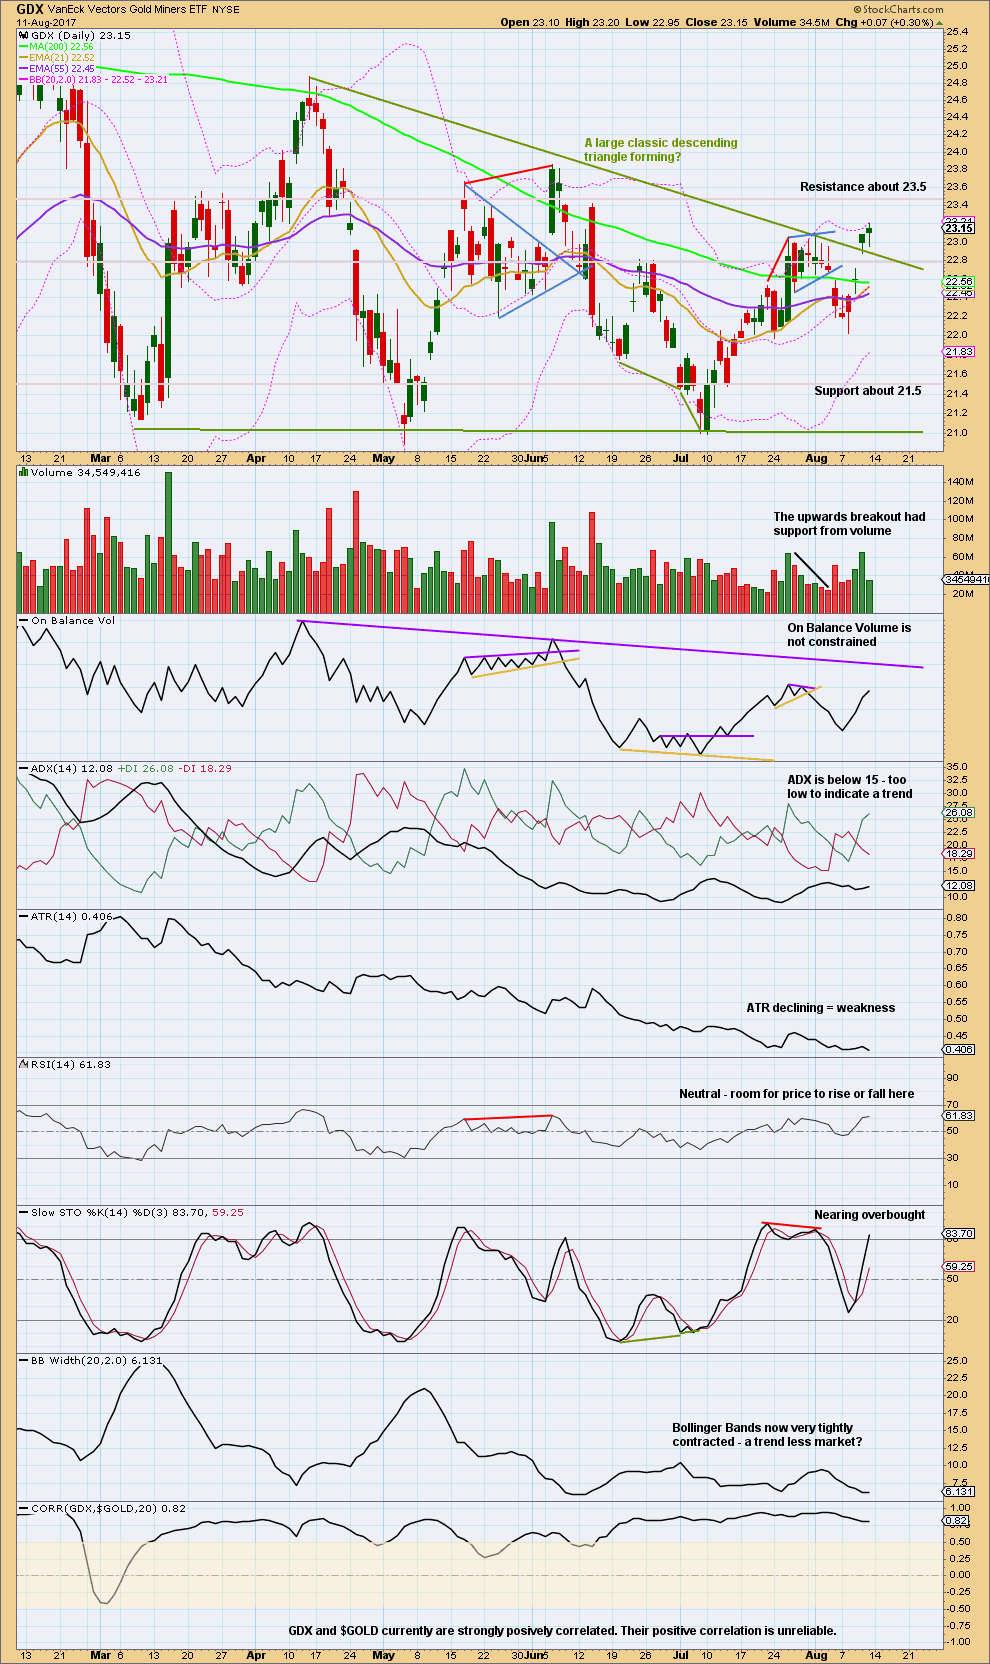
After an upwards breakout with support from volume, the upwards trend now looks like it lacks strength for Friday.
Friday’s small candlestick on light volume looks like a pause within the trend. Price may be ready to curve down to test prior support at the upper triangle trend line.
Overall, this market is trendless and lacks strength. That supports the idea of a large Elliott wave triangle also completing for GDX.
Published @ 10:57 p.m. EST on 12th August, 2017.
https://economyandmarkets.com/markets/gold/harry-dent-gold-next-downside-around-700/
Just thought some of you might like a long term fiew
Main hourly chart updated:
For the alternate it would be exactly the same, except instead of minor A-B-C it would be minor 1-2-3.
Target for the pullback to end is still the same.
Looking like a triple top to me. GLD upper B band penetration suggests at the very least a “Pause for the Cause”……
being very long on the breakout, IF it happens (still a very big IF), was never going to be easy. I got stopped out on a big piece of long position today at lower prices than i would have liked. Have one last tranche left, and on the defensive at the moment for sure. Maybe i’ll look again at shorting the market lol. Already took a little taste on strength today and am short a little copper. That looks like it may drop soon
Thanks for the update Lara
Any chance you could update the hourly Alt as well
Thanks!
It would be exactly the same as the main alt.
1-2-3 and A-B-C (zigzag) subdivide exactly the same.
Short term looking for a retrace to about 22.82 in the next 2 days
https://www.tradingview.com/x/4W7o45VP/
More confidence in this count with a break above the purple trendline
https://www.tradingview.com/x/IeKKFN8I/
Sigh, Imo no joy in it for the short side with 1285-84 beginning to hold; the low of the day may be in already and hard to see this break below 1282. Upside move to look out for with a rising ADX, bullish momentum & ROC…. sideways scalp trade lol
The long term bullish falling wedge is close to be broken.
Gold has broken out from a weekly inv HnS within this bullish multi year falling wedge. This consolidation is just below the major S/R line. According to Rambus such consolidation is very significant in the direction of trend that is up.
I will not be surprised if this Magee line is broken in a week or two and gold resumes impulse move up til October??
Lara: If alternate becomes main wave count then highest gold target is 1452. Is that true?
Thanks.
Thanks Alan for your daily updates. I enjoy reading them and learn new ideas.
Papudi. 1452 assumes a 3-wave up. If I assume a 5-wave up, then the target is 1550. It’s just whether you look at Primary Y as 3 waves or 5 waves.
I can see negative divergence with your chart Papudi. The latest upmove has a higher stochastic then previous up move yet prices is below previous up move currently. Yen about to reverse any time soon, I just see more risk in going long then short here. Wouldn’t surprise me if we also get a triple top of gold chart too
Negative divergences in Stox and MACD are not confirmed with reversal yet. Need confirmation with reversal candle and crossover to downside.
US Oil Weekly Ichimoku Analysis
Data as at market close of August 11
==============================
Compared to gold and silver prices, which are rising, crude oil is faced with the burden of its inability to surpass the nearly six-month old purple descending trend-line resistance. However, a seven-week long brown upward slanting trend-line might restrict its dips afterwards. As long as the crude oil price lies within these two lines, it is going nowhere.
Crude oil price is trading above the 50-day SMA (46.47) but below its 200-day SMA (49.43). This is of course bearish. However, Ichimoku presents a different perspective. Tenkan-sen at 49.21 lies above the kijun-sen at 47.04. But prices are trading between the two lines. Slightly favourable, but not too inviting nevertheless. Like gold and silver, the cloud is red for the entire duration of August.
My take is that crude oil made a false breakout in early August, as shown in the graph. The poor bulls had been doing victory laps when prices approached 50.00. Fortunately, I stuck to my thinking as outlined in my last report two weeks ago about my apprehensions for a further northward foray. Those same factors are still present now, and are discussed in the preceding paragraph. Tempted as I was to enter long above 50.00, prudence won the day. I am still leaning towards the bearish scenario for the same reason. Moreover, the fact that an imminent war is brewing has been met with a spurn does not augur well for the bulls. And added to that are the controversy theories about why oil prices are depressed. They are not worth repeating here, but there’s no smoke without fire.
SILVER Weekly Ichimoku Analysis
Data as at market close of August 11
===============================
Unlike gold, which is heading for its next resistance, silver has cleared its 200-day SMA, which favours its upside towards 17.25 and then 17.50 before confronting 17.75, the previous high reached in June. At the same time, silver has broken above the purple downtrend resistance line. Notice that the breakout was right in the middle of the move up in the third wave from 16.10, as it should be. That line would act as support should prices fall back. It does mean that prices ought not to drop below 16.70-16.50. Incidentally, the 50-day SMA is at 16.56, and tenkan-sen support is at 16.67.
End of Week Analysis
Data as at the market close of August 11
==================================
The gold market bounced remarkably from a low of 1252.39 on Tuesday to a high of 1291.37 on Friday. Undoubtedly, this move was fuelled by the fear trade coming out of the arguments between North Korea and America. Investor sentiment, being the capricious creature that it is, this upmove is most likely a short-term effect, and will abate once the rhetoric dies down. Personally, I think that this “fire and fury” really is “all sound and fury, signifying nothing”. Sellers ought to jump into the market pretty soon. But, if we do break above the 1300 level, then 1315 could be the next stop.
There is pretty much a lot of pull factors going for gold. Prices are trading way above the 50-day SMA (1254.74) and 200-day SMA (1232.71). The same bullish picture is also found in Ichimoku: prices are trading way above the tenkan-sen (1277.60) and the kijun-sen (1251.05). MACD remains in a healthy accelerating uptrend. The 5-day RSI is oversold but this is not extreme yet.
The push factors are that the kumo has turned red, and would linger until mid-September. But perhaps, the greater obstruction to a relentless rise comes from the fact that prices are fast approaching a horizontal line drawn across the recent double top at 1294.96 (April 17) and 1295.65 (June 6). Moreover, the psychological round number 1300 looms.
In the bigger picture context, gold prices are in a consolidation zone roughly bounded by 1300 at the top and 1200 at the bottom. Until and unless we break out of the zone, gold prices will still be drifting along. My best guess is that there would be at least be some pullback in the very near future, and this could begin as early as Monday next week barring more salvo of words between the two belligerent nations. As quickly as it had risen, prices might also beat a hasty retreat. The resistance-turned support 1275 region could prove effective in containing the drop. But, if investor sentiment sours, that too could give way as rapidly as it did on the way up. The next and probable last stop would be the 1250 region. It is currently the abode of the 50-day SMA (1254.74) as well as kumo top boundary support (1251.40). My expectation is for a bounce off this massive support region. The jury is still out regarding the bearish or the more bullish stance. As it stands, investor sentiment has been geared towards the more bullish scenario, even without accounting for the current nuclear missile debacle.
Thanks Alan for all the analysis. I agree there likely will be a short term pullback early in the week.