
A little more downwards movement was expected to a target at 1,266. Price did move lower, but did not make a new low and has fallen $2.34 short of the target.
Summary: A short term target is now at 1,307. The final target is still at 1,320.
The trend still looks to be upwards. Pullbacks are an opportunity to join the trend.
Always use a stop. Invest only 1-5% of equity on any one trade.
New updates to this analysis are in bold.
Last monthly charts and alternate weekly charts are here, video is here.
Grand SuperCycle analysis is here.
MAIN ELLIOTT WAVE COUNT
WEEKLY CHART
Click chart to enlarge.
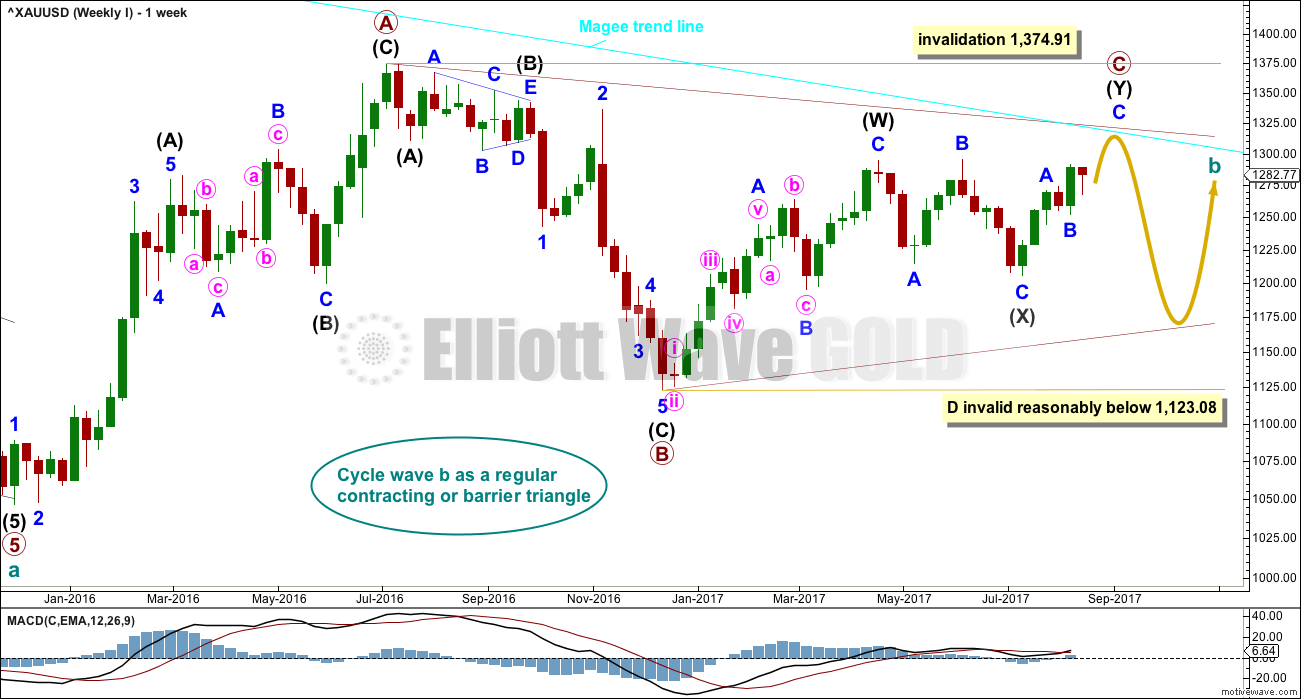
The Magee bear market trend line is added to the weekly charts. This cyan line is drawn from the all time high for Gold on the 6th of September, 2011, to the first major swing high within the following bear market on the 5th of October, 2012. This line should provide strong resistance.
To use this trend line in the way Magee describes, we should assume that price will find resistance at the line if it gets back up there. If the line is breached (by at least one or two full daily candlesticks above it), it will be signalling a major trend change from bear to bull. At that point the alternate Elliott wave count should be preferred.
At this stage, a triangle still looks possible and has the best fit for cycle wave b. It has strong support now from declining ATR and MACD hovering about zero.
Within a triangle, one sub-wave should be a more complicated multiple, which may be primary wave C. This is the most common sub-wave of the triangle to subdivide into a multiple.
Intermediate wave (Y) now looks like a developing zigzag at the weekly chart level, and minor wave B within it shows up with one red weekly candlestick. Primary wave C may end at the Magee trend line.
Primary wave D of a contracting triangle may not move beyond the end of primary wave B below 1,123.08. Contracting triangles are the most common variety.
Primary wave D of a barrier triangle should end about the same level as primary wave B at 1,123.08, so that the B-D trend line remains essentially flat. This involves some subjectivity; price may move slightly below 1,123.08 and the triangle wave count may remain valid. This is the only Elliott wave rule which is not black and white.
Finally, primary wave E of a contracting or barrier triangle may not move beyond the end of primary wave C above 1,295.65. Primary wave E would most likely fall short of the A-C trend line. But if it does not end there, then it can slightly overshoot that trend line.
Primary wave A lasted 31 weeks, primary wave B lasted 23 weeks, and primary wave C may now have just completed its 34th week. A double zigzag may be expected to be longer lasting than single zigzags within a triangle, and so this continuation of primary wave C is entirely acceptable and leaves the wave count with the right look at this time frame.
DAILY CHART
Click chart to enlarge.
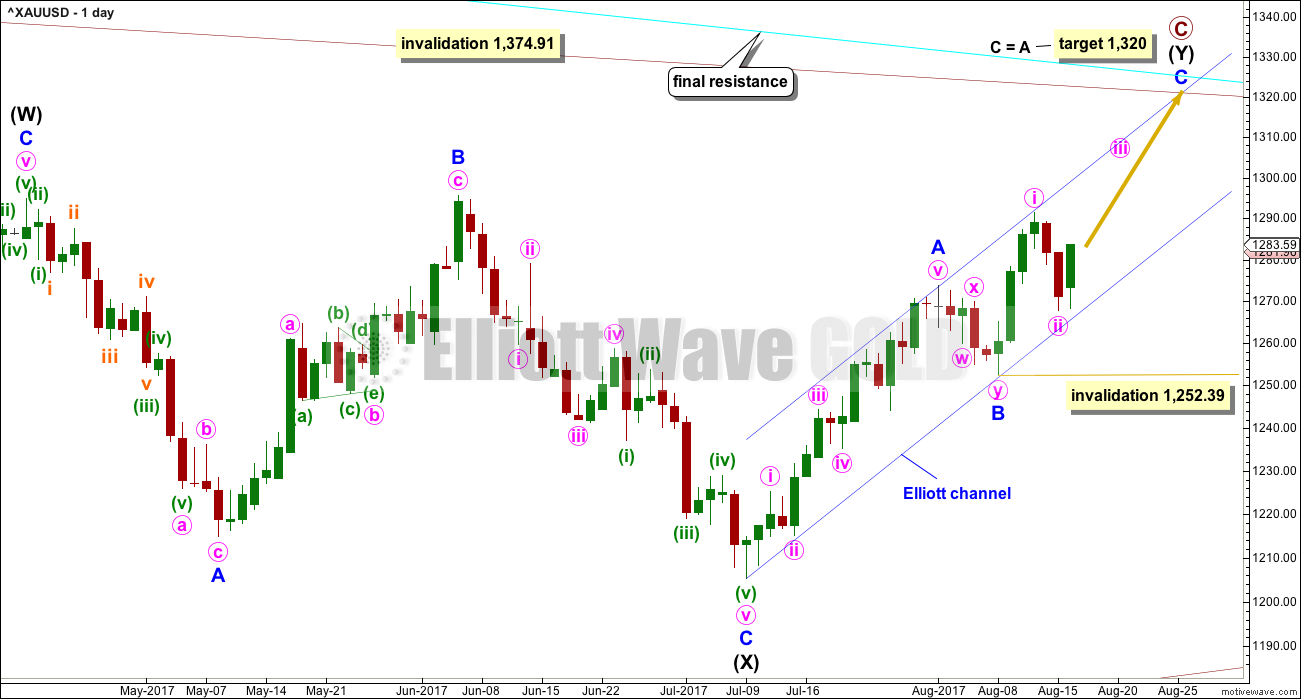
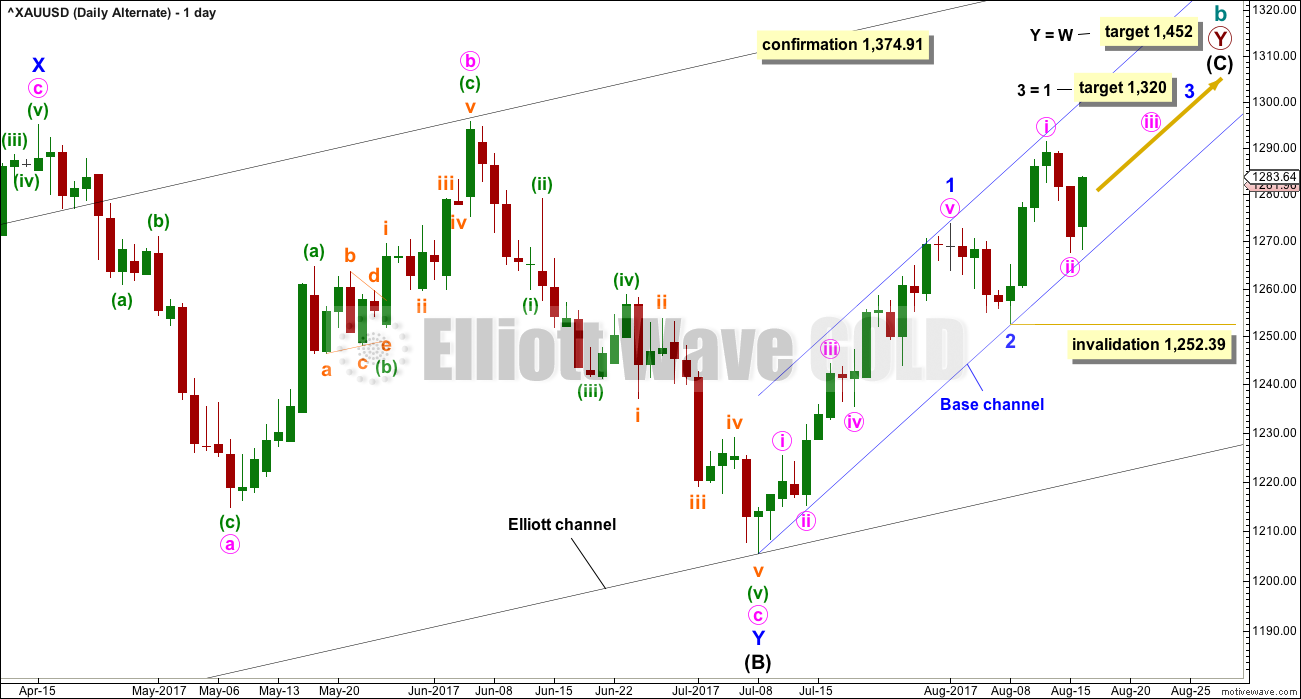
A target for primary wave C to end is calculated using the most common Fibonacci ratio between minor waves A and C. If the target is wrong, it may be too high; there is very strong resistance about 1,305 to 1,310. At this stage, the target at 1,320 may see upwards movement end about the Magee trend line.
Within minor wave C, no second wave correction may move beyond the start of its first wave below 1,252.39. Along the way up, corrections should find final support at the lower edge of the blue Elliott channel.
Minor wave C may only unfold as a five wave structure, either an impulse or an ending diagonal. An impulse is much more common and will be expected until shown otherwise by price.
Within an impulse for minor wave C, the corrections of minute waves ii and iv would most likely show up on the daily chart, like they do within minor wave A. Minute waves ii and iv within minor wave A both lasted two sessions, so they may also last about two to three sessions within minor wave C.
Minute wave ii now shows up with two red daily candlesticks. It has a typical look.
Minute wave ii may be used as an entry opportunity to join the current upwards trend.
HOURLY CHART
Click chart to enlarge.
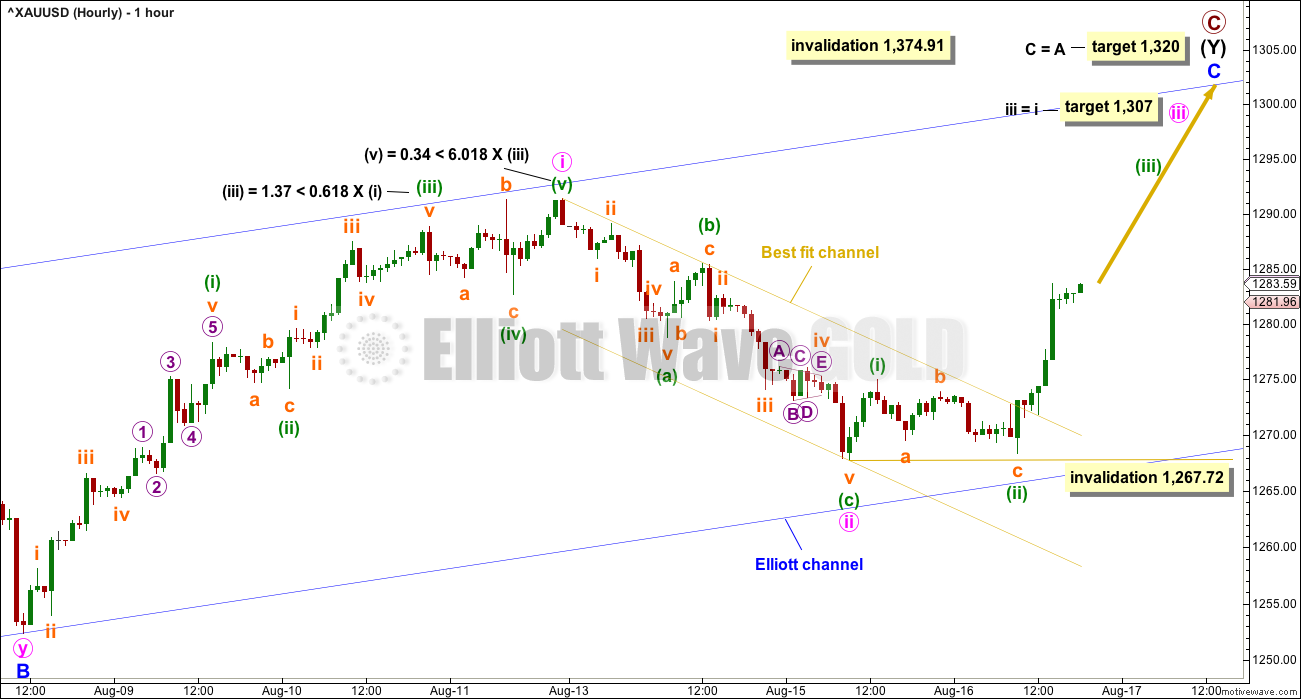
Upwards movement has strongly broken above the best fit channel containing the last wave down labelled minute wave ii. This strongly indicates that minute wave ii is likely to be over. A short term target is calculated for minute wave iii that fits with the final target for minor wave C.
Minute wave iii must move beyond the end of minute wave i. When minute wave iii is complete, then the following correction for minute wave iv must remain above minute wave i price territory and may not move below 1,291.36.
Minute wave iii should exhibit an increase in upwards momentum.
Within minuette wave (iii), no second wave correction may move beyond the start of its first wave below 1,268.34.
ALTERNATE ELLIOTT WAVE COUNT
WEEKLY CHART
Click chart to enlarge.
This wave count has been published only in historical analysis. At this stage, it will be published on a daily basis.
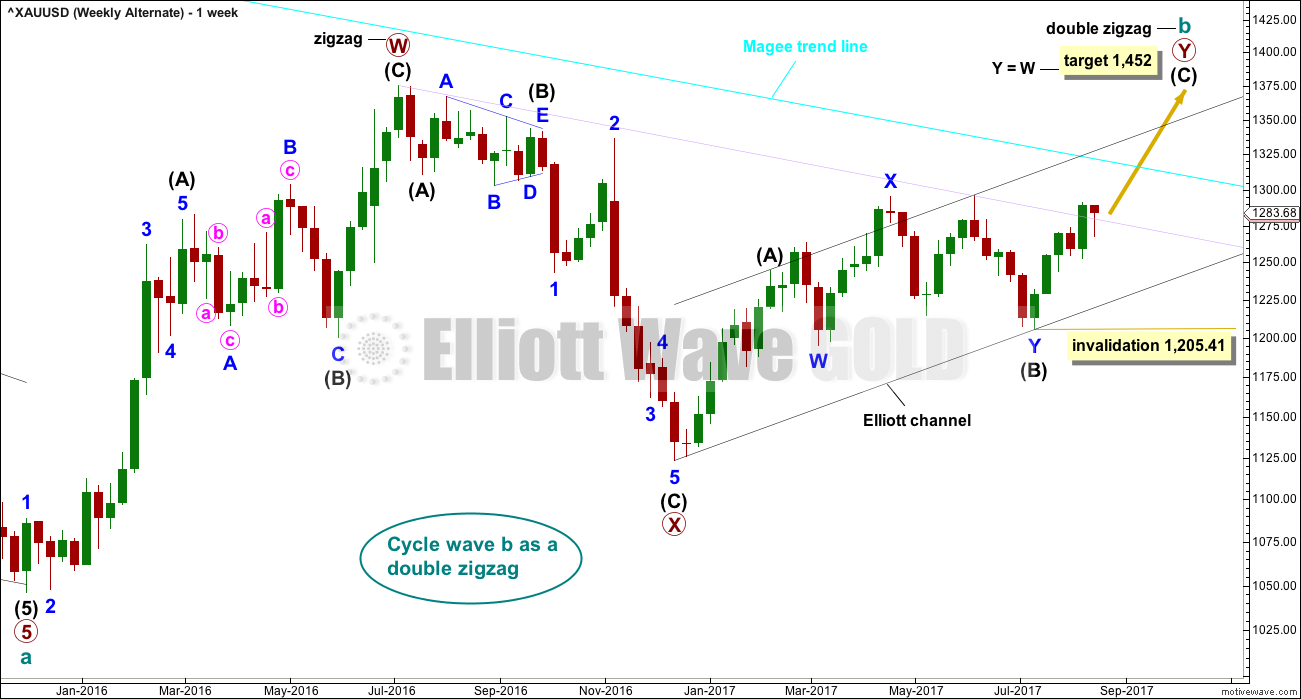
There are more than 23 possible corrective structures that B waves may take, and although cycle wave b fits best at this stage as a triangle (main wave count), it may still be another structure. This wave count looks at the possibility that it may be a double zigzag.
If cycle wave b is a double zigzag, then current upwards movement may be part of the second zigzag in the double, labelled primary wave Y.
The target remains the same as previously published for this wave count.
Along the way up, some resistance should be expected at the cyan Magee trend line. Because this wave count requires price to break above the Magee trend line, it must be judged to have a lower probability for this reason. This trend line is tested multiple times and goes back to 2011. It is reasonable to expect price to find resistance there, until proven otherwise.
Within intermediate wave (C), no second wave correction may move beyond the start of its first wave below 1,205.41.
DAILY CHART
Click chart to enlarge.
Intermediate wave (C) may be unfolding as an impulse.
Within the impulse, minor waves 1 and 2 would now be complete. Minor wave 3 must unfold as an impulse, and within it minute waves i and now ii would also be complete. Minute wave ii should find support at the lower edge of the base channel drawn about minor waves 1 and 2. So far it remains within the channel.
A-B-C of a zigzag subdivides 5-3-5, exactly the same as 1-2-3 of an unfolding impulse. The hourly chart now for both Elliott wave counts would be exactly the same in terms of subdivisions and short term expectations. The blue channel which should provide support for any deep pullbacks would also be exactly the same.
TECHNICAL ANALYSIS
WEEKLY CHART
Click chart to enlarge. Chart courtesy of StockCharts.com.
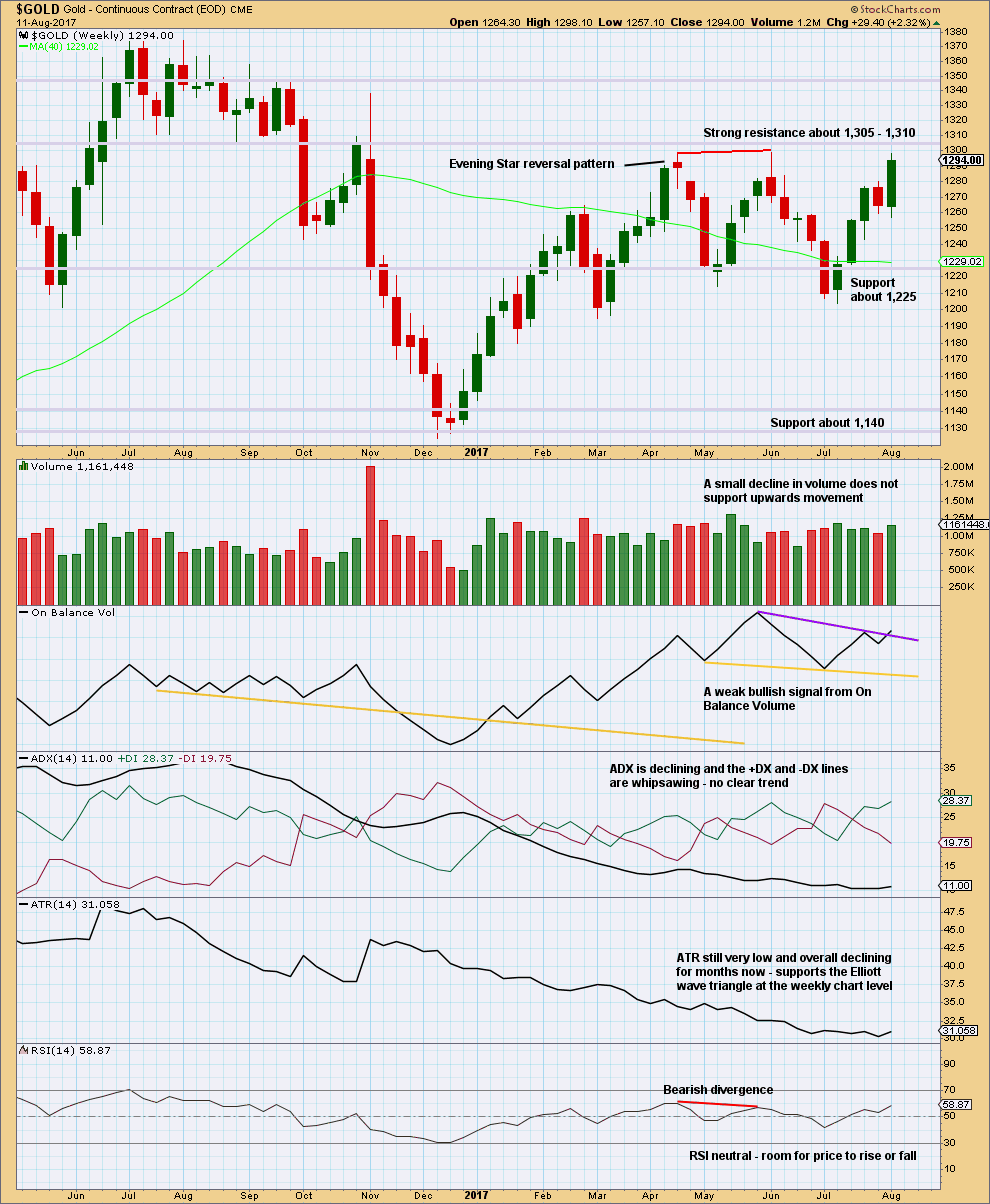
Last upwards week has support from volume. Look out for strong resistance now close by. A pullback about 1,305 to 1,310 is a reasonable expectation.
On Balance Volume gives a weak bullish signal. This supports both Elliott wave counts.
ADX and ATR both support the main weekly Elliott wave count. This is what a triangle should look like.
DAILY CHART
Click chart to enlarge. Chart courtesy of StockCharts.com.
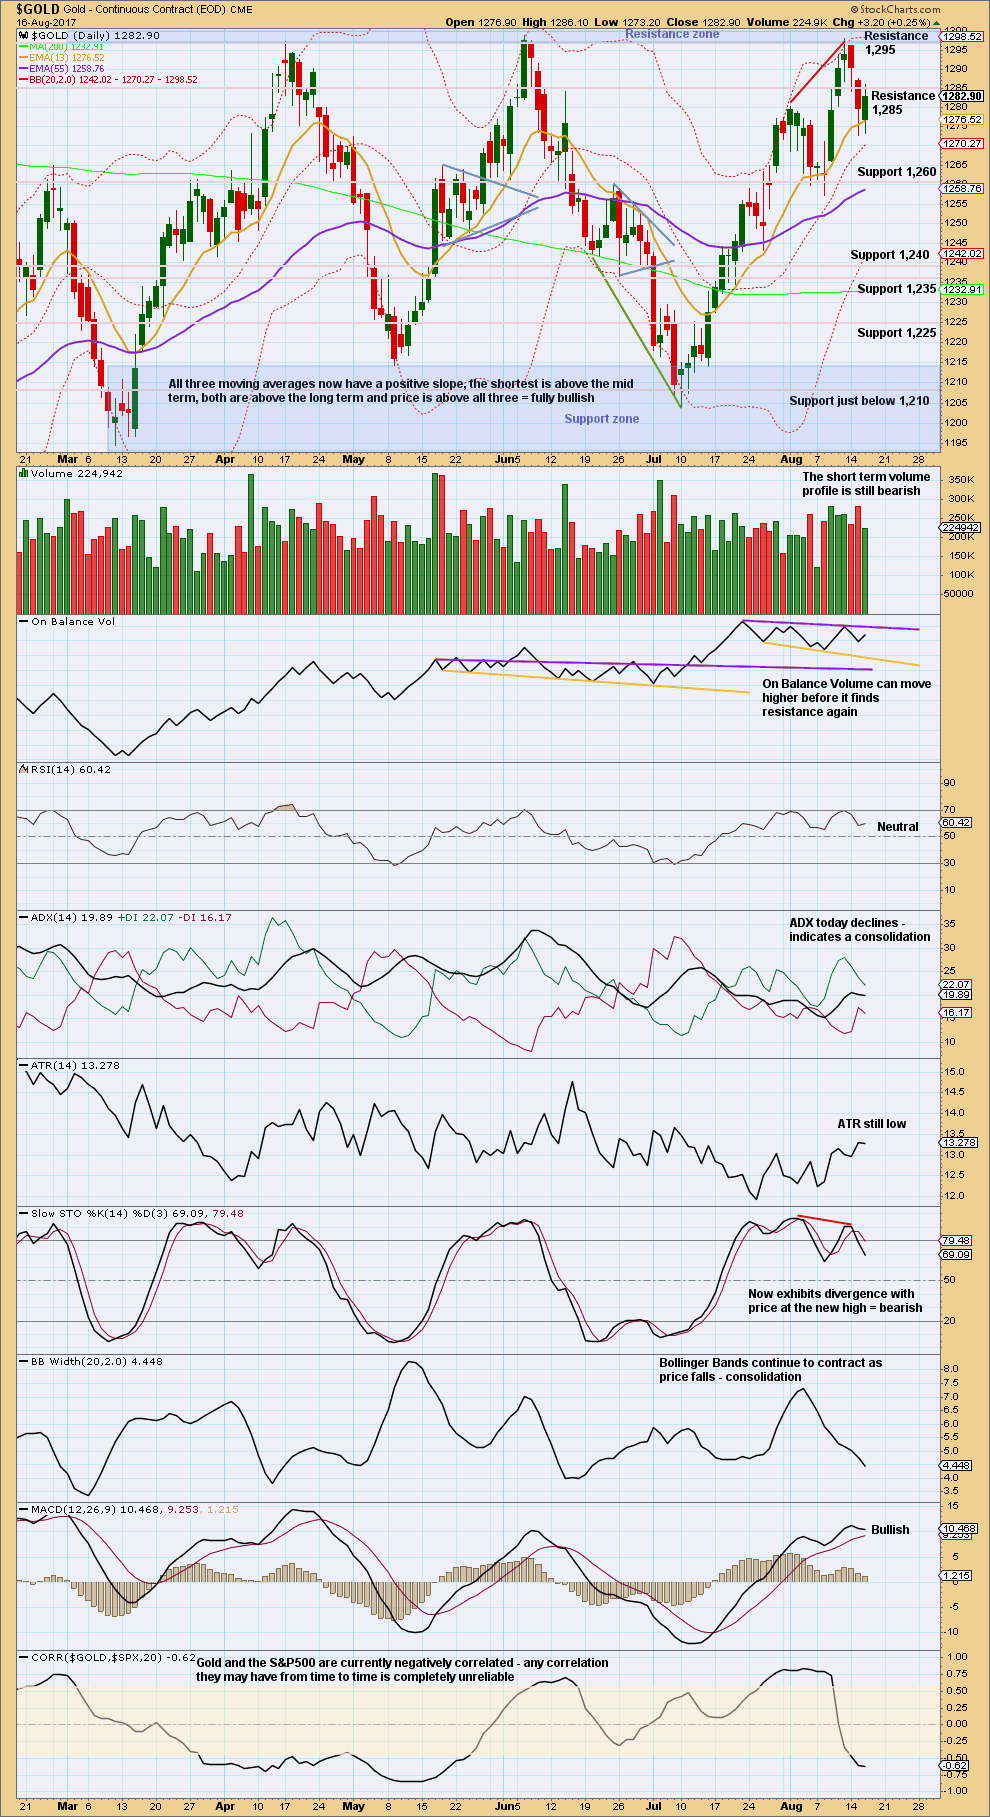
Wednesday’s candlestick is indecisive. The upper and lower wicks are about even, and volume did not offer good support for upwards movement during the session. It looks possible that Thursday may print another red candlestick before the pullback is done. Long lower wicks on the prior two red daily candlesticks is still bullish.
There is very strong resistance ahead for bulls to overcome, about 1,295 and 1,305 – 1,310. The Elliott wave count expects another multi day pullback within the zone of 1,305 – 1,310, which seems reasonable.
GDX
DAILY CHART
Click chart to enlarge. Chart courtesy of StockCharts.com.
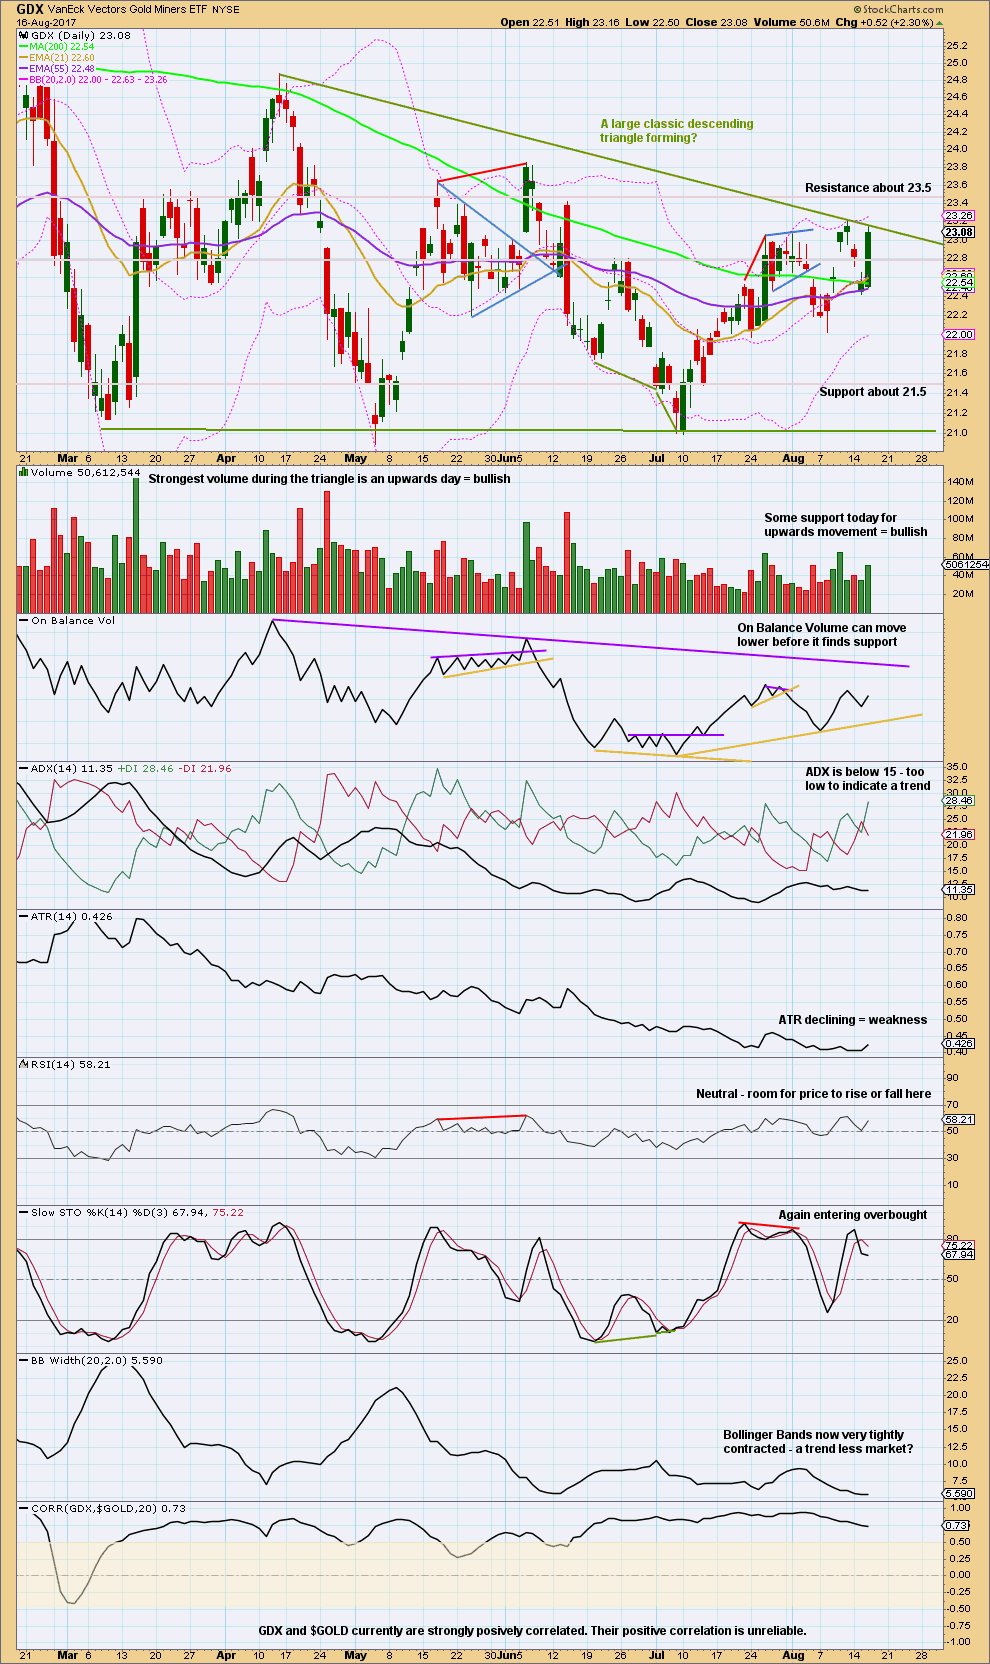
A strong upwards day for GDX remains at resistance at the adjusted triangle trend line. Volume is bullish, but overall still declining.
This market has been trendless for a long time now as a large triangle completes. Descending triangles most commonly break out downwards, but this is contradicted by volume during this triangle being strongest for upwards days.
Published @ 07:07 p.m. EST.
Pretty interesting couple of days. For those of you who remember the anecdote i shared about my biz partner a week or 2 ago, the recent weakness in the markets should come as no surprise lol. Anyways, i’m sure those who are bullish on gold have been worried about the stubborn weakness in gold related shares – never a comforting sign. I’ve been toying with the theory that it is the result of an impending big move down in the markets, where everything gets sold, even gold stocks, although they may fare better this time than the last crash. Just a thought. What is most interesting is that gold is again poised to break out big time, right at a time when the stock market shows potential of a bigger move down. Gold could just have been waiting for that trigger. Time will tell if this is what is actually happening.
Updated hourly chart:
It looks like another five up is close to completion. This may be another first wave, it hasn’t moved above minute i so it can’t be minute iii almost complete.
When minuette (i) is complete then another pullback for minuette (ii) would be expected. The 0.382 Fibonacci ratio would be a reasonable expectation, and if price moves below that the 0.618. It may not be deep, but may offer another opportunity to add to long positions.
Look for resistance at the upper edge of the blue Elliott channel. These channels often (not always) contain C waves.
Target for minuette (i) to end: 1,290 where subminuette v would = subminuette i.
Subminuette iii is just 1.77 longer than 2.618 X subminuette i.
Dreamer
Thank you for the update. Traded DUST this morning considering your chart.
Just curious…..
Would you consider GOLD Aug 11th high was the potential top and that we’ve had wave 1 down on Aug 15th and now wave 2 topped today?
Is that possible?
I guess I will find out in a day or two but a thought or two would be healthy.
Kyong, It’s possible, but I kinda doubt it. That would be a very deep 2nd wave retrace which is a bit unusual.
Also, don’t forget that we just broke out from the downtrend line going back to July 2016. That’s pretty significant and leads me to believe that it’s more likely now that we go higher to test the Magee trendline.
Bottom line though is to watch the uptrend channel on Lara’s daily chart. When that is broken to the downside, the move up is likely over. GL
Possible update to Lara’s hourly count. Expect a pullback to either 1,281 (Fib .382) or 1,276 (Fib .618)
https://www.tradingview.com/x/QxgR0CCS/
Nice chart Dreamer.
Looks like perhaps a .23 retrace
i like 1320 as a target but for wave but for the top of wave iii
i = ~ 23 point
iii = 23 * 1.62 + todays low 1283 = 1230
thoughts/?
Hi Patrick. I just assumed 3 = 1 in this case, since the Magee bear trendline comes in @ approx. 1,320. A 1.618 calc would be too long. This is assuming the triangle count is correct and the Magee trendline holds.
If we get a stronger move up, then we could get a breakout that changes the game.
Oil has dipped below its invalidation point Lara. Where to now for it? Thanks
Will update Oil charts this morning in the Oil analysis
If it’s broken below, then that means the alternate may be correct.
Rin Dang, use the alternate now for Oil. It looks like it’s beginning it’s next wave down to new lows. Target 34.34.
Thanks Lara for the analysis. If you ever have some spare time, Lol, can you glance at bitcoin chart which has been on fire and see if you can determine if we are near a significant 5 wave up structure where a decent correction would be expected.
Will do when home later this week.