
Upwards movement was expected for Tuesday’s session. Price has moved sideways to complete an inside day. The Elliott wave counts are changed a little.
Summary: Upwards movement may end within the next 24 hours below 1,315.81. Thereafter, there may be a sharp trend change and a violent downwards movement.
Always use a stop. Invest only 1-5% of equity on any one trade.
New updates to this analysis are in bold.
Last monthly charts and alternate weekly charts are here, video is here.
Grand SuperCycle analysis is here.
MAIN ELLIOTT WAVE COUNT
WEEKLY CHART
Click chart to enlarge.
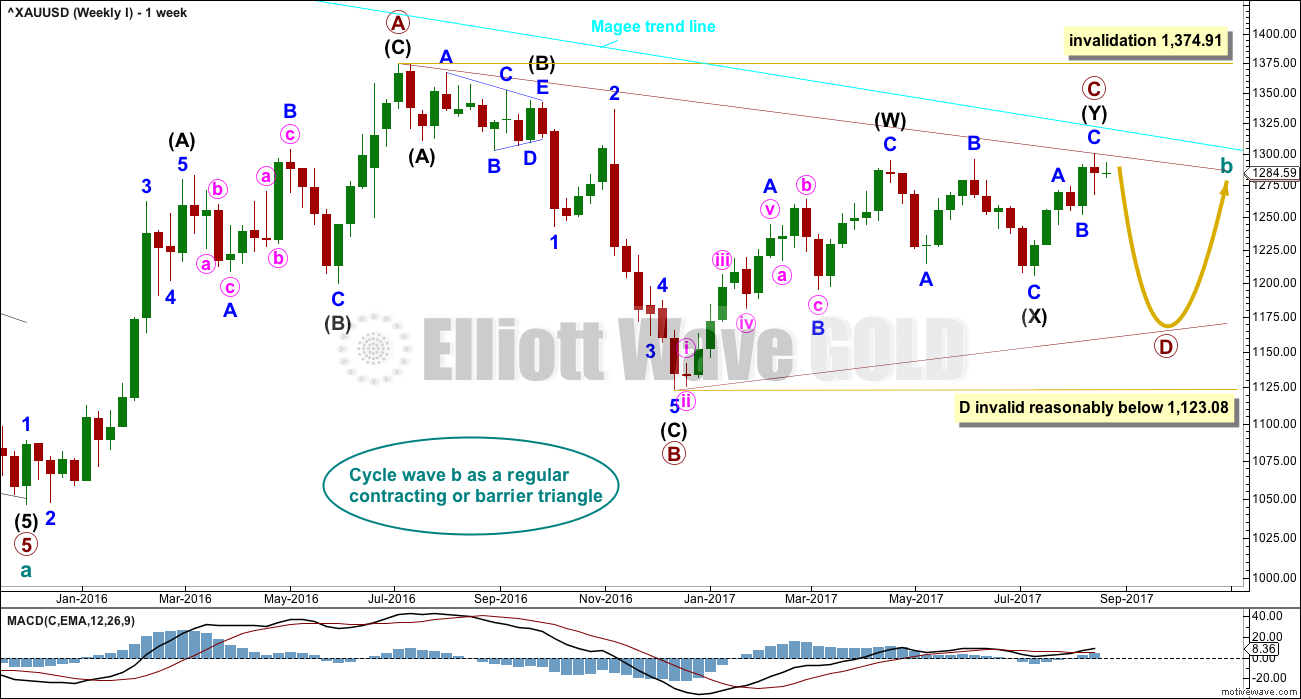
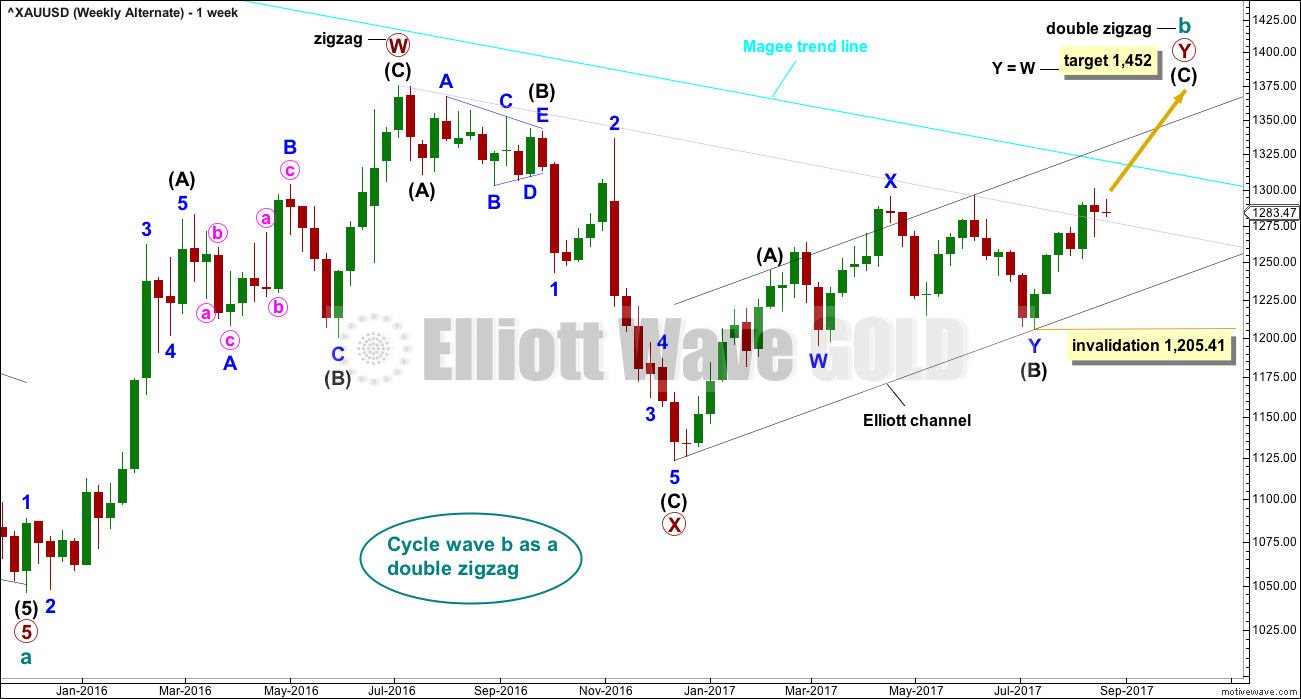
The Magee bear market trend line is added to the weekly charts. This cyan line is drawn from the all time high for Gold on the 6th of September, 2011, to the first major swing high within the following bear market on the 5th of October, 2012. This line should provide strong resistance.
To use this trend line in the way Magee describes, we should assume that price will find resistance at the line if it gets back up there. If the line is breached (by at least one or two full daily candlesticks above it), it will be signalling a major trend change from bear to bull. At that point the alternate Elliott wave count should be preferred.
At this stage, a triangle still looks possible and has the best fit for cycle wave b. It has strong support now from declining ATR and MACD hovering about zero.
Within a triangle, one sub-wave should be a more complicated multiple, which may be primary wave C. This is the most common sub-wave of the triangle to subdivide into a multiple.
Intermediate wave (Y) now looks like a developing zigzag at the weekly chart level, and minor wave B within it shows up with one red weekly candlestick. Primary wave C may end at the Magee trend line.
Primary wave D of a contracting triangle may not move beyond the end of primary wave B below 1,123.08. Contracting triangles are the most common variety.
Primary wave D of a barrier triangle should end about the same level as primary wave B at 1,123.08, so that the B-D trend line remains essentially flat. This involves some subjectivity; price may move slightly below 1,123.08 and the triangle wave count may remain valid. This is the only Elliott wave rule which is not black and white.
Finally, primary wave E of a contracting or barrier triangle may not move beyond the end of primary wave C above 1,295.65. Primary wave E would most likely fall short of the A-C trend line. But if it does not end there, then it can slightly overshoot that trend line.
Primary wave A lasted 31 weeks, primary wave B lasted 23 weeks, and primary wave C may now have just completed its 35th week. A double zigzag may be expected to be longer lasting than single zigzags within a triangle, and so this continuation of primary wave C is entirely acceptable and leaves the wave count with the right look at this time frame.
DAILY CHART
Click chart to enlarge.
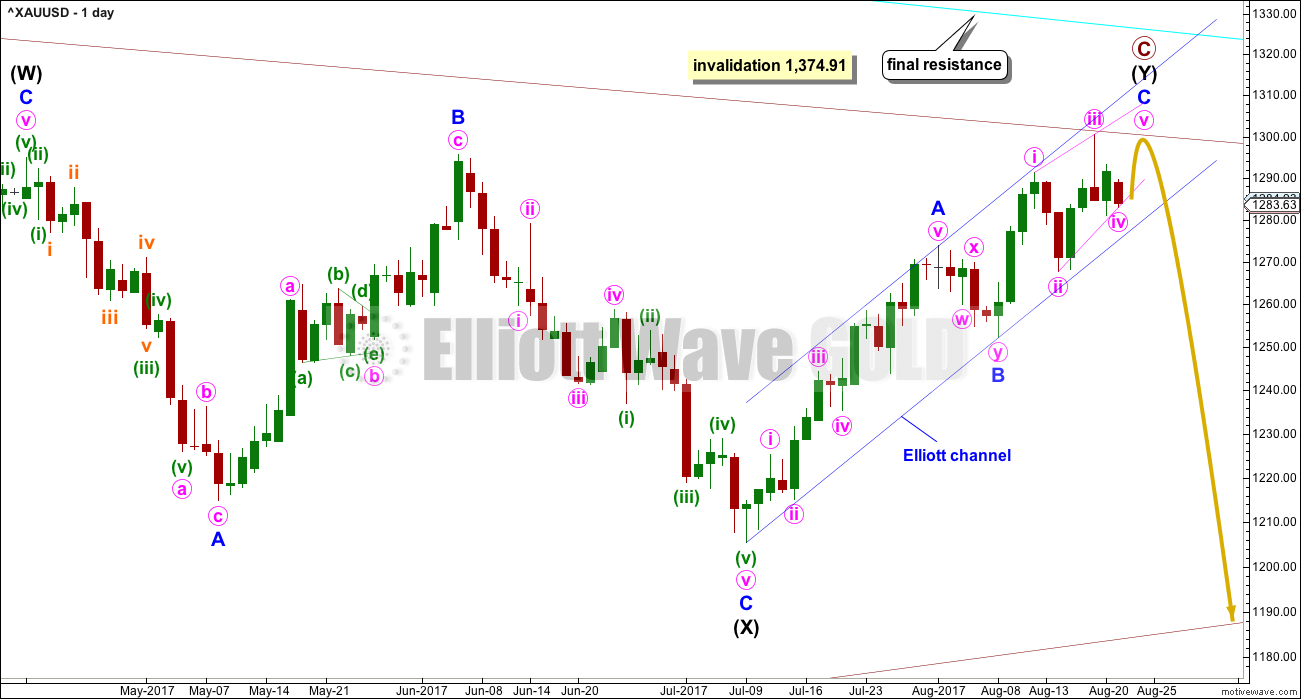
A target for primary wave C to end is calculated using the most common Fibonacci ratio between minor waves A and C. If the target is wrong, it may be too high; there is very strong resistance about 1,305 to 1,310. At this stage, the target at 1,320 may see upwards movement end about the Magee trend line.
Along the way up, corrections should find final support at the lower edge of the blue Elliott channel.
Minor wave C may only unfold as a five wave structure, either an impulse or an ending diagonal. Two hourly charts are provided below for both possible structures of minor wave C.
At this stage, an ending diagonal looks most likely for minor wave C, shown in the second hourly chart below.
FIRST HOURLY CHART
Click chart to enlarge.
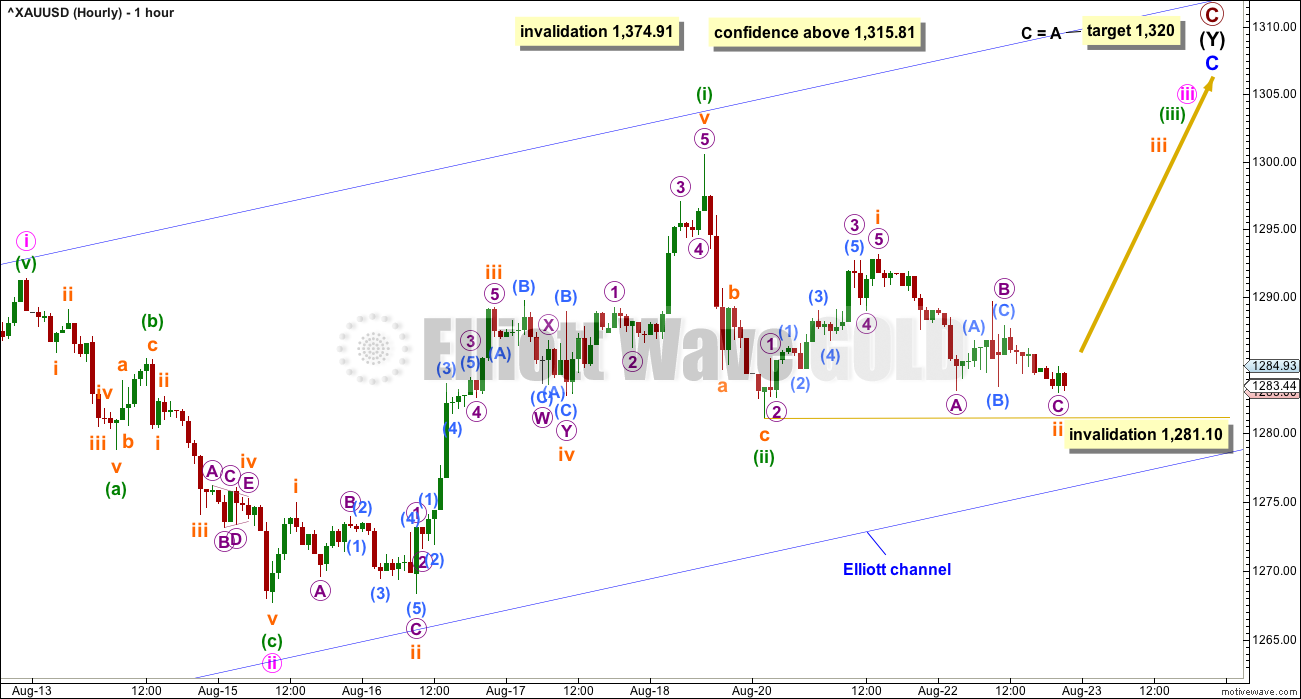
If minor wave C is an impulse, then it must have begun with three overlapping first and second waves.
This wave count now looks like the final target at 1,320 may not be high enough. It may not allow enough room for the structure of minor wave C to complete as an impulse. A higher target could be calculated, but that would require an overshoot or breach of the Magee trend line. That should not happen for this wave count.
At this stage, this first hourly wave count now expects to see a very strong increase in upwards momentum.
SECOND HOURLY CHART
Click chart to enlarge.
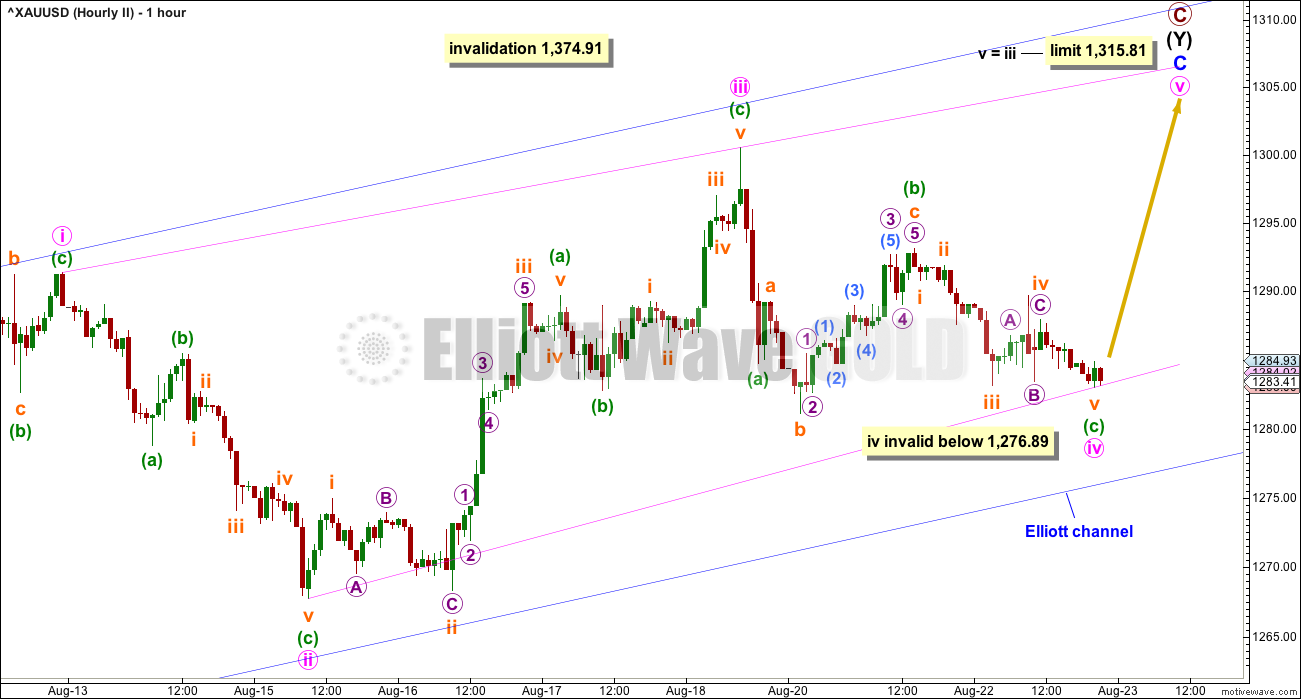
At this stage, this is still the preferred Elliott wave count.
The other structural possibility for minor wave C is an ending diagonal, which are more commonly contracting than expanding. The classic pattern equivalent here is a rising wedge. They are terminal structures.
This diagonal would be contracting because minute wave iii is slightly shorter than minute wave i.
Minute wave iv has continued sideways during Tuesday’s session. If it continues any lower, it may not be longer than equality in length with minute wave ii, so it may not move below 1,276.89. If minute wave iv does move lower, then the diagonal trend lines must still converge.
With minute wave iv moving sideways today, the limit for minute wave v is recalculated. Minute wave v may not be longer than minute wave iii. It must be shorter than minute wave iii, so it must end before the limit at 1,315.81.
No target is provided for minute wave v to end, and it may not exhibit a Fibonacci ratio to minute waves i or iii. The i-iii trend line should be used to indicate when minute wave v may be over. If price moves above the end of minute wave iii at 1,300.53 and then overshoots the i-iii trend line, then the diagonal may be complete. Contracting diagonals almost always end with overshoots of their i-iii trend lines.
Ending diagonals are commonly followed by sharp reversals. If this wave count is correct, then the first downwards movement after the diagonal is complete may be very strong and fast.
Use the blue Elliott channel as an indication of when primary wave C is over. A breach below the lower edge of the channel would be a strong indication of a trend change.
ALTERNATE ELLIOTT WAVE COUNT
WEEKLY CHART
Click chart to enlarge.
This wave count has been published only in historical analysis. At this stage, it will be published on a daily basis.
There are more than 23 possible corrective structures that B waves may take, and although cycle wave b fits best at this stage as a triangle (main wave count), it may still be another structure. This wave count looks at the possibility that it may be a double zigzag.
If cycle wave b is a double zigzag, then current upwards movement may be part of the second zigzag in the double, labelled primary wave Y.
The target remains the same as previously published for this wave count.
Along the way up, some resistance should be expected at the cyan Magee trend line. Because this wave count requires price to break above the Magee trend line, it must be judged to have a lower probability for this reason. This trend line is tested multiple times and goes back to 2011. It is reasonable to expect price to find resistance there, until proven otherwise.
Within intermediate wave (C), no second wave correction may move beyond the start of its first wave below 1,205.41.
DAILY CHART
Click chart to enlarge.
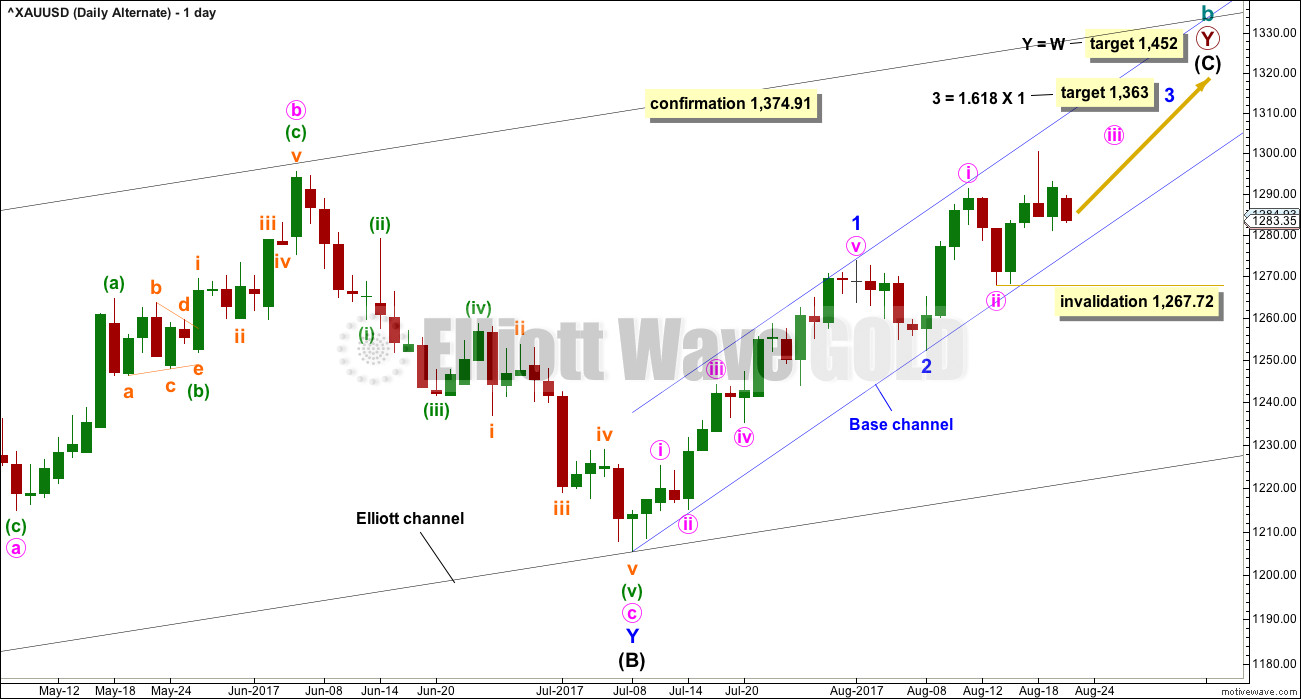
Intermediate wave (C) may be unfolding as an impulse.
Within the impulse, minor waves 1 and 2 would now be complete. Minor wave 3 must unfold as an impulse, and within it minute waves i and now ii would also be complete.
HOURLY CHART
Click chart to enlarge.
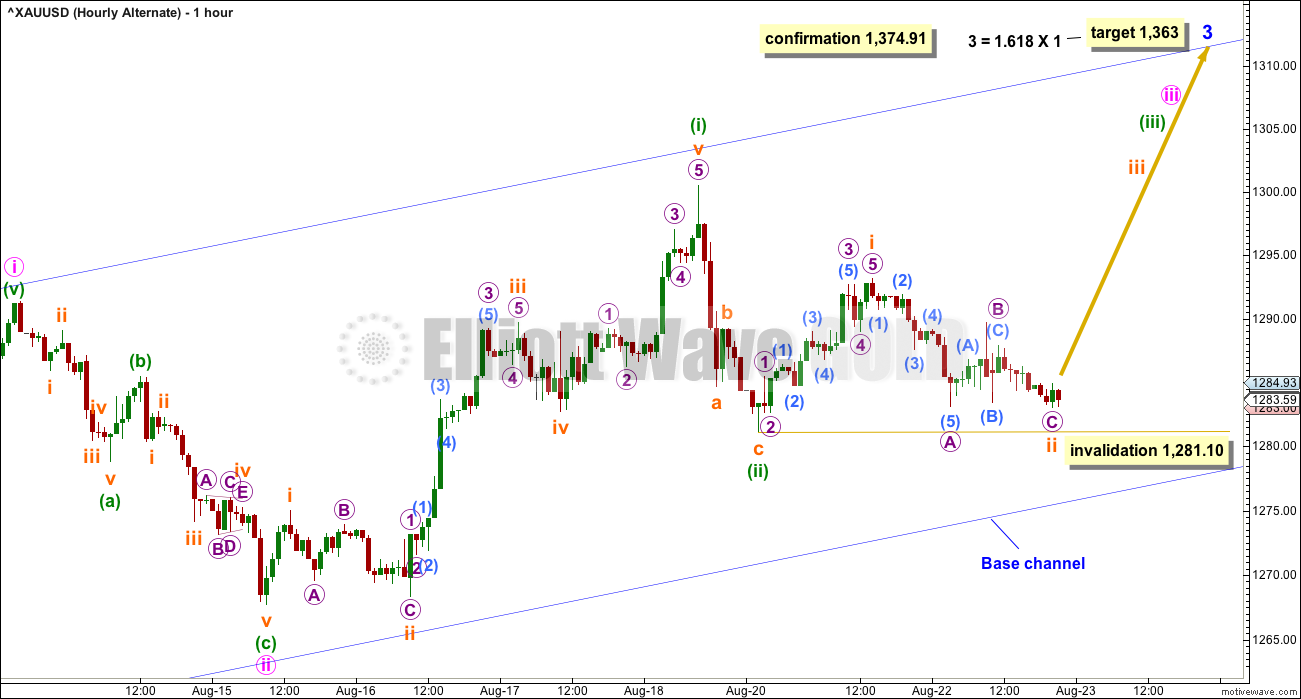
This hourly chart is exactly the same as the first hourly chart for the main Elliott wave count. 1-2-3 of an impulse subdivides exactly the same as A-B-C of a zigzag.
Minor wave 3 may only subdivide as an impulse for this alternate wave count. Minor wave 3 may not be a diagonal. The second hourly chart for the main wave count does not work for this alternate.
The target is now different. This wave count is more bullish, and it expects to see a breach of the Magee trend line.
TECHNICAL ANALYSIS
WEEKLY CHART
Click chart to enlarge. Chart courtesy of StockCharts.com.
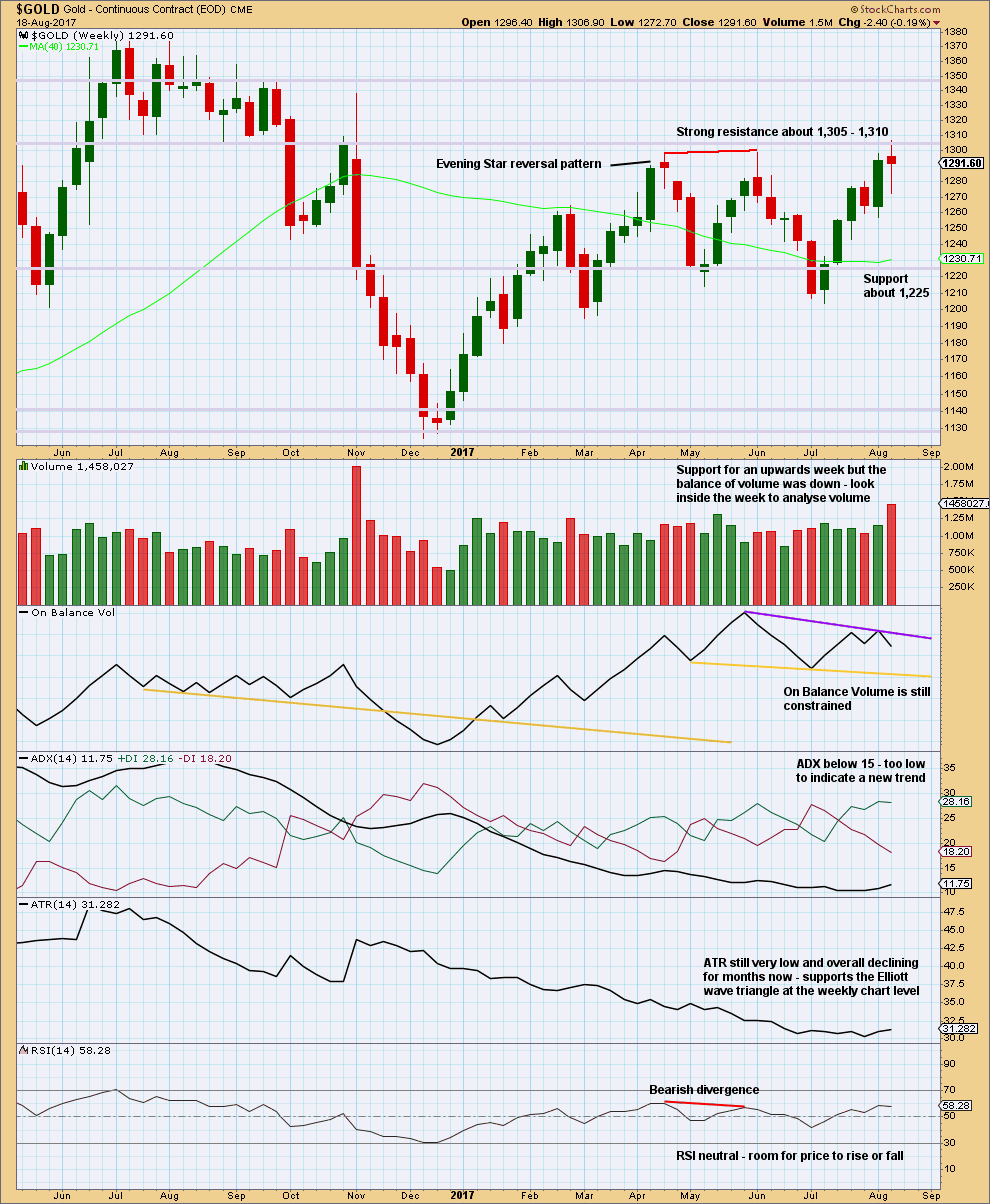
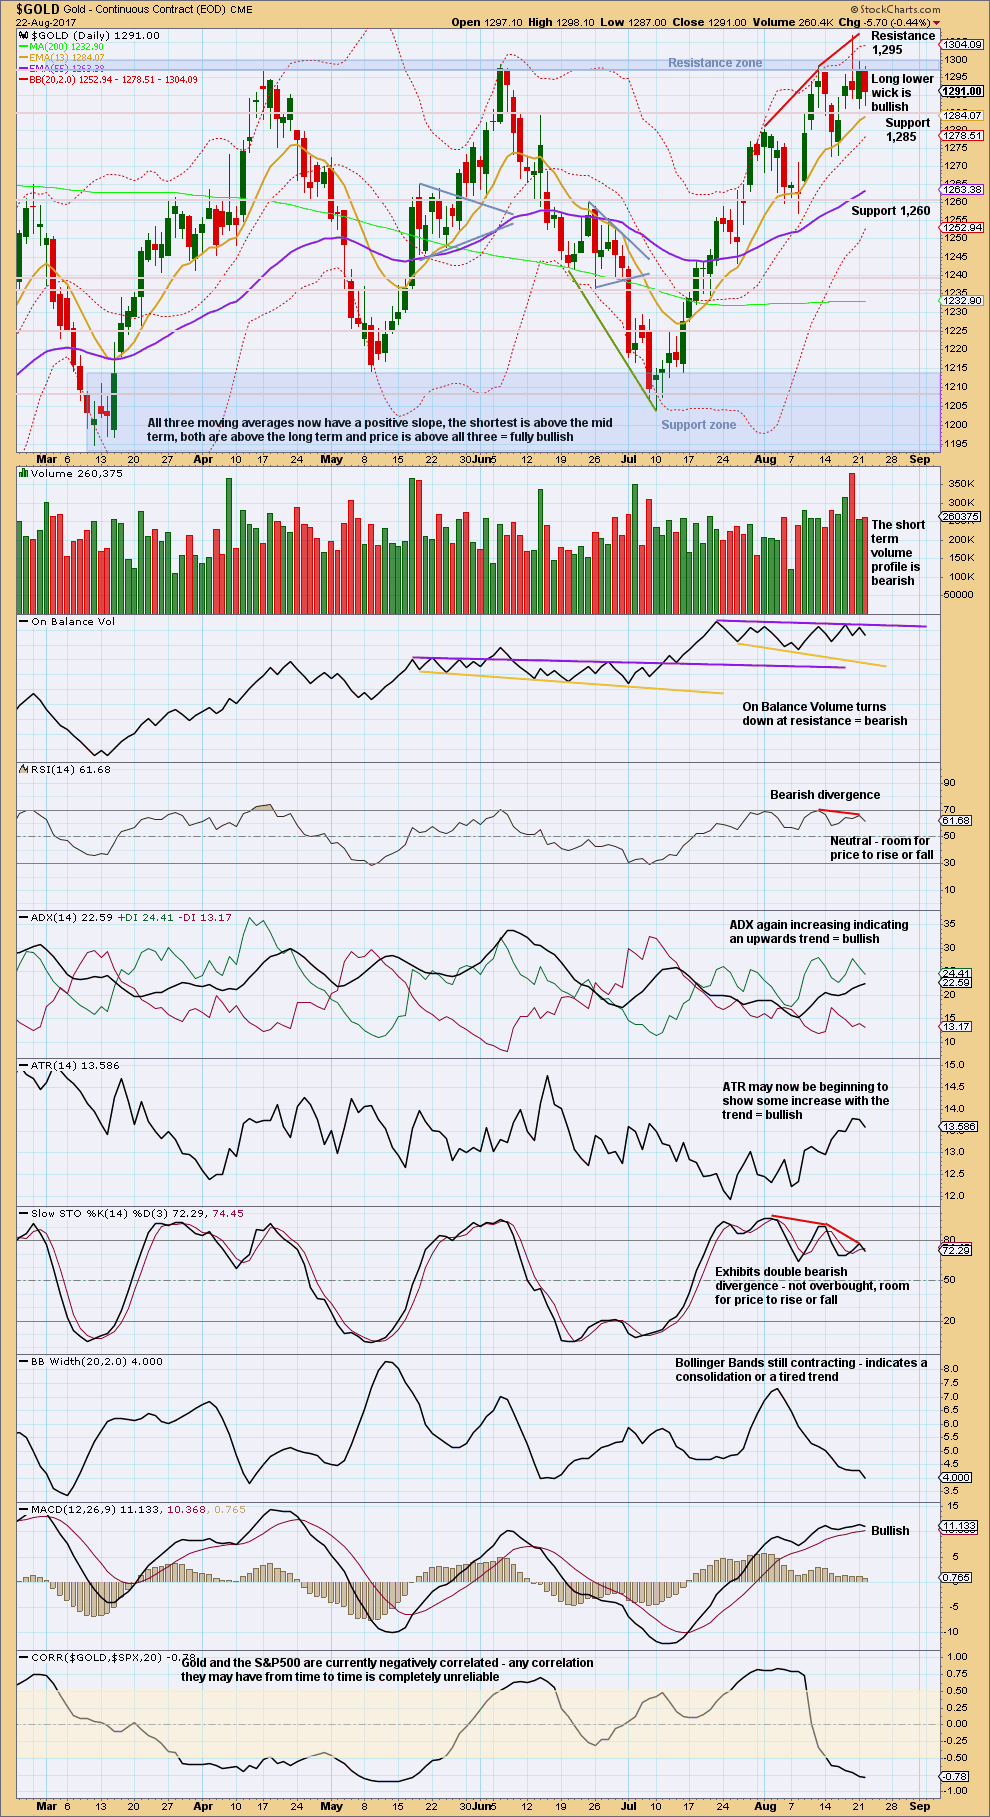
Price is finding very strong resistance about 1,310.
The upper purple resistance line for On Balance Volume is adjusted. On Balance Volume turning down from this line is a bearish signal.
ADX and ATR at the weekly chart level still strongly support the main Elliott wave count.
DAILY CHART
Click chart to enlarge. Chart courtesy of StockCharts.com.
The balance of volume is down for Tuesday and it shows a slight increase. For the short term, the volume profile continues to be bearish. Price is still finding very strong resistance about 1,305 – 1,310.
During the long consolidation phase, it is now the 18th of August that has strongest volume. This session moved price higher with a higher high and a higher low, but the balance of volume during the session was downwards. There was strong support during the session for downwards movement, which created the Shooting Star candlestick pattern.
This now suggests that the breakout from this large consolidation may more likely be downwards than upwards, and this now agrees with the main Elliott wave count.
On Balance Volume is now constrained. The most recent signal is bearish.
GDX
DAILY CHART
Click chart to enlarge. Chart courtesy of StockCharts.com.
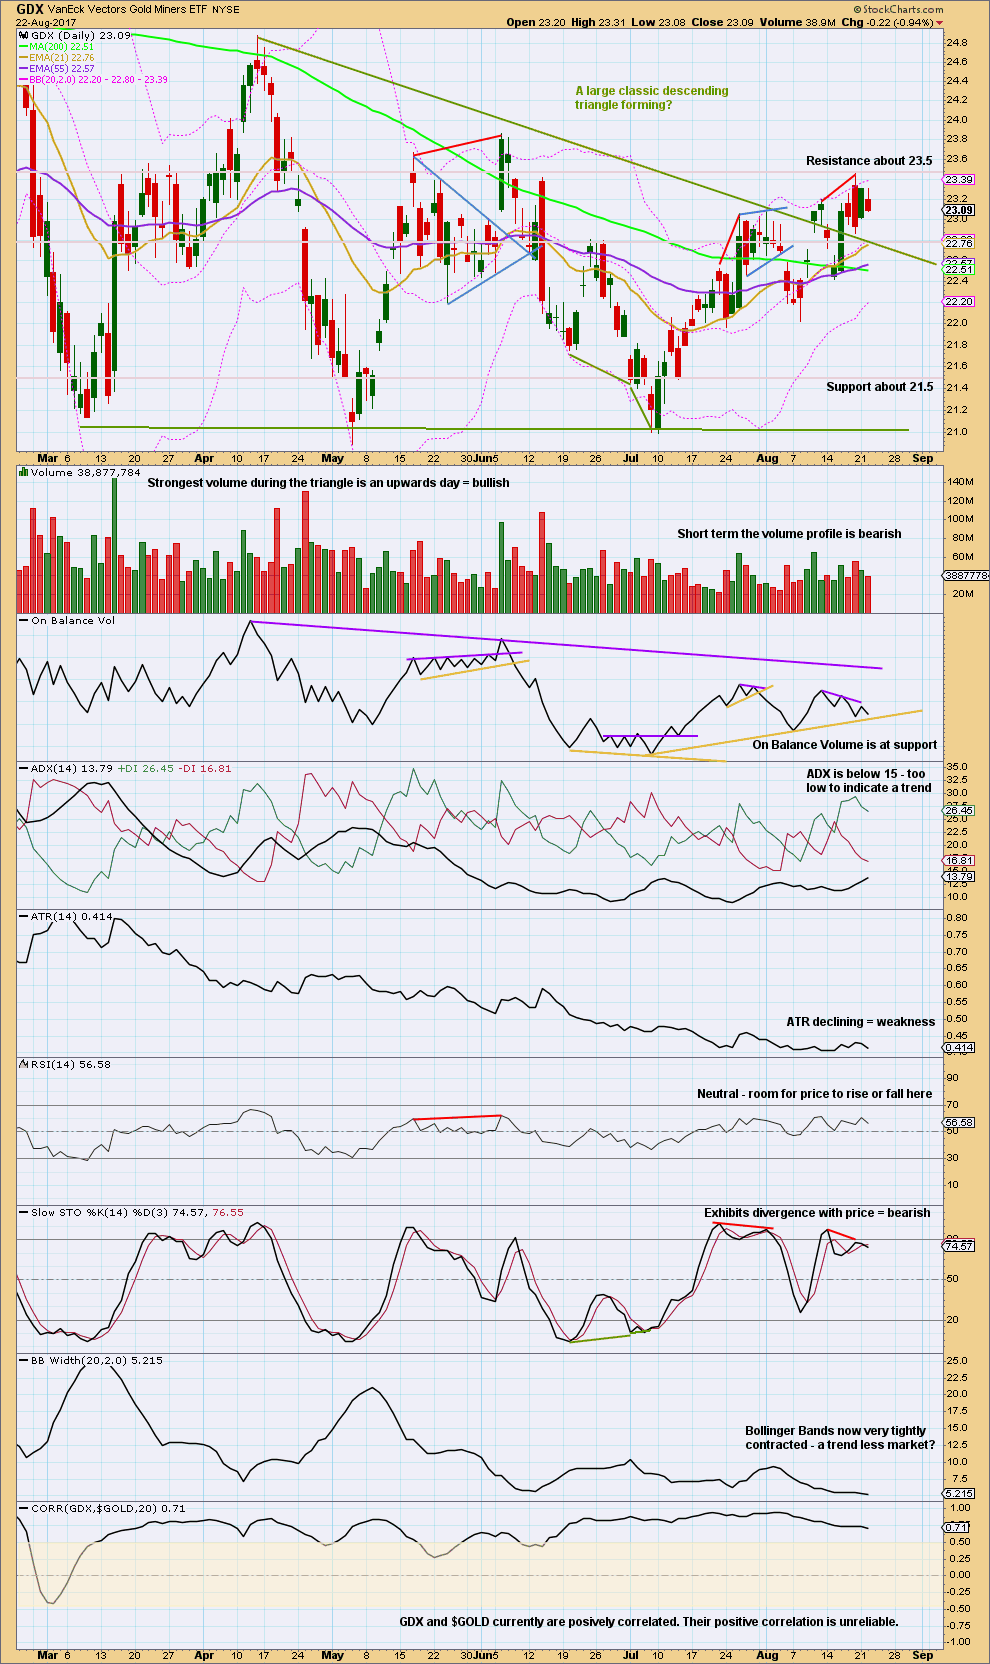
The descending triangle no longer looks right. GDX is still expected to be in a large consolidation, just not a triangle. New support and resistance zones are outlined. Resistance is about 24.85 to 23.85, and support is a smaller zone about 21.15 to 20.90. During this consolidation, it is still an upwards day which has strongest volume suggesting an upwards breakout is more likely than downwards.
However, the signal from volume here regarding the breakout is not very clear. The next three strongest days are all downwards days.
Bollinger Bands continue to be tightly contracted and ATR continues to decline. This strongly suggests a large consolidation.
We need to wait for the breakout from the support or resistance zones to have confidence in the next trend for GDX. An upwards breakout should have good support from volume. A downwards breakout does not need to have support from volume, but if it does then more confidence may be had in it.
Published @ 10:29 p.m. EST.
Pretty decent close with gold staying over 1290 (1295 in the futures Dec contract)). Looking kinda good and much less scarier than yesterday
Potential again exists for an imminent gold breakout accompanied by, and potentially caused by, a stock market mini waterfall. Could be within 1-2 days even. I bought a few way otm spy puts as well but the bigger bet is on gld breakout, although I think it is also very possible that it may be another false breakout, meaning a small window in time for profit taking (in line with Lara’s ending contracting diagonal count). The main reason for this thought is the prolonged and continued gold stock relative weakness. But like everything else, this is not set in stone and could change any day
Non Farm Payroll on Friday should move the markets strongly.
Hi Lara. NFP is next Friday. I think the current movement and direction might be resolved before then. I’m not sure what the catalyst will be but thinking it could be a stock market swoon of some sort, brought about by political or geopolitical concerns. There is also other economic data coming out tomorrow morning and Friday, but not as big as NFP
Preferred hourly chart updated:
Another small range inside day. That does actually tell us something. This absolutely does not look like the start of a third wave up at three degrees, it’s far too sluggish for that.
The lack of strength favours this preferred wave count. A fifth wave of an ending diagonal should be weak.
It still needs to make a new high above 1,300.53 to avoid a truncation, diagonals almost never have truncated fifth waves, so the probability of a new high is very high indeed if this is the right wave count.
Once it’s done that look out for an overthrow of the i-iii trend line, then a quick reversal.
Hi Lara – are you expecting Silver to continue higher as gold falls after this wave completes?
Not necessarily.
I can see a wave count with Silver also moving lower. For my second daily chart intermediate (B) could be an expanded flat.
I’ll be updating Silver later today and include a chart of the idea.
Dreamer, Alan
You guys on vacation? Miss your comments Lol.
I’m here. Just monitoring a few GDX counts in the background. Waiting for the market to give some more clues as to it’s intentions. I think the chop within the trading range is wearing us all down. I’ve never seen comments so low. I’m sure they will pickup once we finally get some price movement. Patience is key now…
😴 🙂
Very slow and sluggish price behaviour indeed. And it seems to be affecting the interaction of this membership, yes.
“Now is the winter of our discontent…” etc. etc.
A bit of poetry perhaps? 🙂
(I also have been patiently waiting for the turn as I have been layering bearish credit spreads on this last move up.)