
An outside day on Friday finally saw some volatility return to the market. While the short term structure on the hourly Elliott wave count is changed, the expectation for the short term remains the same.
Summary: Upwards movement may continue early next week to a target at 1,317. If the Magee trend line is breached by one or two full daily candlesticks above it, then the alternate wave count would be preferred. But assume the larger bear market remains intact while price remains below that trend line.
New updates to this analysis are in bold.
Last monthly charts and alternate weekly charts are here, video is here.
Grand SuperCycle analysis is here.
MAIN ELLIOTT WAVE COUNT
WEEKLY CHART
Click chart to enlarge.
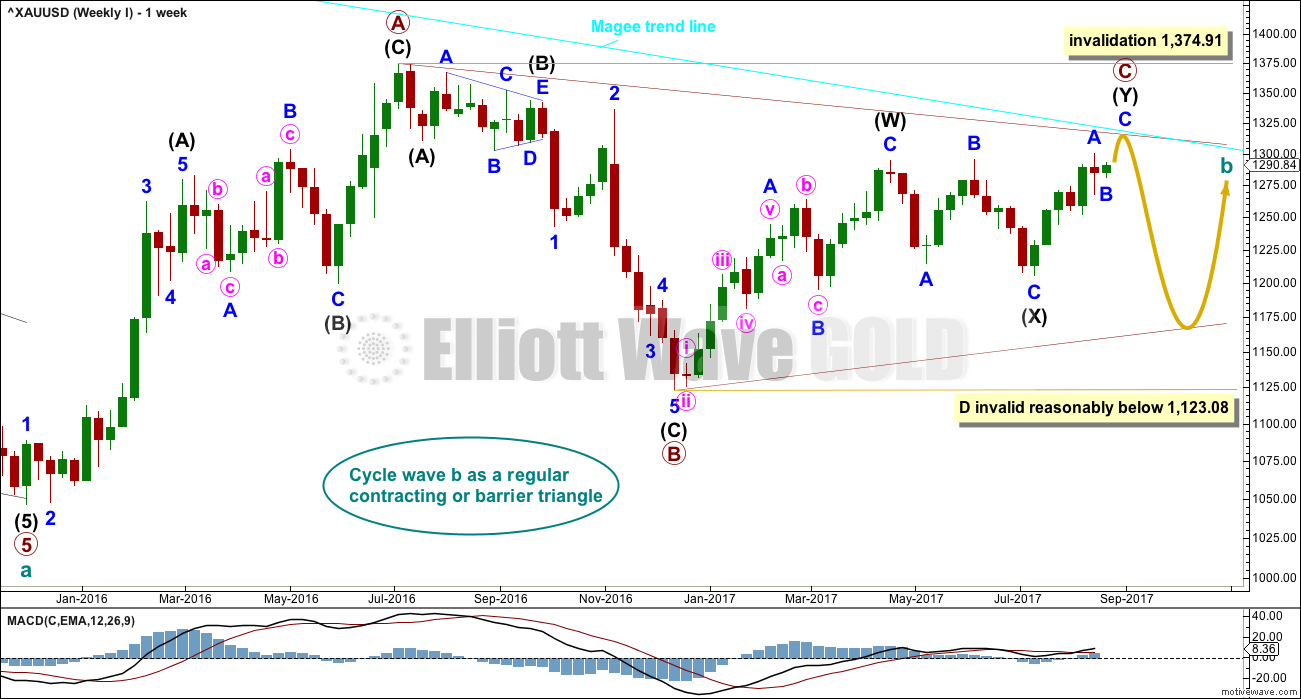
The Magee bear market trend line is added to the weekly charts. This cyan line is drawn from the all time high for Gold on the 6th of September, 2011, to the first major swing high within the following bear market on the 5th of October, 2012. This line should provide strong resistance.
To use this trend line in the way Magee describes, we should assume that price will find resistance at the line if it gets back up there. If the line is breached (by at least one or two full daily candlesticks above it), it will be signalling a major trend change from bear to bull. At that point the alternate Elliott wave count should be preferred.
At this stage, a triangle still looks possible and has the best fit for cycle wave b. It has strong support now from declining ATR and MACD hovering about zero.
Within a triangle, one sub-wave should be a more complicated multiple, which may be primary wave C. This is the most common sub-wave of the triangle to subdivide into a multiple.
Intermediate wave (Y) now looks like a developing zigzag at the weekly chart level, and minor wave B within it shows up with one red weekly candlestick. Primary wave C may end at the Magee trend line.
Primary wave D of a contracting triangle may not move beyond the end of primary wave B below 1,123.08. Contracting triangles are the most common variety.
Primary wave D of a barrier triangle should end about the same level as primary wave B at 1,123.08, so that the B-D trend line remains essentially flat. This involves some subjectivity; price may move slightly below 1,123.08 and the triangle wave count may remain valid. This is the only Elliott wave rule which is not black and white.
Finally, primary wave E of a contracting or barrier triangle may not move beyond the end of primary wave C above 1,295.65. Primary wave E would most likely fall short of the A-C trend line. But if it does not end there, then it can slightly overshoot that trend line.
Primary wave A lasted 31 weeks, primary wave B lasted 23 weeks, and primary wave C may now have just completed its 36th week. A double zigzag may be expected to be longer lasting than single zigzags within a triangle, and so this continuation of primary wave C is entirely acceptable and leaves the wave count with the right look at this time frame.
DAILY CHART
Click chart to enlarge.
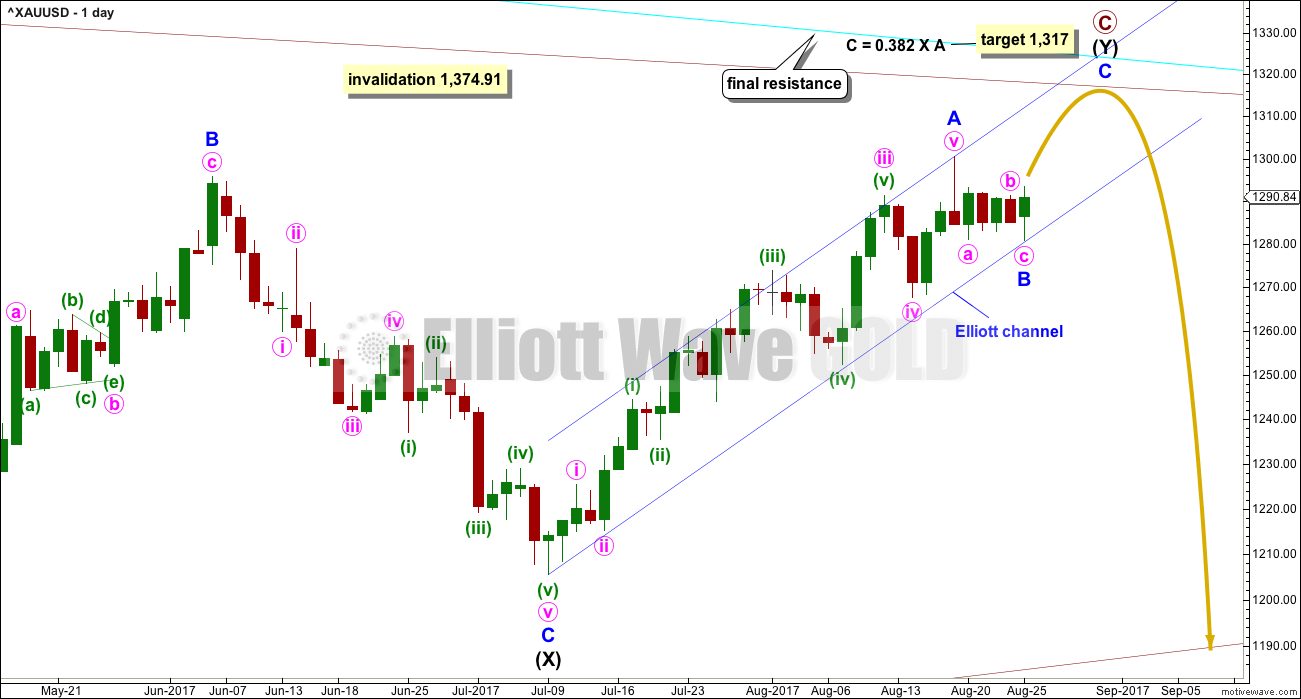
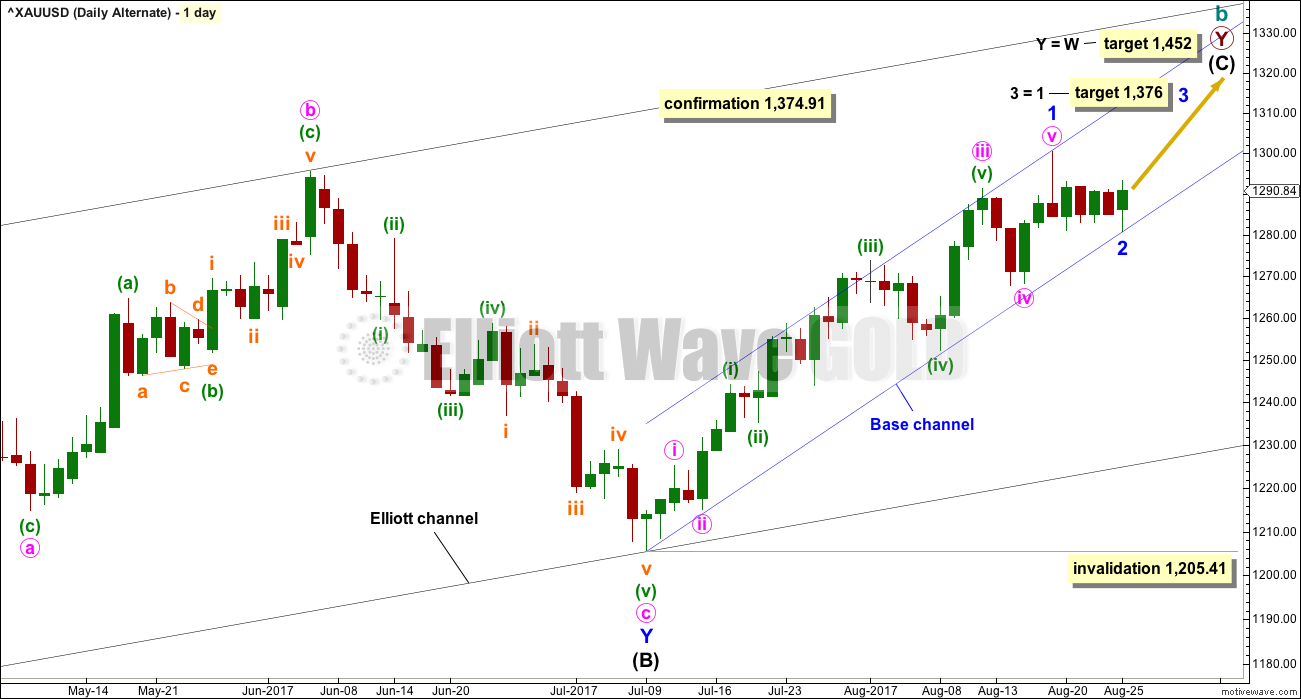
The cyan Magee trend line should offer very strong resistance. This wave count does not expect it to be breached. Recently, price has found resistance a little below the line, so it may not be touched.
At the end of this week, after the downwards spike on Friday, the last wave count which saw an ending diagonal continuing for minor wave C no longer works. The wave lengths still meet Elliott wave rules, but for a contracting diagonal the trend lines must converge. They now diverge, so that wave count is no longer valid.
The downwards spike on Friday may have been the end of minor wave B within intermediate wave (Y). If minor wave B is over, then minor wave C has started and would very likely make at least a slight new high above the end of minor wave A at 1,282.29 to avoid a truncation. The target calculated assumes the Magee trend line will not be breached.
The Elliott channel is slightly adjusted. Minor wave C may end either mid way within the channel, or about the upper edge. When this channel is breached by subsequent downwards movement, it would then indicate a trend change.
HOURLY CHART
Click chart to enlarge.
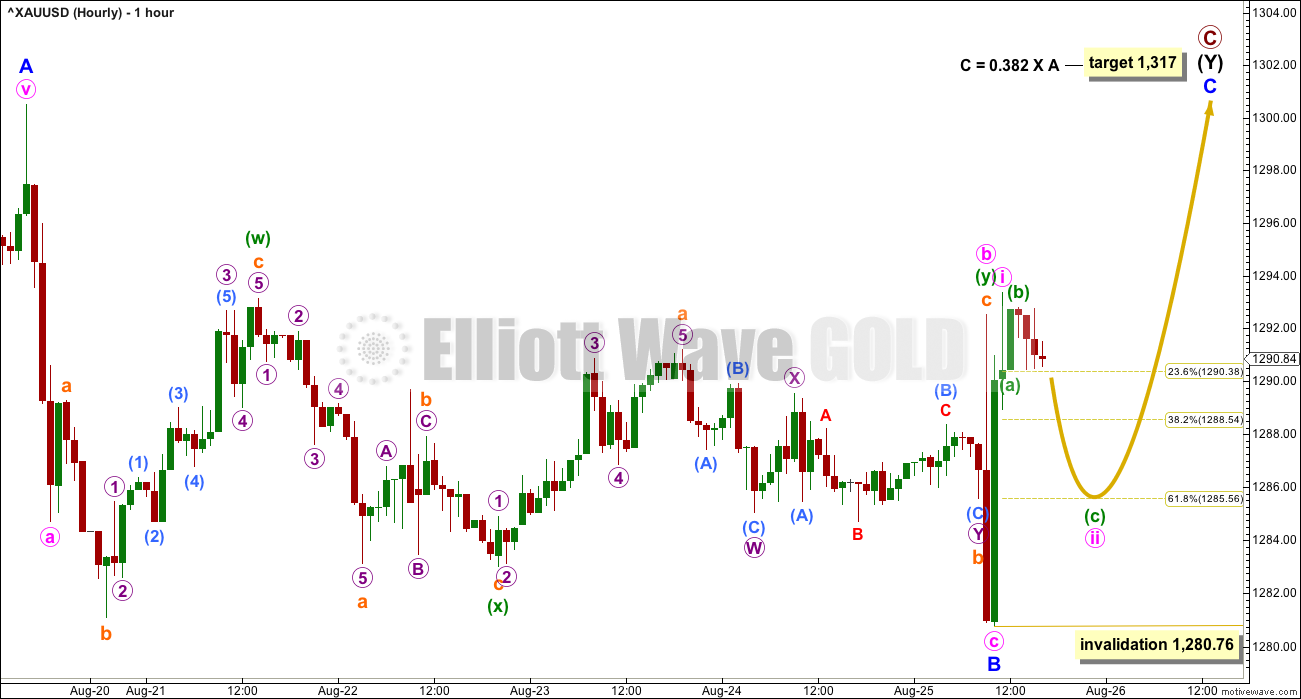
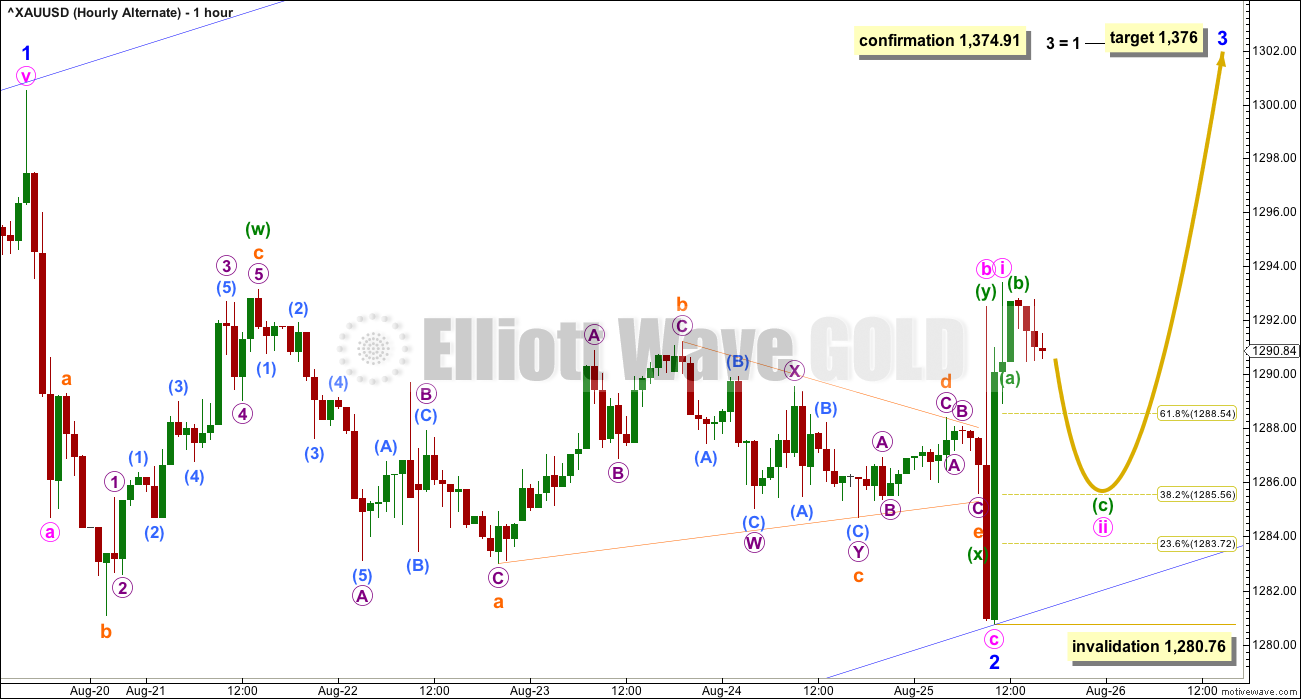
There is more than one way to label the subdivisions within the correction of minor wave B. This main wave count shows one way. The alternate below shows another which would also work for this main wave count.
Here, minor wave B is labelled as a zigzag and minute wave b within it as a double combination: flat – X – zigzag.
The Fibonacci ratio applied to the target is chosen to fit with expected resistance at the Magee trend line.
Minor wave C must be a five wave structure, either an impulse (most likely) or an ending diagonal (less likely). It may last a few days. Within minor wave C, minute wave ii may not move beyond the start of minute wave i below 1,280.76.
ALTERNATE ELLIOTT WAVE COUNT
WEEKLY CHART
Click chart to enlarge.
This wave count has been published only in historical analysis. At this stage, it will be published on a daily basis.
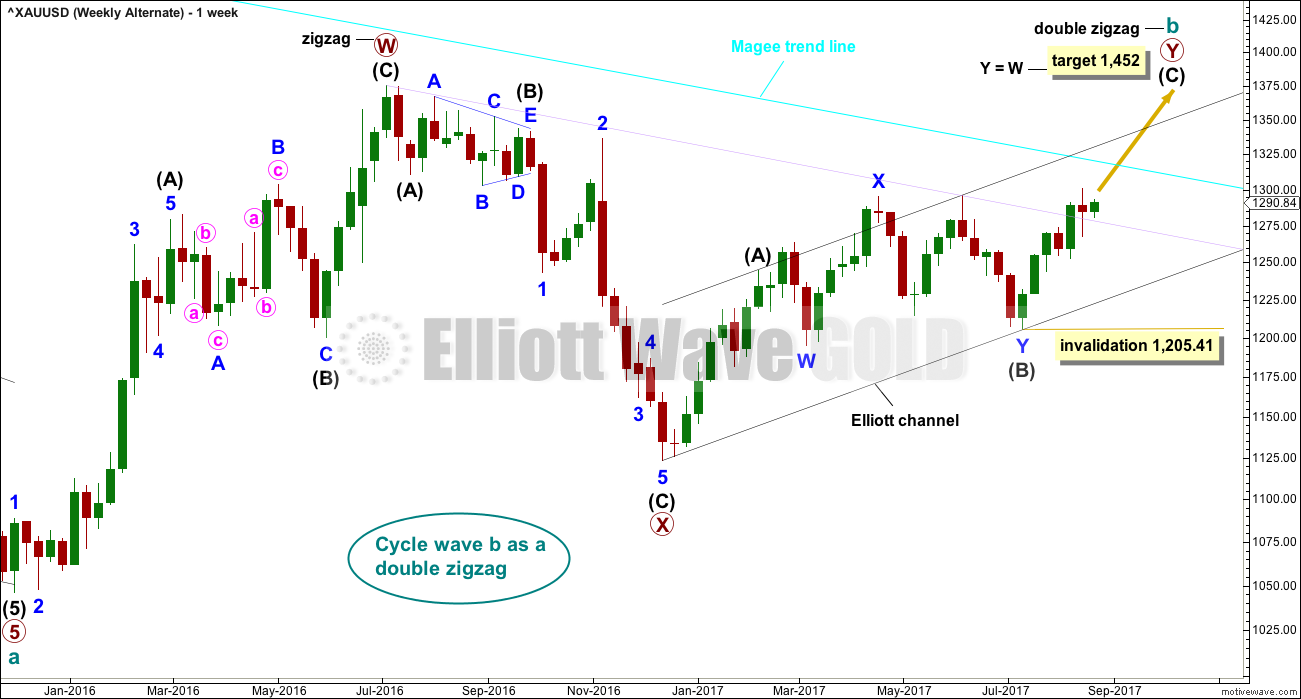
There are more than 23 possible corrective structures that B waves may take, and although cycle wave b fits best at this stage as a triangle (main wave count), it may still be another structure. This wave count looks at the possibility that it may be a double zigzag.
If cycle wave b is a double zigzag, then current upwards movement may be part of the second zigzag in the double, labelled primary wave Y.
The target remains the same as previously published for this wave count.
Along the way up, some resistance should be expected at the cyan Magee trend line. Because this wave count requires price to break above the Magee trend line, it must be judged to have a lower probability for this reason. This trend line is tested multiple times and goes back to 2011. It is reasonable to expect price to find resistance there, until proven otherwise.
Within intermediate wave (C), no second wave correction may move beyond the start of its first wave below 1,205.41.
DAILY CHART
Click chart to enlarge.
Intermediate wave (C) may be unfolding as an impulse.
Within the impulse, minor waves 1 and 2 would now be complete.
At the end of this week, the structure of minor wave 1 is adjusted to show it may have ended at the last high. Minor wave 2 may have ended at Friday’s low. This resolves the problem in last analysis of too much overlapping and a lack of momentum for the start of minor wave 3.
However, it is unusual for second wave corrections to be this shallow.
With minor wave 1 a very long extension, the Fibonacci ratio of equality is used for a target for minor wave 3 now.
If minor wave 2 continues lower, it may move beyond the start of minor wave 1 below 1,205.41.
HOURLY CHART
Click chart to enlarge.
1-2-3 of an impulse subdivides 5-3-5, which is exactly the same as A-B-C of a zigzag. The subdivisions of both the main and this alternate wave count may be the same.
This hourly chart shows an alternate way to label the correction of minor wave 2. This would also work for minor wave B on the main wave count.
Here, minor wave 2 is still labelled a zigzag and minute wave b within it is still labelled a combination. But here the combination sees minuette wave (x) as a triangle.
Minute wave ii may not move beyond the start of minute wave i below 1,280.76.
TECHNICAL ANALYSIS
WEEKLY CHART
Click chart to enlarge. Chart courtesy of StockCharts.com.
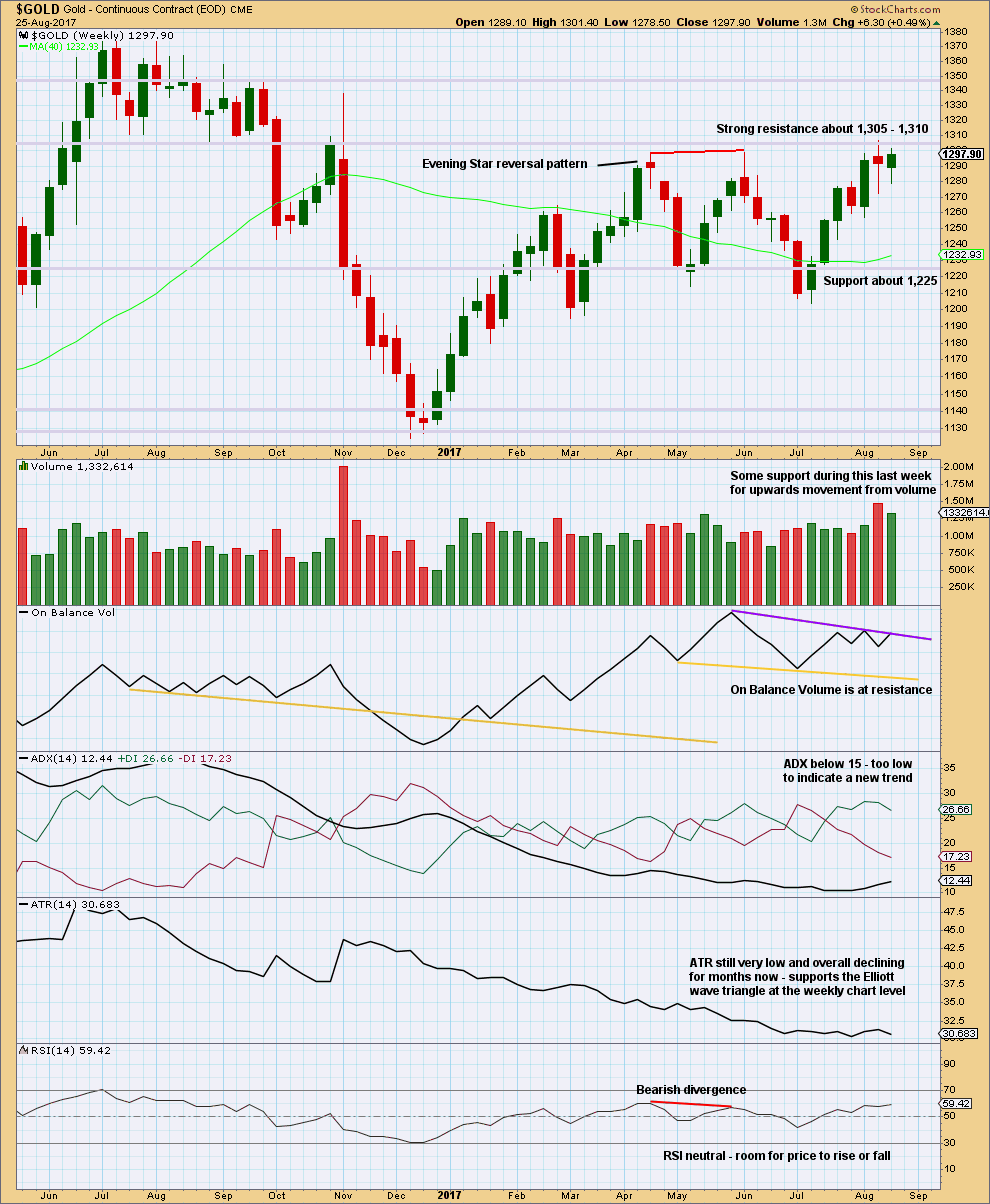
Resistance about 1,305 – 1,310 continues to hold. Each time resistance is tested, and holds, it is strengthened.
Volume is slightly bullish. The long lower wicks on the last two weekly candlesticks is bullish.
The resistance line for On Balance Volume has only been tested twice and is not long held, so it does not offer good technical significance. It offers some weak resistance. If it is breached, that would be a weak bullish signal.
DAILY CHART
Click chart to enlarge. Chart courtesy of StockCharts.com.
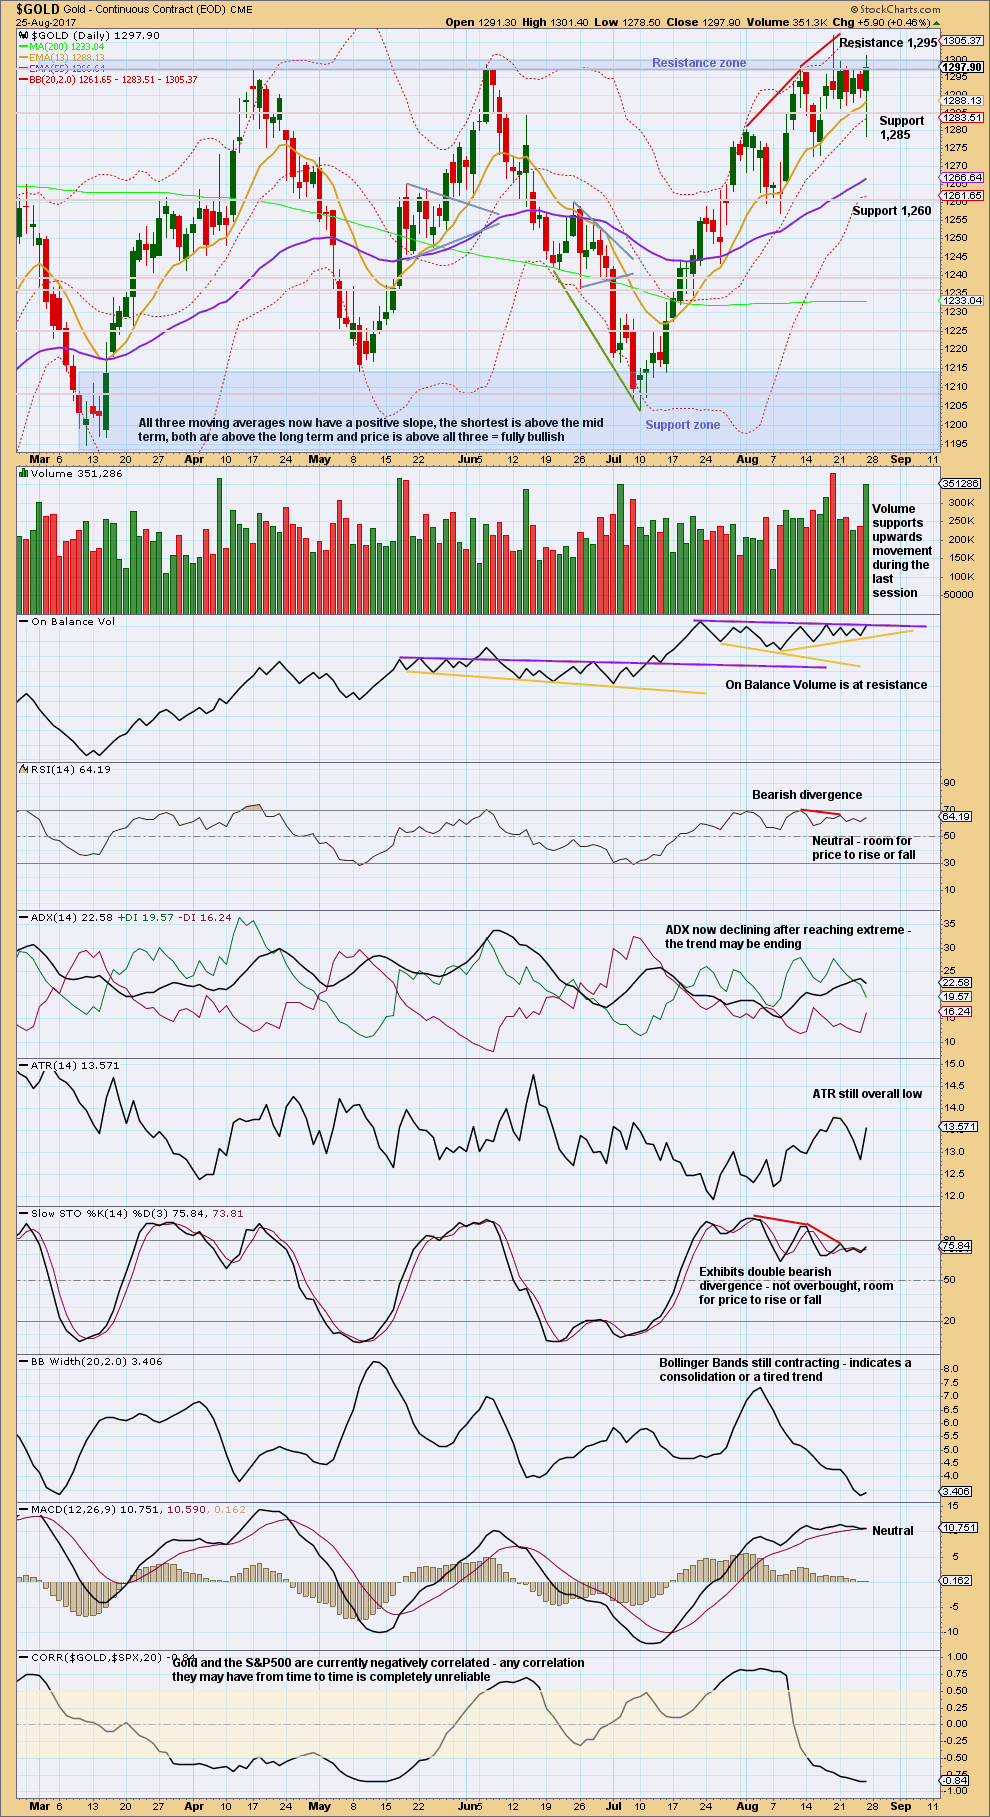
During the long consolidation phase, it is now the 18th of August that has strongest volume. This session moved price higher with a higher high and a higher low, but the balance of volume during the session was downwards. There was strong support during the session for downwards movement, which created the Shooting Star candlestick pattern.
This now suggests that the breakout from this large consolidation may more likely be downwards than upwards, and this now agrees with the main Elliott wave count.
Above resistance at 1,305 to 1,310 is further resistance up to about 1,320. Price continues to find very strong resistance about 1,305.
The pennant pattern has failed. The breakout should have been upwards, but the downwards spike for Friday negates this.
The long lower wick on Friday’s candlestick is bullish. While volume supports upwards movement during Friday’s session, it is still not as strong as support for downwards movement on the 18th of August.
The resistance line on On Balance Volume has not been very long held, but it is close to horizontal and has been tested now five times. A breach above it would be a reasonable bullish signal. With On Balance Volume and price both offering strong resistance at this time, it looks like the upside may be quite limited. This does not support the short term expectation on the Elliott wave count for a spike up to about 1,320 before a trend change.
It looks like the trend may be tired and nearing a change.
GDX
DAILY CHART
Click chart to enlarge. Chart courtesy of StockCharts.com.
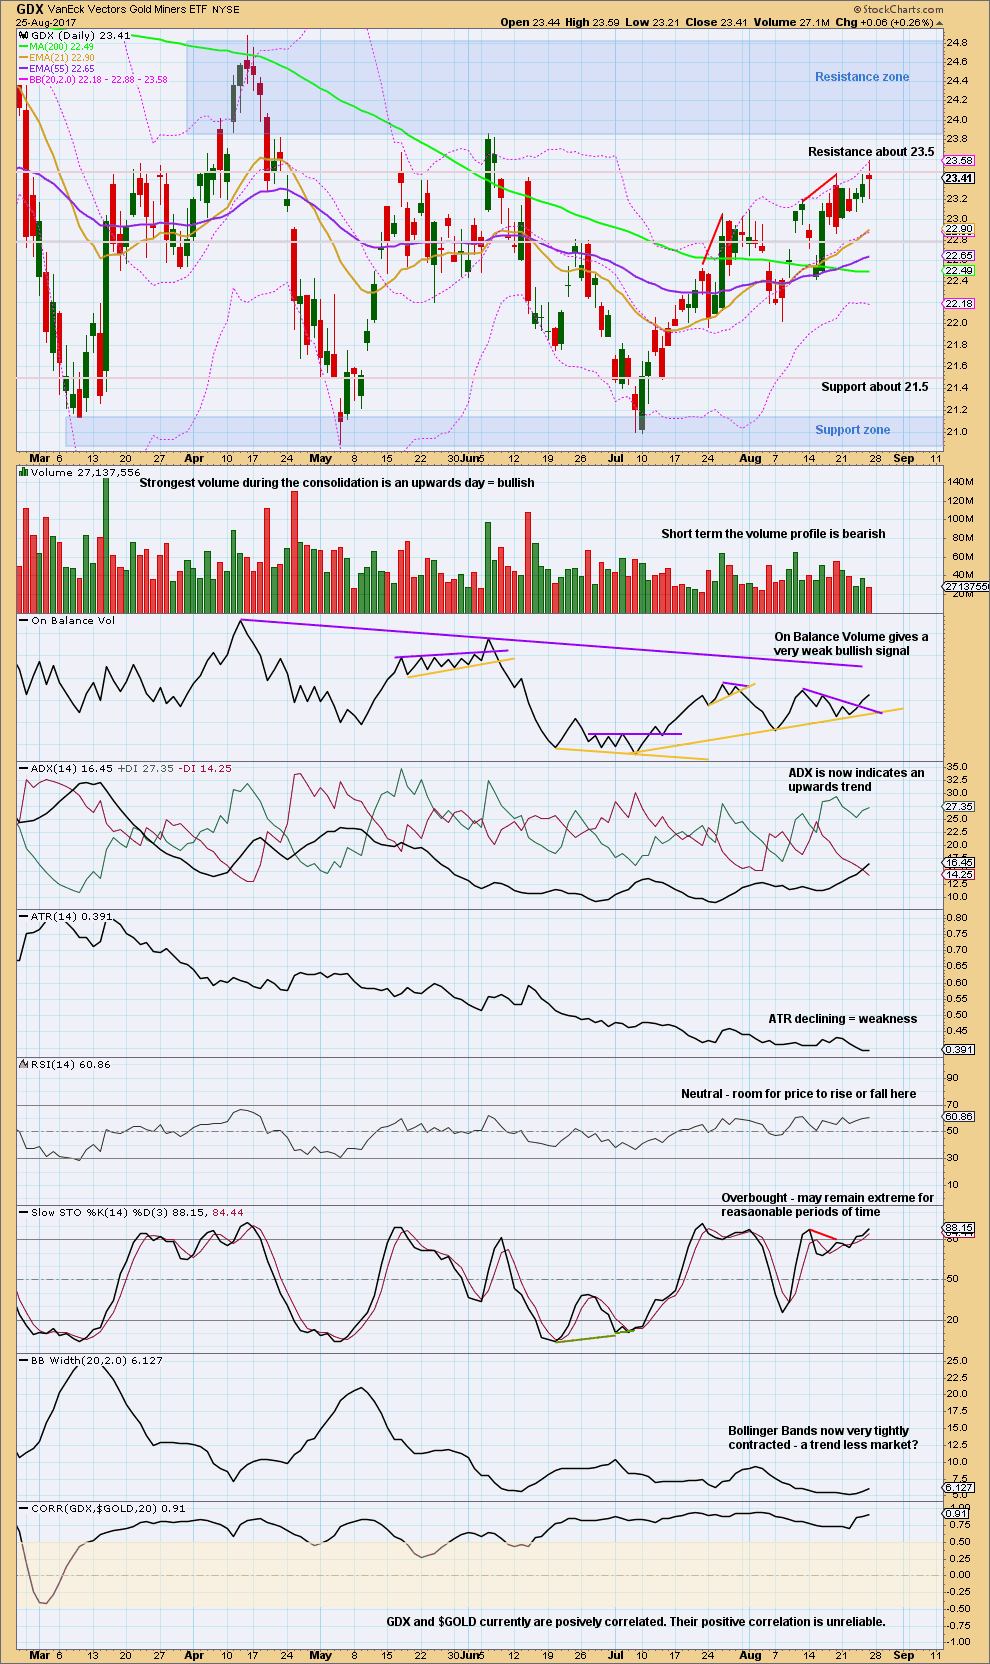
GDX is expected to be in a large consolidation. New support and resistance zones are outlined. Resistance is about 24.85 to 23.85, and support is a smaller zone about 21.15 to 20.90. During this consolidation, it is still an upwards day which has strongest volume suggesting an upwards breakout is more likely than downwards.
However, the signal from volume here regarding the breakout is not very clear. The next three strongest days are all downwards days.
Bollinger Bands continue to be tightly contracted and ATR continues to decline. This strongly suggests a large consolidation.
Price continues to find resistance about 23.50, only closing slightly above this point on Friday.
The rise in price is not supported by volume. With ATR still declining, this market is still consolidating. The next direction for GDX is unclear.
Published @ 01:08 a.m. EST on 27 August, 2017.
This is real interesting now as the launch of another missile by the DRPK really complicated things. The missile going OVER Japan is a more serious provocation. Kim is certainly asking for the world to respond. Usually “news” events account for quick spikes that are often quickly reversed….but this one may turn into something much bigger.
As Lara states, with the late day spike, gold stopped right at the Magee trendline, so it certainly has meaning…
Welcome to The ALT
?? Price is less than $1 above the target and still below the Magee trend line.
Well that’s weird. On my daily charts the high is 1,316.73. On my hourly charts it’s 1,322.03.
I’m going with the hourly chart.
Anyway, at that high price is still just below the Magee trend line. Both wave counts remain valid, the main count is still preferred while price remains below that line. That line differentiates the wave counts.
For the main count it has to turn now.
The target is now close. There should be very strong resistance at the Magee trend line. This may end now within the next 24 hours?
Minor C is not showing it’s subdivisions at higher time frames. Minute ii did not move lower, it was already done and very shallow. So minute iv should not show up on the daily chart.
Use the best fit channel as the very first indication there may have been a trend change. When that channel is breached by downwards movement expect it has turned.
Alternately, if the Magee trend line is convincingly breached this week favour the very bullish alternate.
If there is an ending diagonal forming on the GDX hourly, it may be complete or it may continue up no higher than 23.90. Let’s see what happens this week.
https://www.tradingview.com/x/N4IfMVtQ/
GDX keeps giving mixed signals while price slowly climbs.
Bullish:
>Price closed above the trendline in place since February, although there is no full daily candlestick above the trendline (yet).
>Bullish alignment of most MA’s, although the 50MA is still below the 200MA.
Bearish:
>Volume continues to decline and has given little support for upwards movement
>Price may be forming an ending contracting diagonal
Even if there is a full breakout of the trendline in the next couple of days, the triangle could just be expanding as opposed to a more bullish move.
No clear bullish signs yet.
https://www.tradingview.com/x/Ed9n1rjx/
GDX high at 24.13. I want to short this but GOLD is not showing any sign of backing off….