
A break below the channel and then below 1,260.03 has indicated the second hourly Elliott wave count was correct.
Summary: Gold has likely had a trend change. The target is at 1,184. This may be met in about five weeks.
Always use a stop. Invest only 1-5% of equity on any one trade.
New updates to this analysis are in bold.
Last monthly charts and alternate weekly charts are here, video is here.
Grand SuperCycle analysis is here.
MAIN ELLIOTT WAVE COUNT
WEEKLY CHART
Click chart to enlarge.
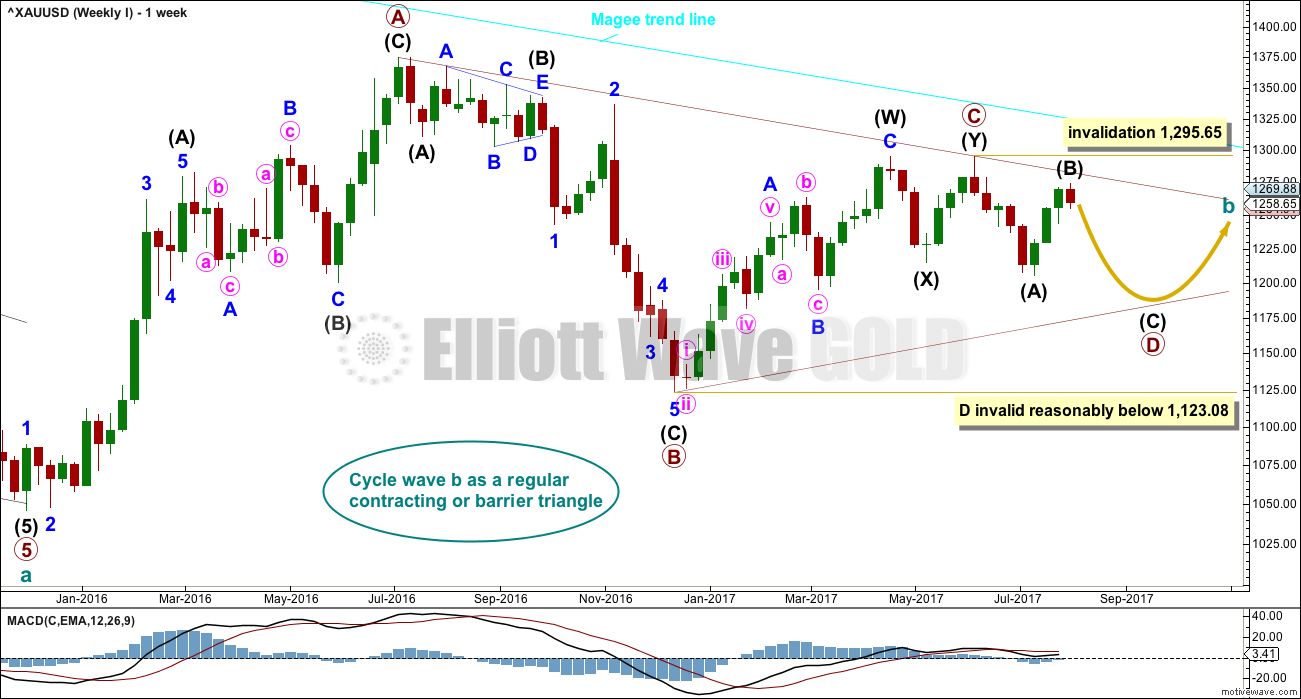
The Magee bear market trend line is added to the weekly charts. This cyan line is drawn from the all time high for Gold on the 6th of September, 2011, to the first major swing high within the following bear market on the 5th of October, 2012. This line should provide strong resistance.
At this stage, a triangle still looks possible and has the best fit for cycle wave b. It has some support from declining ATR and MACD now beginning to hover about zero.
Within a triangle, one sub-wave should be a more complicated multiple, which may be primary wave C. This is the most common sub-wave of the triangle to subdivide into a multiple.
Primary wave D of a contracting triangle may not move beyond the end of primary wave B below 1,123.08. Contracting triangles are the most common variety.
Primary wave D of a barrier triangle should end about the same level as primary wave B at 1,123.08, so that the B-D trend line remains essentially flat. This involves some subjectivity; price may move slightly below 1,123.08 and the triangle wave count may remain valid. This is the only Elliott wave rule which is not black and white.
Triangles normally adhere very well to their trend lines. So far the A-C trend line has been tested 11 times; this line has very strong technical significance. If this wave count is correct, then intermediate wave (B) may have ended now just short of this trend line, finding strong resistance just below it.
Finally, primary wave E of a contracting or barrier triangle may not move beyond the end of primary wave C above 1,295.65. Primary wave E would most likely fall short of the A-C trend line. But if it does not end there, then it can slightly overshoot that trend line.
Primary wave A lasted 31 weeks, primary wave B lasted 23 weeks, and primary wave C may have been complete in 25 weeks.
Primary wave D should now be expected to last a Fibonacci 13 or 21 weeks in total. It has now lasted 8 weeks, so a further 5 weeks minimum would now be expected.
DAILY CHART
Click chart to enlarge.
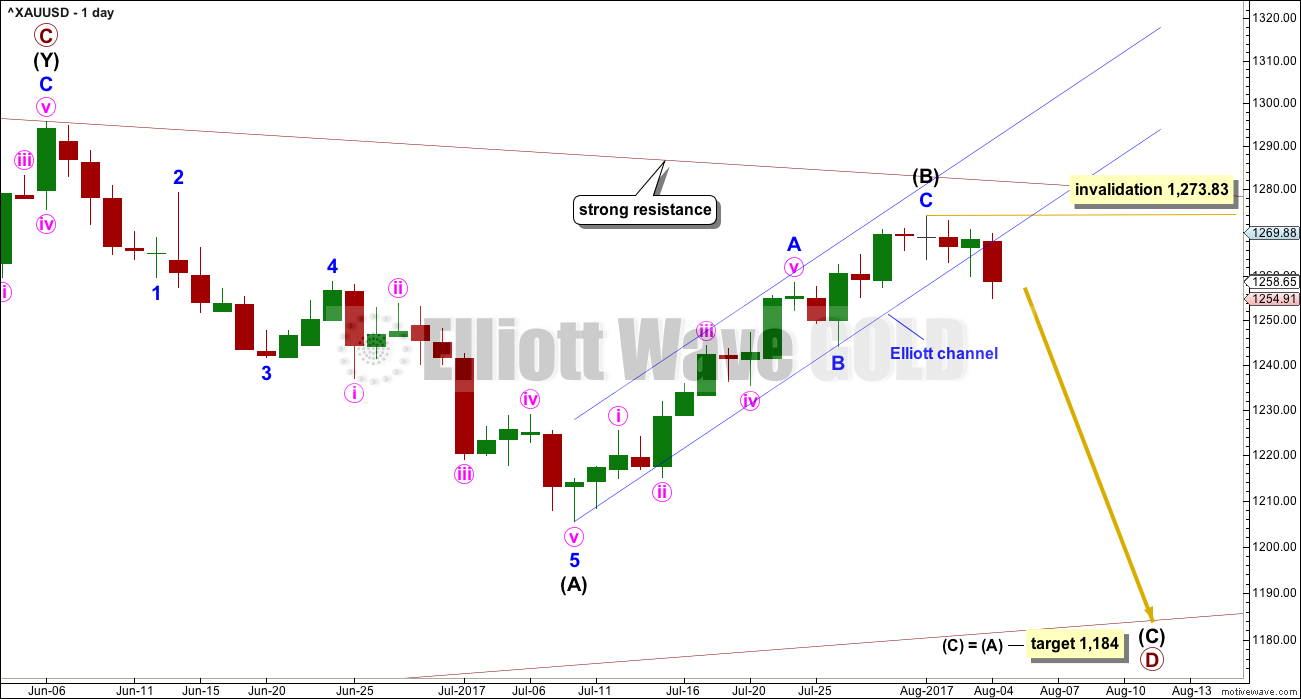
The channel about intermediate wave (B) has been fully breached at the hourly chart level. Monday’s session will most likely complete a full breach also at the daily chart level. This is a strong indication that intermediate wave (B) is over and intermediate wave (C) has begun.
The target calculated uses the most common Fibonacci ratio for intermediate wave (C).
Within intermediate wave (C), no second wave correction may move beyond the start of its first wave above 1,273.83.
HOURLY CHART
Click chart to enlarge.
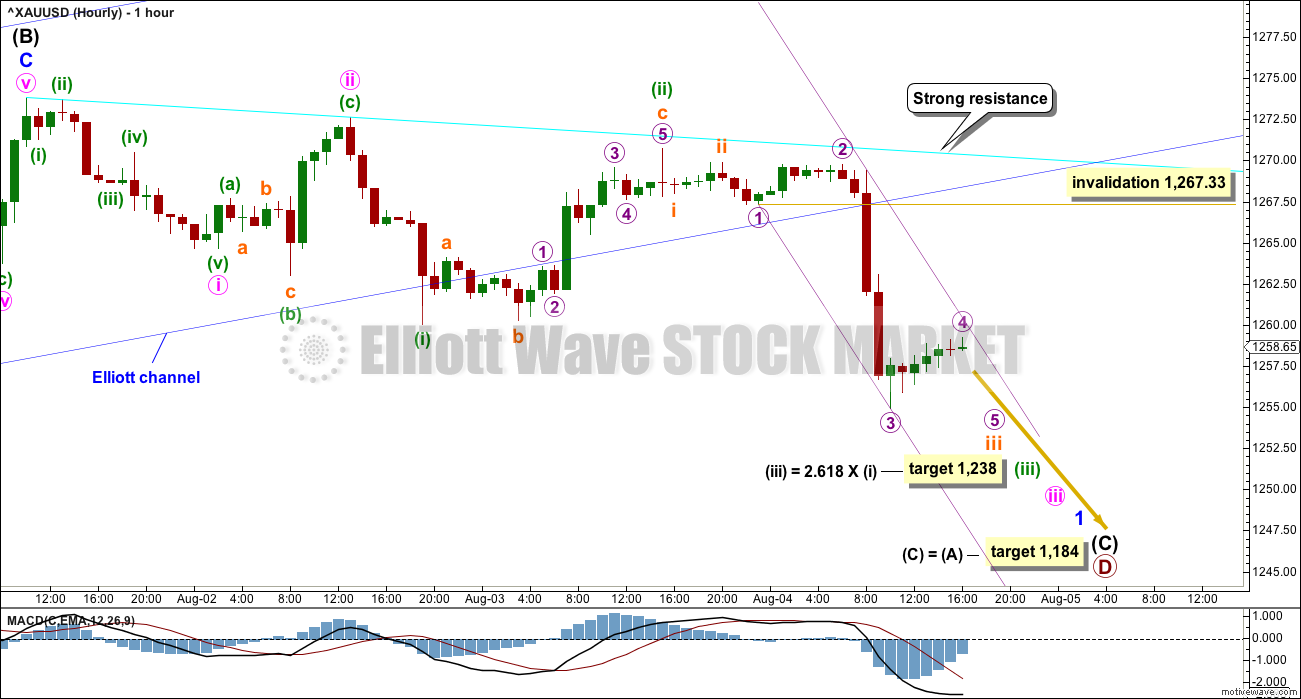
The first five down is incomplete. When minor wave 1 is complete, then a deep bounce should unfold for minor wave 2. This may turn up at the end of next week.
For now the structure downwards of minor wave 1 is incomplete, so further downwards movement would be expected overall next week.
Micro wave 4 may most likely be over, within a small best fit channel. If it continues, it may not move into micro wave 1 price territory above 1,267.33.
ALTERNATE ELLIOTT WAVE COUNT
WEEKLY CHART
Click chart to enlarge.
This wave count has been published only in historical analysis. At this stage, it will be published on a daily basis.
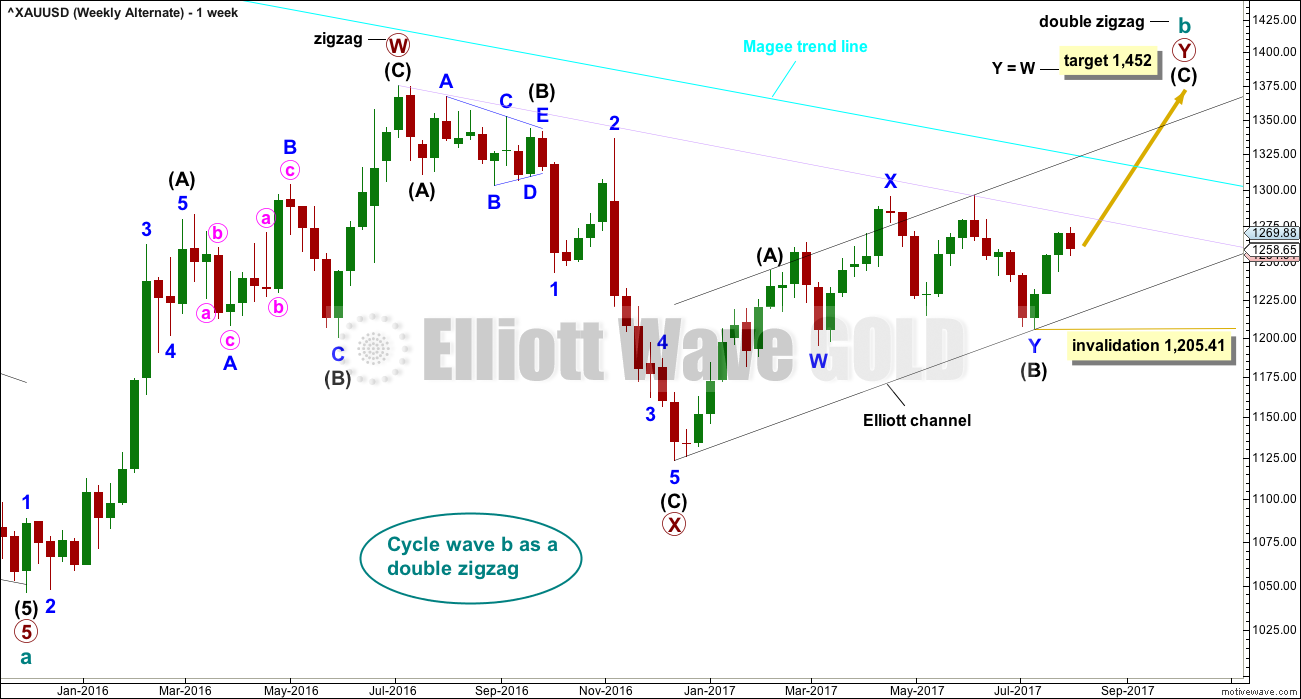
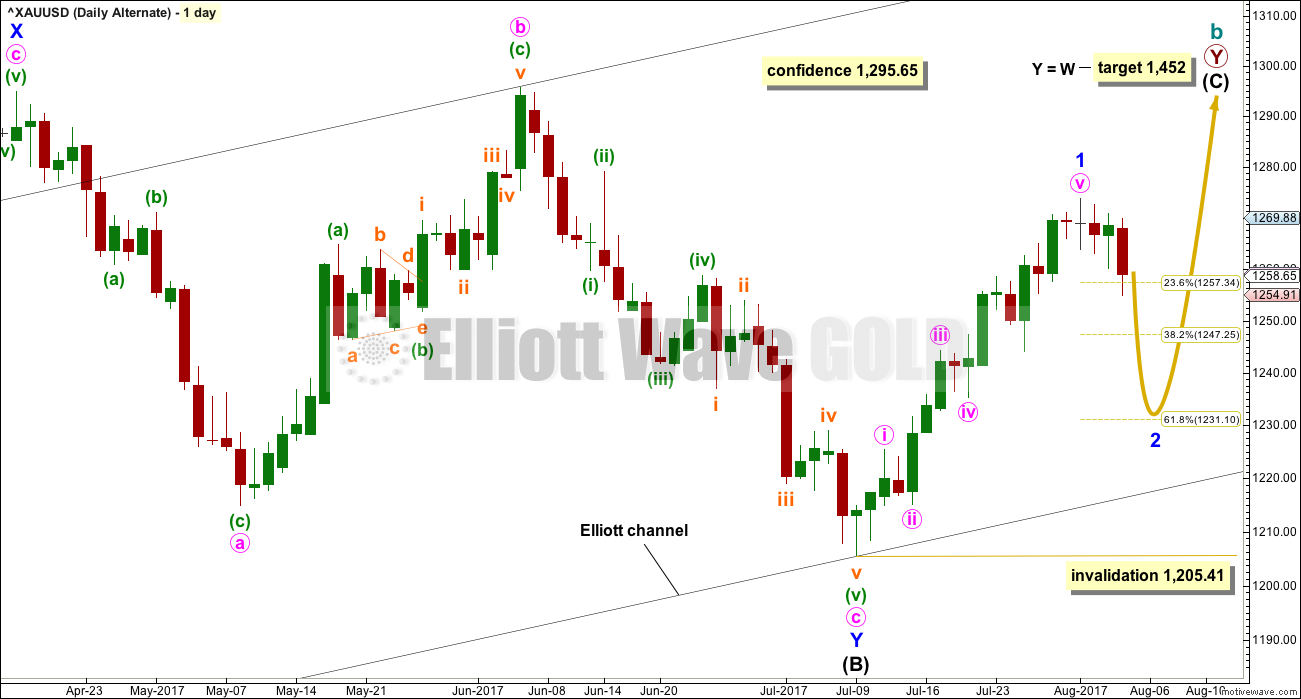
There are more than 23 possible corrective structures that B waves may take, and although cycle wave b fits best at this stage as a triangle (main wave count), it may still be another structure. This wave count looks at the possibility that it may be a double zigzag.
If cycle wave b is a double zigzag, then current upwards movement may be part of the second zigzag in the double, labelled primary wave Y.
The target remains the same as previously published for this wave count.
Along the way up, some resistance should be expected at the cyan Magee trend line.
Within intermediate wave (C), no second wave correction may move beyond the start of its first wave below 1,205.41.
DAILY CHART
Click chart to enlarge.
Intermediate wave (B) subdivides as a double flat correction: expanded flat – X – regular flat. While all the subdivisions have a neat fit, double flats are very rare structures. In my now 9 years of daily Elliott wave analysis I can say with certainty that I have only ever seen one before. For this reason, this wave count must be judged to have a low probability.
It will remain as labeled though because this labelling has a good fit, and threes and fives look as they are supposed to.
Intermediate wave (C) may be unfolding as an impulse.
Only minor wave 1 may have been over at the last high. Minor wave 2 may have begun. Minor wave 2 may reach down to the 0.618 Fibonacci ratio of minor wave 1 at 1,231.
Minor wave 2 may not move beyond the start of minor wave 1 below 1,205.41.
HOURLY CHART
Click chart to enlarge.
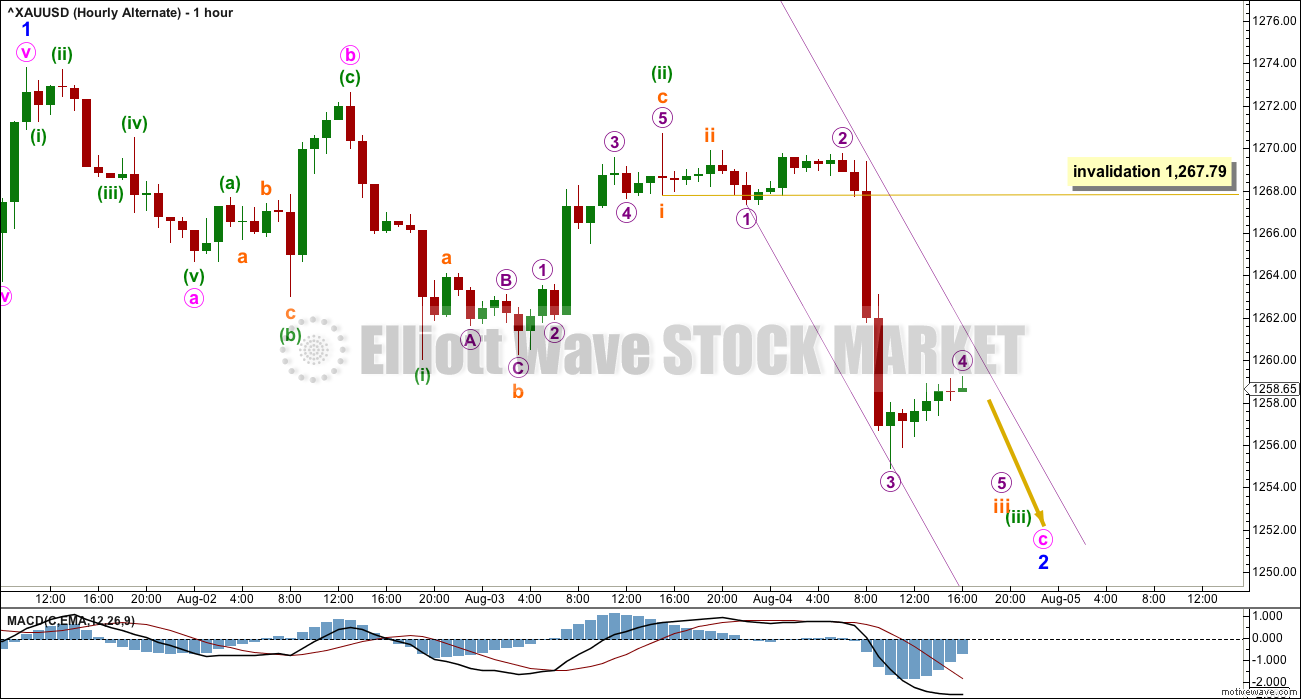
If only minor wave 1 was over at the last high, then the decline in volume and momentum at its end makes sense.
Minor wave 1 would have lasted 16 days. Minor wave 2 may be expected to last about three weeks also, so that the wave count has good proportions.
The most likely structure for minor wave 2 would be a zigzag. If the labelling here on this hourly chart is wrong, it may be in assuming minute waves a and b are over already. It is also possible that minute wave a is unfolding as an impulse and is incomplete.
Subminuette wave iv may not move into subminuette wave i price territory above 1,267.79.
TECHNICAL ANALYSIS
WEEKLY CHART
Click chart to enlarge. Chart courtesy of StockCharts.com.
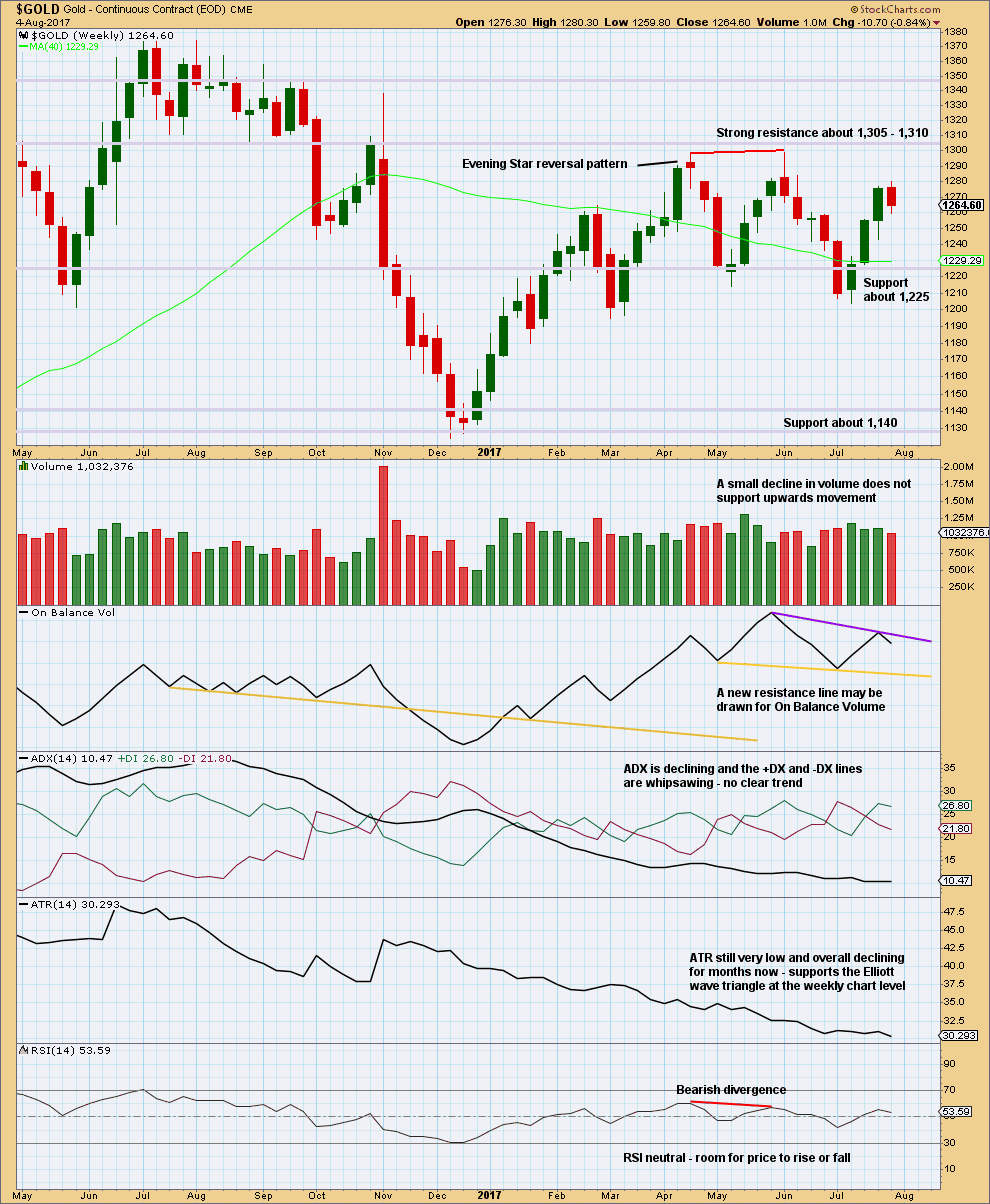
An upwards week closes with a red weekly candlestick.
To correctly analyse volume for this week it should be done at the daily chart level, to look “inside” the week.
On Balance Volume gives no signal this week. It is constrained.
ADX and ATR both support the main weekly Elliott wave count. This is what a triangle should look like.
DAILY CHART
Click chart to enlarge. Chart courtesy of StockCharts.com.
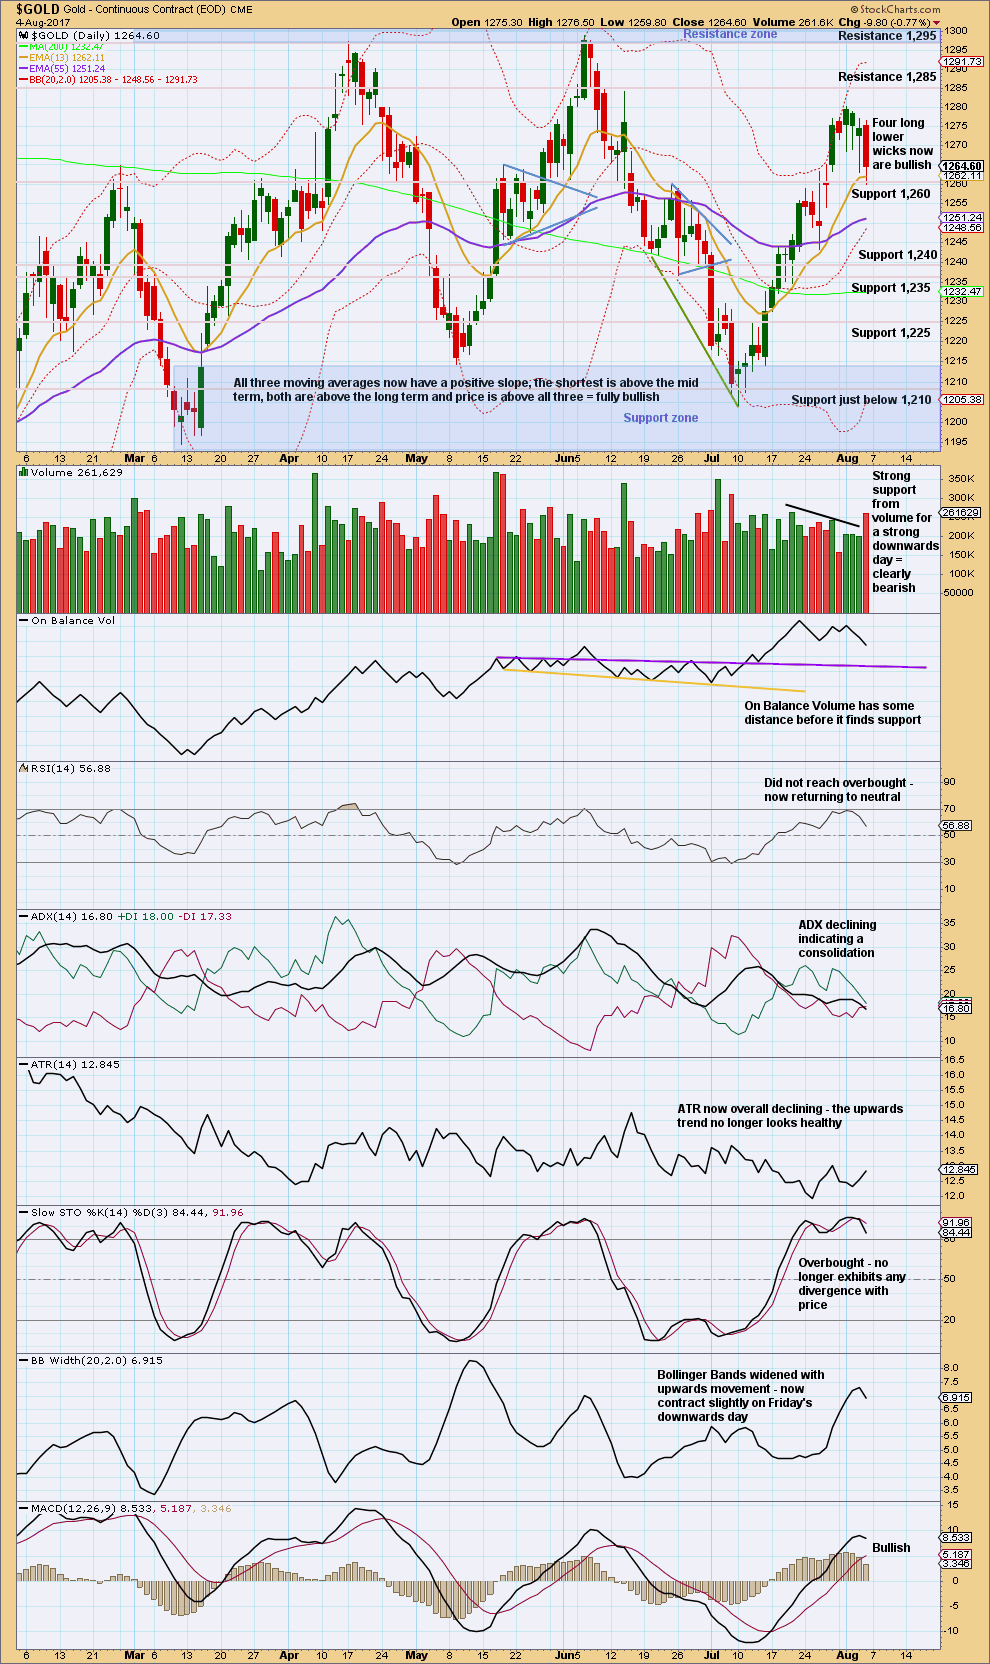
Stepping back and looking at the larger consolidation, Gold moved into a range back in February this year, delineated by support and resistance zones. During this consolidation, it is two upwards days of 7th of April and the 17th of May that have strongest volume. This suggests an upwards breakout is more likely than downwards, and it supports the alternate Elliott wave count and not the main Elliott wave count.
However, this signal is not a strong one. The third strongest day of the 18th of May is a downwards day, and it is very close in volume to the two upwards days.
Another day with a long lower candlestick wick again looks bullish, but so far this has not resulted in any upwards movement. This may be indicating an upcoming bounce.
Price is finding support about 1,260. Next support is about 1,240.
Friday’s strong movement has increased range and volume. This does not look like a small pullback within an upwards trend; the prior trend showed declining volume. This looks like a possible trend change.
GDX
DAILY CHART
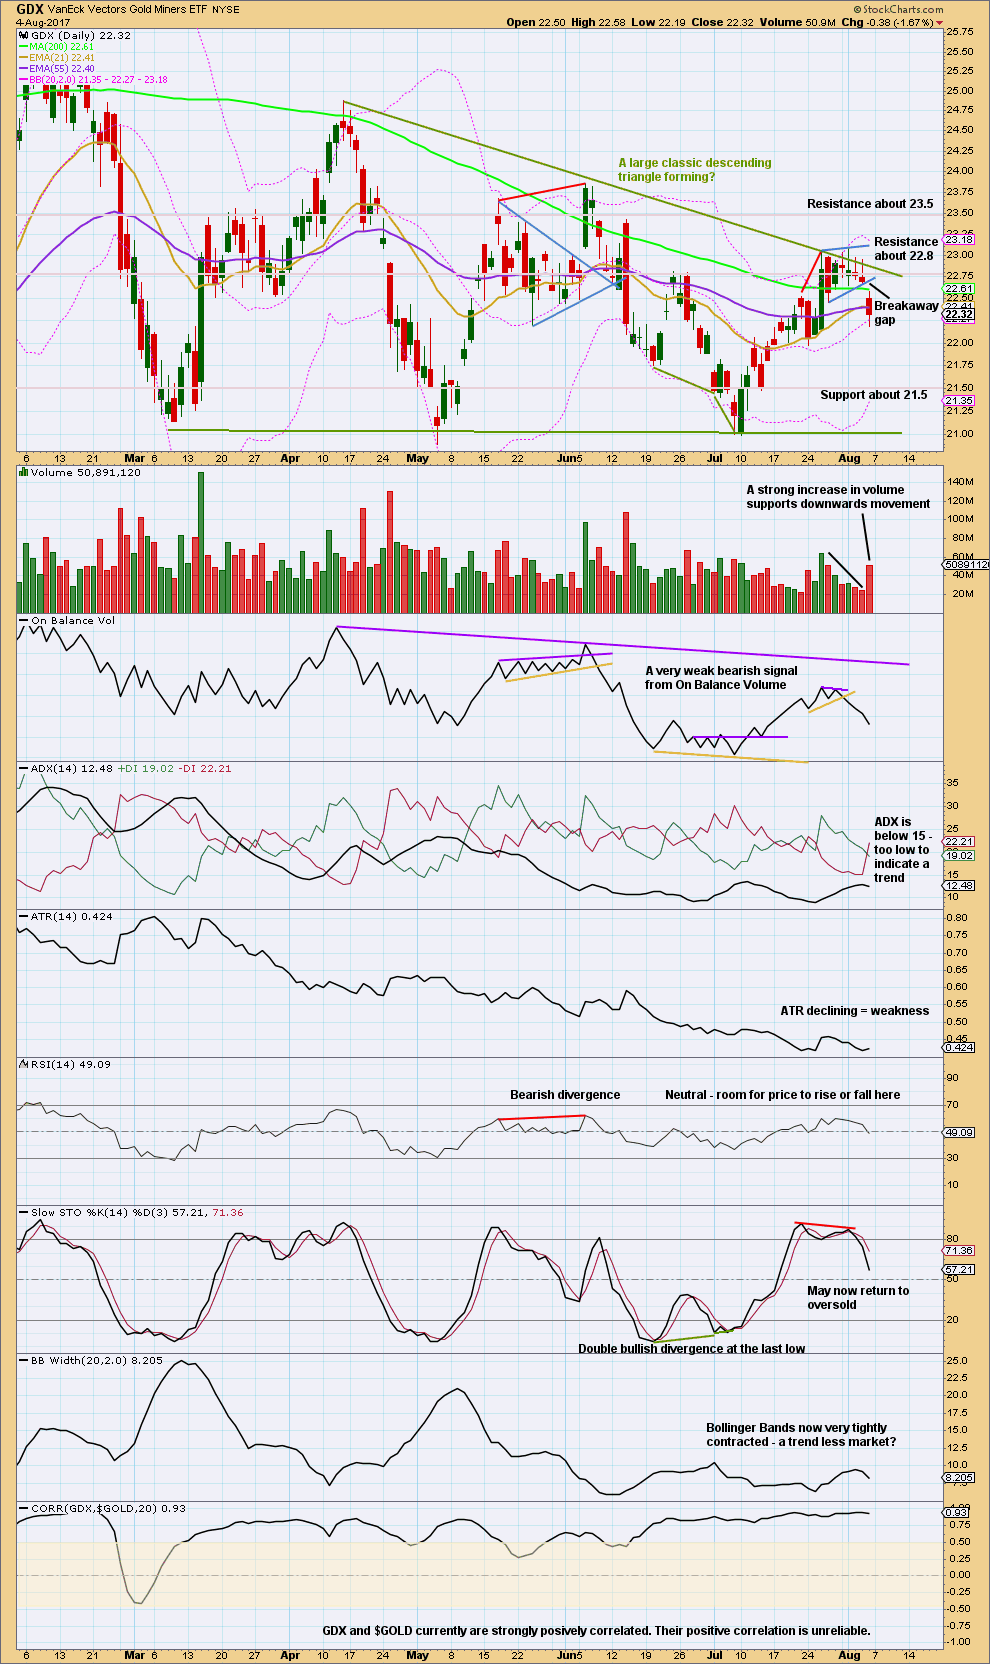
Click chart to enlarge. Chart courtesy of StockCharts.com.
Stepping back for GDX too, to look at the past six months, a large descending triangle looks like it has formed and may be close to a breakout. Breakouts from descending triangles are usually downwards.
During this structure though it is an upwards day for the 15th of March that has strongest volume suggesting an upwards breakout may be more likely than downwards.
Price has found resistance at the upper triangle trend line at the same time as Stochastics was overbought. Now price is reacting down from that line and Stochastics may return now to oversold.
Expect a downwards swing to continue overall until price finds support and Stochastics reaches oversold at the same time. Price does not have to do this in a straight line though; it may be choppy and overlapping.
Published @ 09:20 p.m. EST on 5th August, 2017.
Thank you very much Dreamer and Alan for sharing your charts and analysis with everybody. Your contribution to this membership is greatly valued by me, and by all the other members 🙂
You’re welcome 😊
Agreed.
Nice 🙂 🙃 🤣
Thank you. It’s my pleasure.
Updated hourly chart:
I’m moving the degree of the fourth wave up two degrees. This looks to be more proportional to minuette (ii) so I’ll label it minuette (iv). This leaves minuette (iii) as a curved looking impulse, which is typical of Gold.
Minuette (ii) is a deep zigzag, minuette (iv) a very shallow flat correction.
The proportion Of this 4 vs 2 Seem a little off?
I have a different opinion. The 4th wave is just finishing. It is longer in duration than the 2nd wave.
good point Alan
Looks like c of 4 may have completed at ~1260.
We’ll have to see if momentum to the downside builds up
The degree needs to be changed, up two
As I post this gold is at approx 1,256ish. It appears that Micro wave 4 as labeled morphed into a triangle. As Lara mentioned, she may relabel this 4th wave as subminuette as the wave patterns develop further. The triangle has now completed and price is heading lower. Price may move into the 1,240’s before another 4th wave starts.
Rambus public post:
Point 4 on this long term falling wedge looks like a good target for gold once the triangle completes and another impulse wave starts lower for Lara’s cycle wave c.
Really looking forward to trading a cycle wave impulse than a choppy cycle wave triangle 🤑
https://rambus1.com/2017/08/06/weekend-report-136/
End of Week Analysis
Data as at the market close of August 4
=================================
Gold markets tried to rally during the week but were stopped at 1273.83 on Tuesday. The subsequent pullback found its most precipitous fall on Friday once the NFP report was released. The very much better than expected figures had created turmoil in the gold markets. The implication was that the Fed would very likely continue to raise rates, strengthening the US dollar and putting relentless downward pressure on gold.
The plunge was stopped, at least momentarily, at 1254.91. The top cloud boundary, at 1251, had not been touched. Much will depend on the price action early next week. If 1251 still holds, then a rebound is possible, and the ability to buy the market at bargain prices remains. Let’s see what the chances are of this happening.
Pull factors:
(1) Tenkan-sen still remains above the kijun-sen, and prices trade above the two lines.
(2) Prices lie above the cloud, which is still green, at least until August 8.
(3) Prices lie above the 200 SMA.
Push factors:
(1) Prices had broken the bullish channel downwards; a corrective phase has likely begun.
(2) Prices have breached the 50 SMA, a sure sign of weakness.
(3) Momentum has declined as depicted by the downward slope of the MACD histogram.
(4) The 5-day RSI has dropped below 50, and the downward trajectory looks strong.
On balance, I feel that a downward price continuation is likely, but that after Monday next week, as predicted by Ichimoku analysis. There should still be a bit of bounce on Monday to relieve oversold conditions. This can be seen as a backtest of the broken channel. There would still be time to go short in this market. Investor sentiment has been rocked by the superb jobs number. In addition, the fact that there seems to be no signs of inflation means that there is a significant amount of headwinds to price moving upwards. If the market manages to drop below the cloud, then 1200 would not be out of the question.
Update: Prices had now fallen into the cloud at the 4-hour timeframe. The trend has changed from bullish to neutral in cloud terms, but technically it is bearish for the short-term as we are now making lower lows and lower highs, having broken the bullish channel. Support is at 1248 at the 38% Fibonacci retracement from 1205.41 to 1273.83.
Gold bug miner index: HUI wolfwave.
Line connecting end of wave 1 and wave 4 is a target line. Once HUI moves above line 2-4 the target will be where the purple line is.
If the USD is going to bottom, this looks like an excellent place. Very oversold, near horizontal support, and a bullish hammer right at the 200 MA. Chart by PK.
The move up in GDX was very hard to analyze with all the overlapping. What I thought was an ending expanding diagonal, did not come to be. The overall move up appears to have morphed into a double zigzag with alternation provided via a short y wave.
The gap down out of the channel provided confirmation that the move up is complete. Minute wave c down is expected to be an impulse wave with a target below 20.89 and likely to end at the purple trendline around 20.50.
Expecting a couple of days with sideways to down movement for a few small 4th waves before a larger correction up for Minuette wave 2.
Overall, this should be a pretty good move to the downside for a short play. The move down is now 3 days old and may last a Fib 21 days in total.
https://www.tradingview.com/x/Ent9uhwz/
Overall weekly picture hasn’t changed and it appears we have a trend change back down
Target is a move below 20.89, likely to end at the purple descending wedge trendline about 20.50
https://www.tradingview.com/x/EPYNa6si/
Thanks Dreamer, your charts and analysis are very helpful. I really appreciate the work and attention to detail that you put into your charts.
You’re welcome John!