
A short term target for Tuesday was 1,247. The low for the session fell $5.39 short of the target, after a whipsaw took out the short term invalidation point on the hourly Elliott wave chart.
Summary: Gold has likely had a trend change. The target is at 1,184. This may be met in about five weeks. Along the way down, corrections present an opportunity to join the trend. A deep correction may currently end about 1,266.
Always use a stop. Invest only 1-5% of equity on any one trade.
New updates to this analysis are in bold.
Last monthly charts and alternate weekly charts are here, video is here.
Grand SuperCycle analysis is here.
MAIN ELLIOTT WAVE COUNT
WEEKLY CHART
Click chart to enlarge.
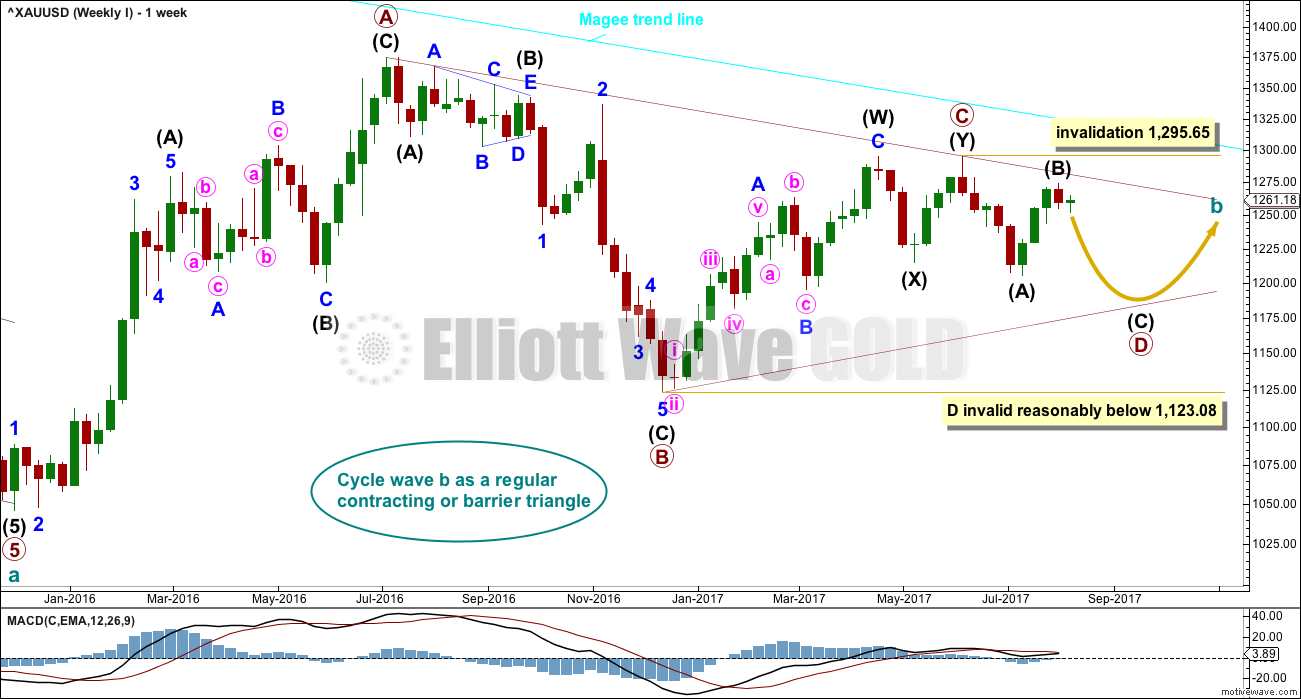
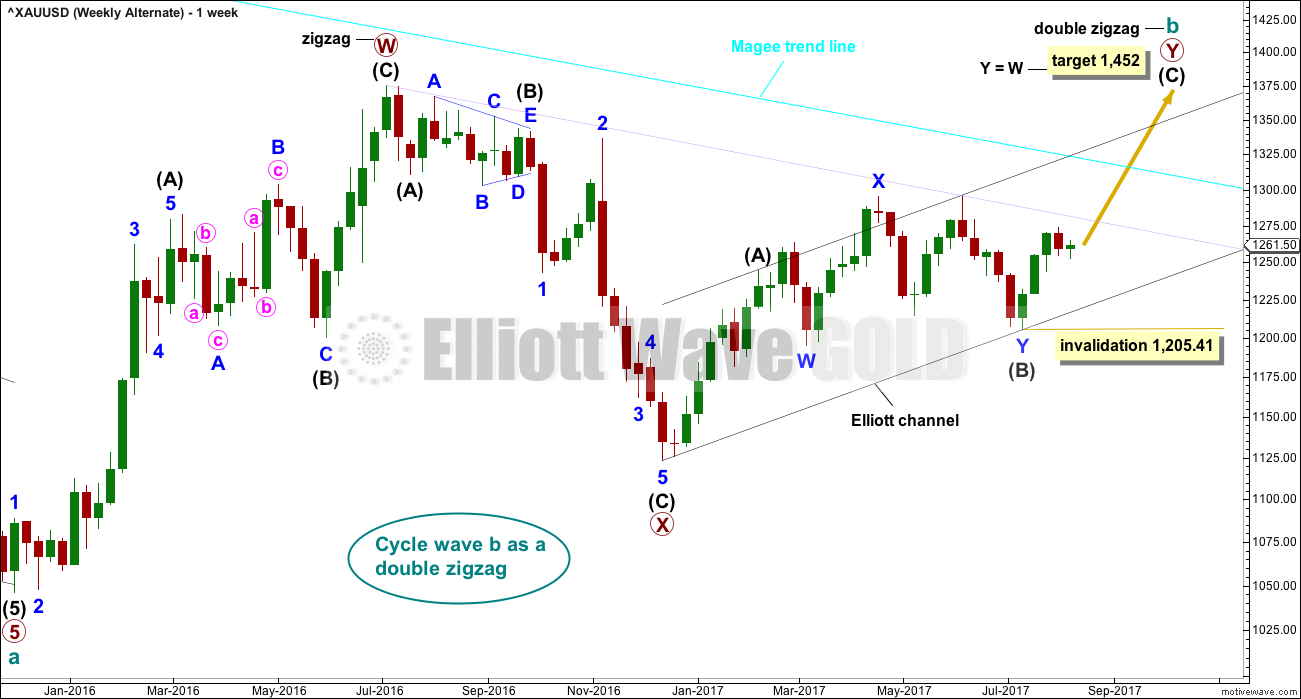
The Magee bear market trend line is added to the weekly charts. This cyan line is drawn from the all time high for Gold on the 6th of September, 2011, to the first major swing high within the following bear market on the 5th of October, 2012. This line should provide strong resistance.
At this stage, a triangle still looks possible and has the best fit for cycle wave b. It has some support from declining ATR and MACD now beginning to hover about zero.
Within a triangle, one sub-wave should be a more complicated multiple, which may be primary wave C. This is the most common sub-wave of the triangle to subdivide into a multiple.
Primary wave D of a contracting triangle may not move beyond the end of primary wave B below 1,123.08. Contracting triangles are the most common variety.
Primary wave D of a barrier triangle should end about the same level as primary wave B at 1,123.08, so that the B-D trend line remains essentially flat. This involves some subjectivity; price may move slightly below 1,123.08 and the triangle wave count may remain valid. This is the only Elliott wave rule which is not black and white.
Triangles normally adhere very well to their trend lines. So far the A-C trend line has been tested 11 times; this line has very strong technical significance. If this wave count is correct, then intermediate wave (B) may have ended just short of this trend line, finding strong resistance just below it.
Finally, primary wave E of a contracting or barrier triangle may not move beyond the end of primary wave C above 1,295.65. Primary wave E would most likely fall short of the A-C trend line. But if it does not end there, then it can slightly overshoot that trend line.
Primary wave A lasted 31 weeks, primary wave B lasted 23 weeks, and primary wave C may have been complete in 25 weeks.
Primary wave D should now be expected to last a Fibonacci 13 or 21 weeks in total. It has now lasted 8 weeks, so a further 5 weeks minimum would now be expected.
DAILY CHART
Click chart to enlarge.
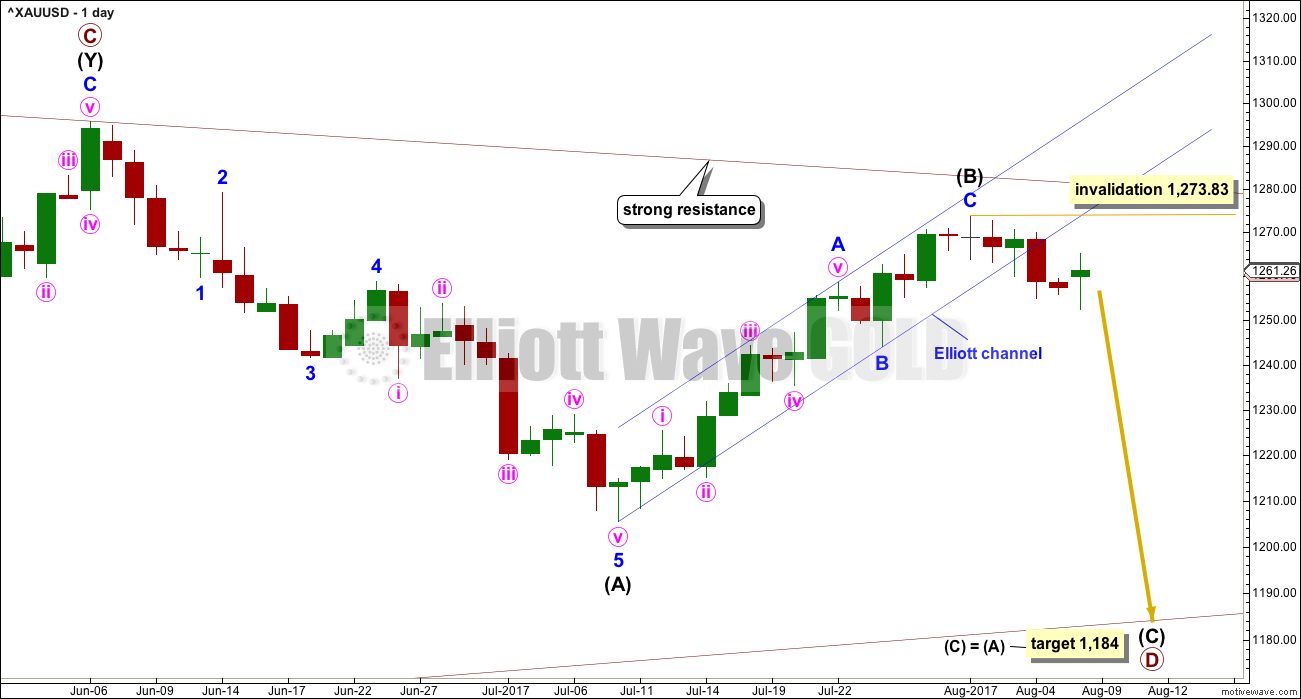
The channel about intermediate wave (B) has been fully breached at the hourly and daily chart level. This is a strong indication that intermediate wave (B) is over and intermediate wave (C) has begun.
The target calculated uses the most common Fibonacci ratio for intermediate wave (C).
Within intermediate wave (C), no second wave correction may move beyond the start of its first wave above 1,273.83.
FIRST HOURLY CHART
Click chart to enlarge.
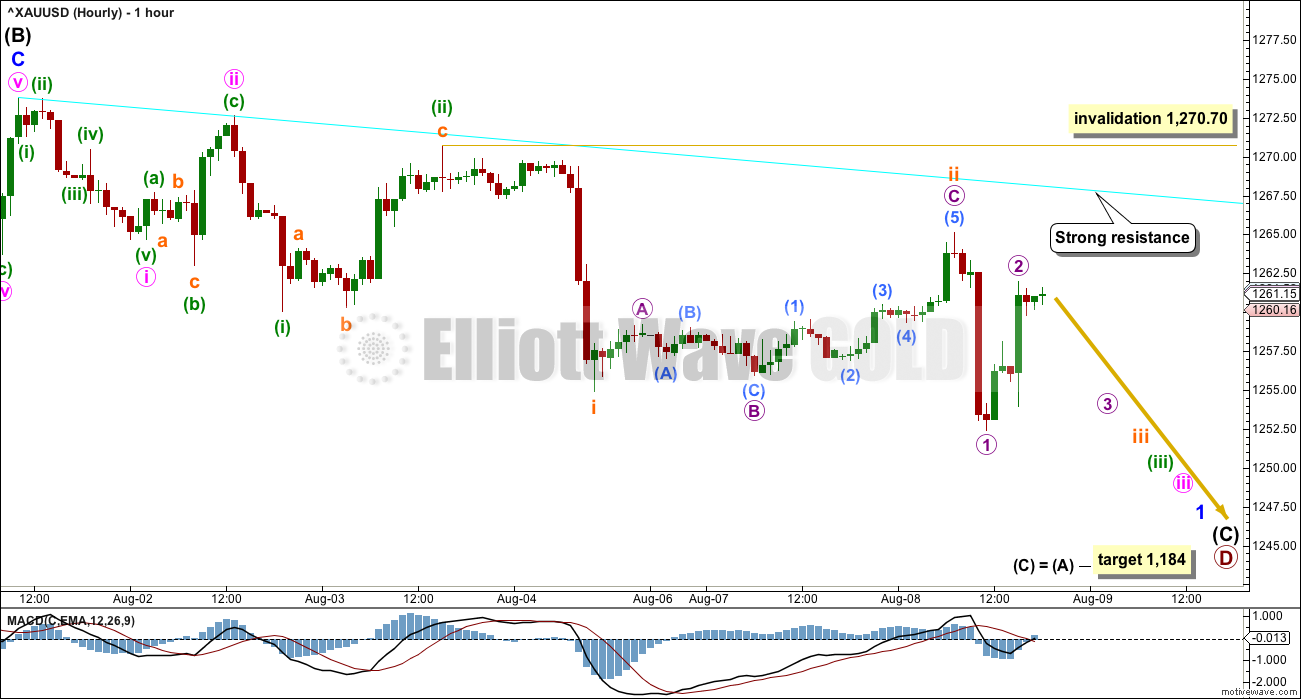
There are two possible structures for minor wave 1. The most common structure would be an impulse and that is what this first hourly chart looks at.
If minor wave 1 is unfolding as an impulse, then it has begun now with four overlapping first and second waves.
If subminuette wave ii is not over and continues further, it may not move beyond the start of subminuette wave i above 1,270.70.
This first wave count expects to see an imminent strong increase in downwards momentum.
SECOND HOURLY CHART
Click chart to enlarge.
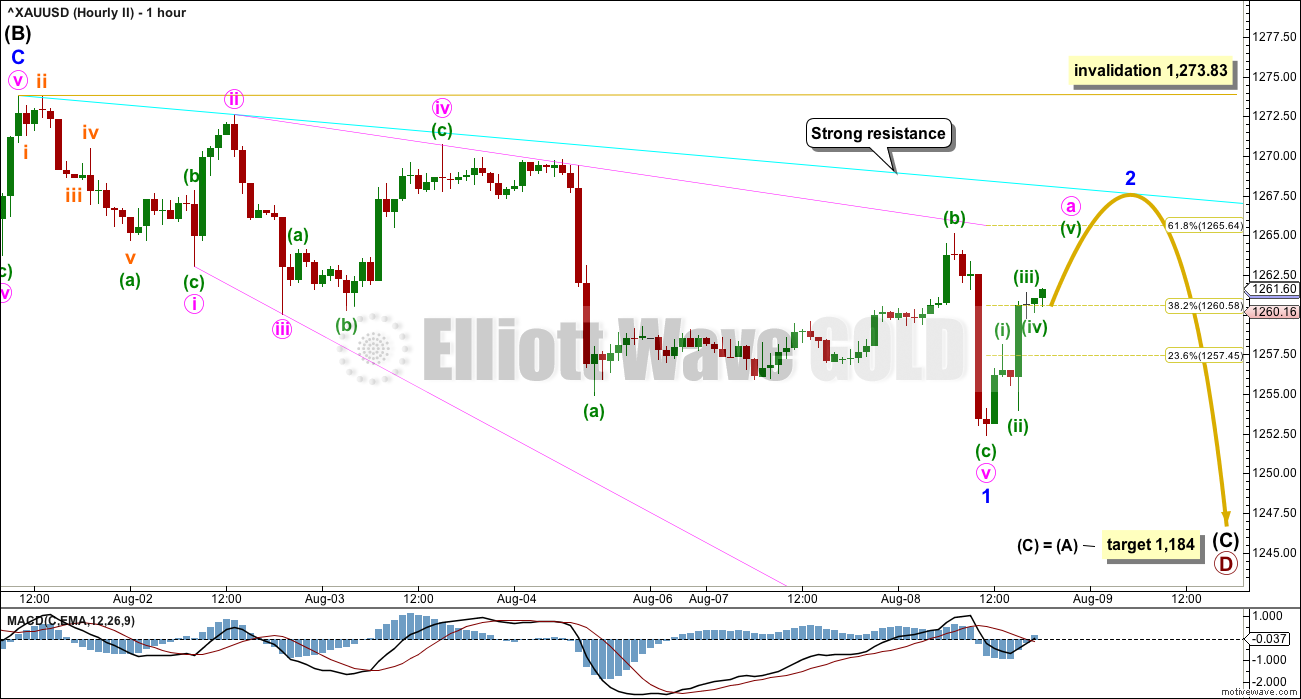
The only other possible structure for minor wave 1 would be a leading diagonal. While leading diagonals are not rare, they are not as common as impulses. This puts the probability of this second hourly chart below the first.
Contracting diagonals are more common than expanding diagonals. This further slightly reduces the probability of this second hourly chart. However, lower probability does not mean no probability. Lower probability outcomes occur, and when they do they are not what was expected as most likely. That is the nature of probability.
When first waves subdivide as leading diagonals, then the second waves that follow them are usually very deep indeed. Minor wave 2 may be expected to be at least 0.618 of minor wave 1, and very likely deeper. It may end when price comes up to touch the cyan resistance line.
ALTERNATE ELLIOTT WAVE COUNT
WEEKLY CHART
Click chart to enlarge.
This wave count has been published only in historical analysis. At this stage, it will be published on a daily basis.
There are more than 23 possible corrective structures that B waves may take, and although cycle wave b fits best at this stage as a triangle (main wave count), it may still be another structure. This wave count looks at the possibility that it may be a double zigzag.
If cycle wave b is a double zigzag, then current upwards movement may be part of the second zigzag in the double, labelled primary wave Y.
The target remains the same as previously published for this wave count.
Along the way up, some resistance should be expected at the cyan Magee trend line.
Within intermediate wave (C), no second wave correction may move beyond the start of its first wave below 1,205.41.
DAILY CHART
Click chart to enlarge.
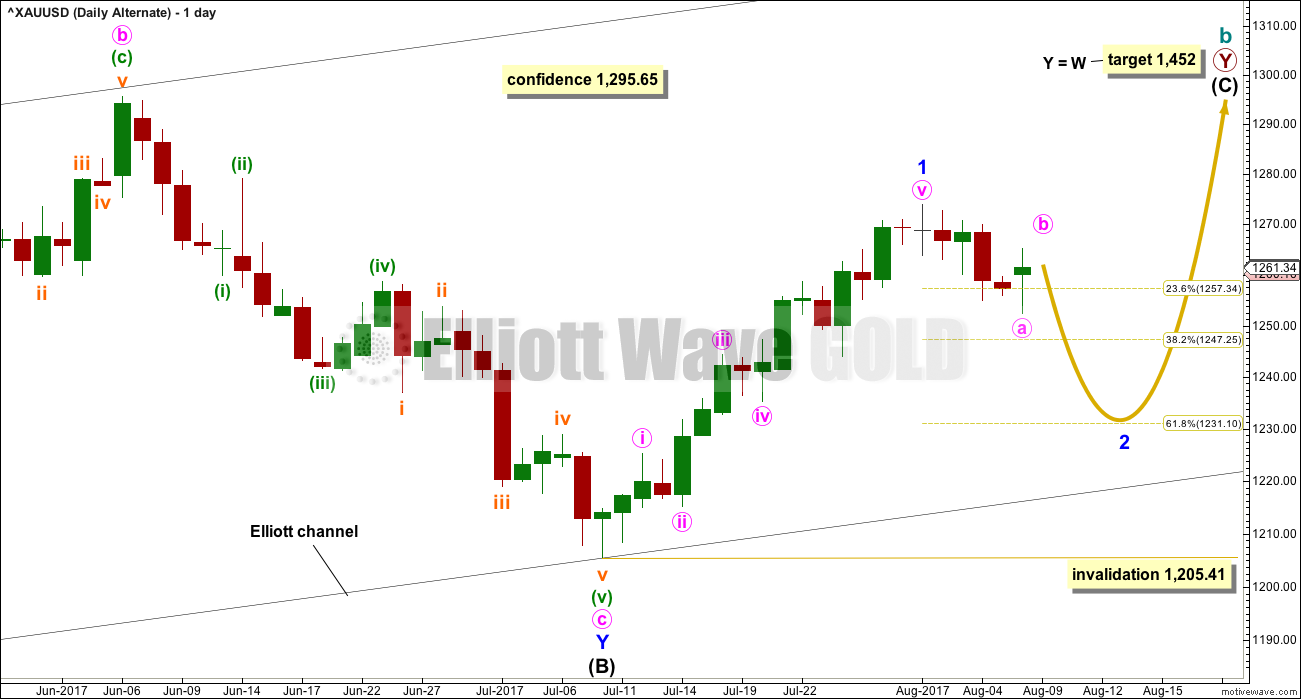
Intermediate wave (B) subdivides as a double flat correction: expanded flat – X – regular flat. While all the subdivisions have a neat fit, double flats are very rare structures. In my now 9 years of daily Elliott wave analysis I can say with certainty that I have only ever seen one before. For this reason, this wave count must be judged to have a low probability.
It will remain as labeled though because this labelling has a good fit, and threes and fives look as they are supposed to.
Intermediate wave (C) may be unfolding as an impulse.
Only minor wave 1 may have been over at the last high. Minor wave 2 may have begun. Minor wave 2 may reach down to the 0.618 Fibonacci ratio of minor wave 1 at 1,231.
Minor wave 2 may not move beyond the start of minor wave 1 below 1,205.41.
HOURLY CHART
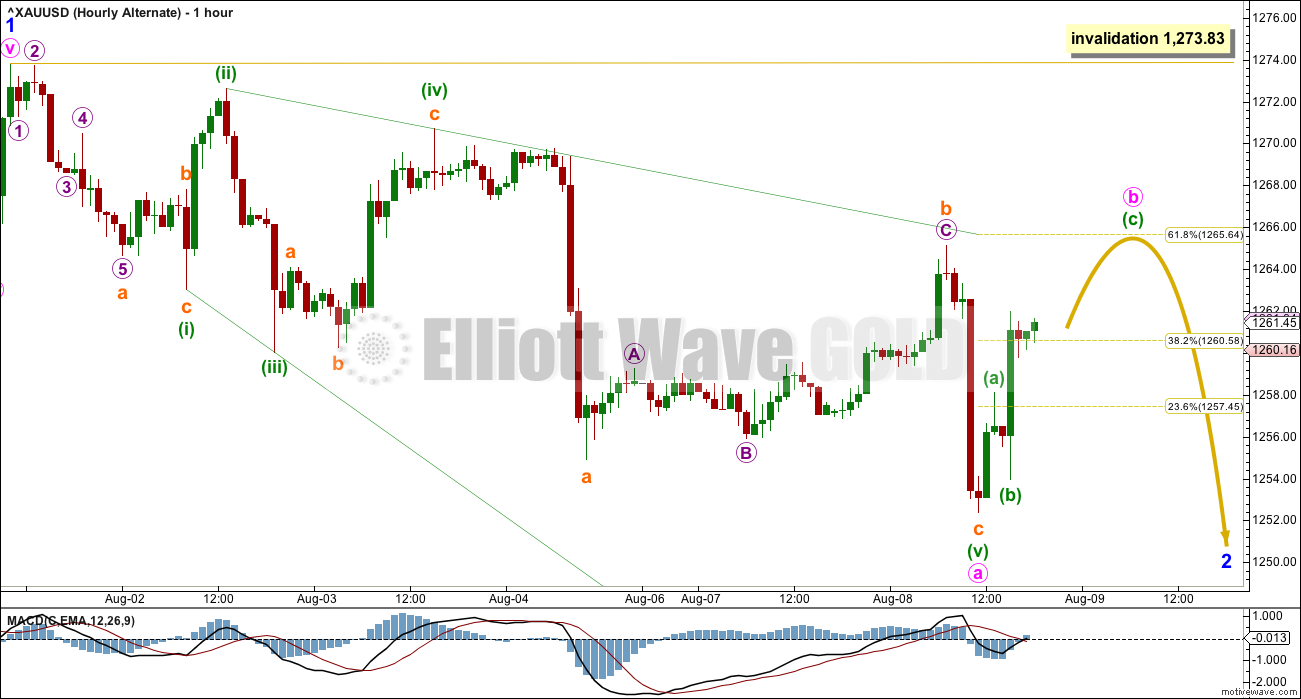
Click chart to enlarge.
Minor wave 2 may be any corrective structure, except a triangle, and the most likely structure would be a single or multiple zigzag. Within these the first movement downwards must subdivide as a five.
Labelling now for minor wave 2 will follow the most likely structure for it, a zigzag. Within the zigzag, minute wave a may now be a complete leading expanding diagonal.
Minute wave b may correct to the 0.618 Fibonacci ratio about 1,266. If minute wave a has subdivided as a five, then minute wave b may not move beyond its start above 1,273.83.
TECHNICAL ANALYSIS
WEEKLY CHART
Click chart to enlarge. Chart courtesy of StockCharts.com.
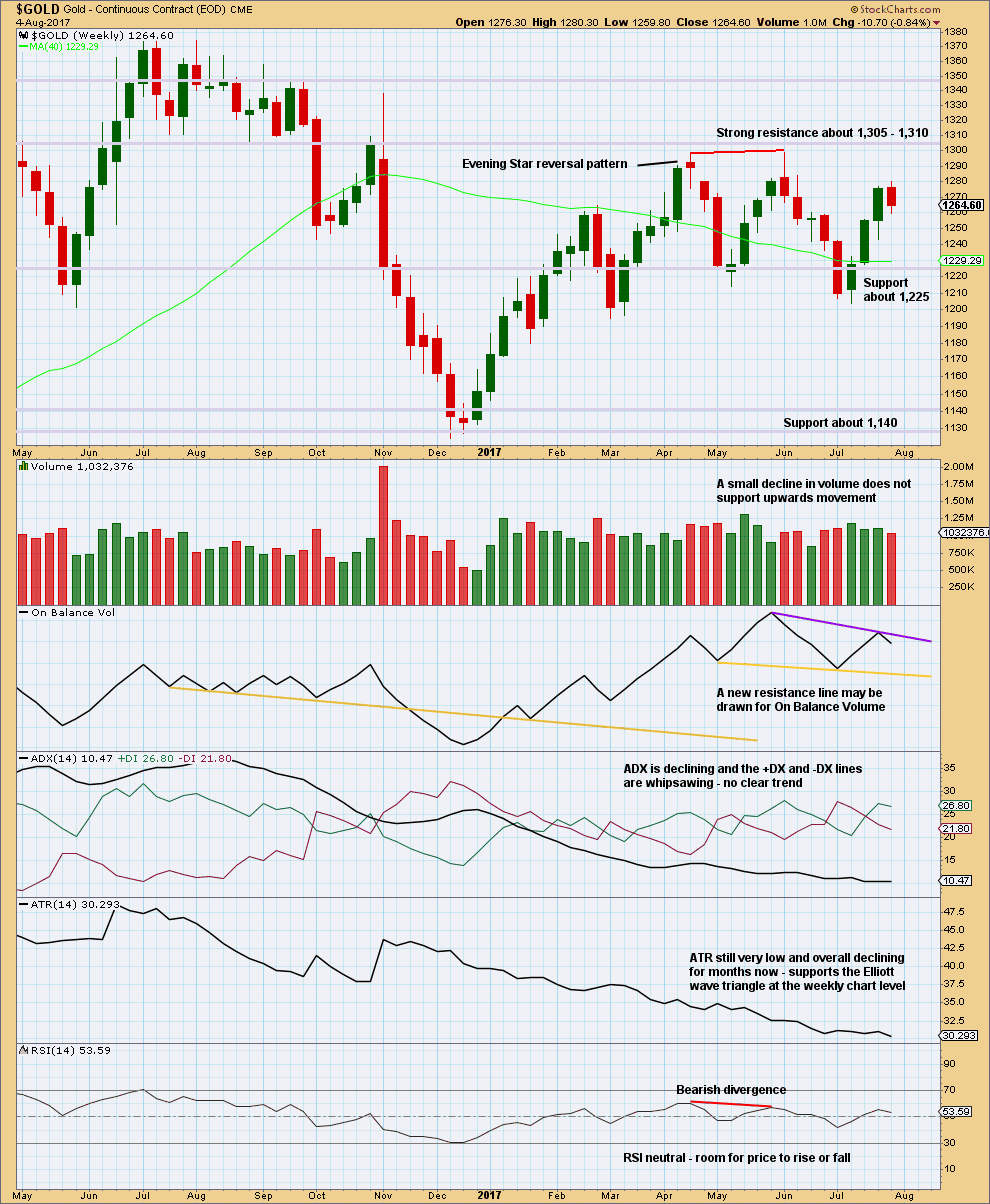
An upwards week closes with a red weekly candlestick.
To correctly analyse volume for this week it should be done at the daily chart level, to look “inside” the week.
On Balance Volume gives no signal. It is constrained.
ADX and ATR both support the main weekly Elliott wave count. This is what a triangle should look like.
DAILY CHART
Click chart to enlarge. Chart courtesy of StockCharts.com.
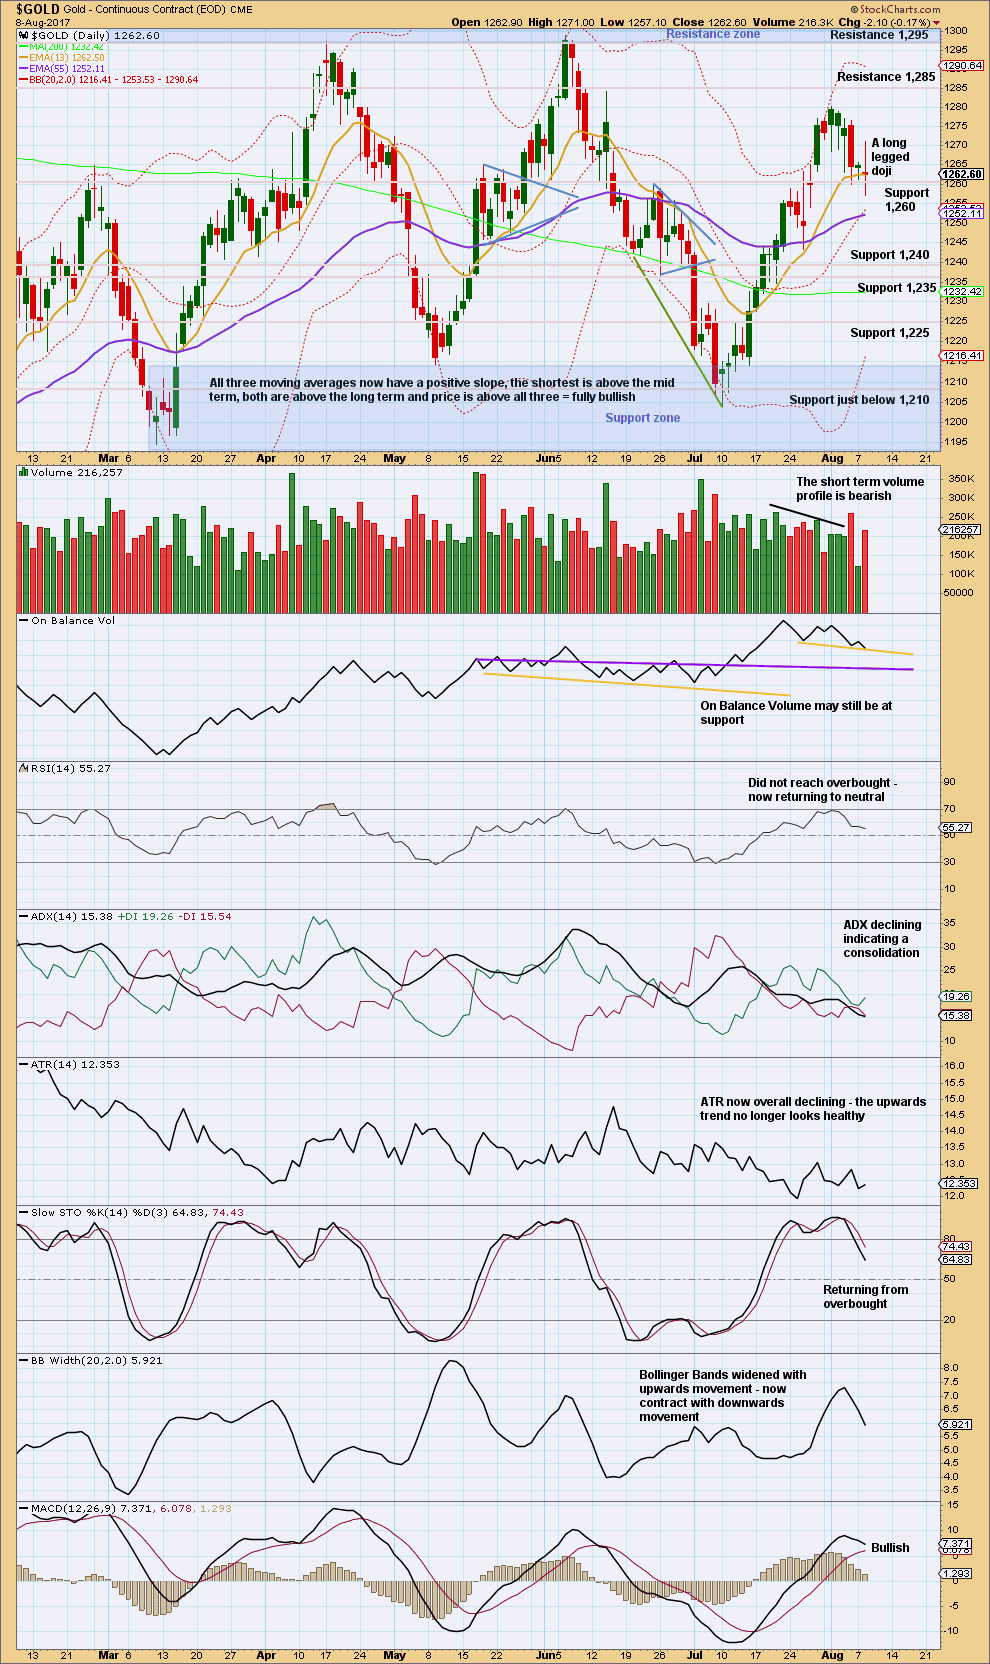
Stepping back and looking at the larger consolidation, Gold moved into a range back in February this year, delineated by support and resistance zones. During this consolidation, it is two upwards days of 7th of April and the 17th of May that have strongest volume. This suggests an upwards breakout is more likely than downwards, and it supports the alternate Elliott wave count and not the main Elliott wave count.
However, this signal is not a strong one. The third strongest day of the 18th of May is a downwards day, and it is very close in volume to the two upwards days.
Bullishness noted in last analysis from long lower candlestick wicks has now been followed by and outside day with a wide range. The upwards whipsaw during Tuesday’s session may possibly have resolved prior bullishness.
The long legged doji (a Rickshaw Man) of Tuesday’s session, coming within a downwards trend, does not signal any reversal here. The market may fall of its own weight, thus doji during down trends are not on their own reversal signals. The market may be taking a pause along the way down.
With the lower leg of today’s doji sitting below support at 1,260, that support area may now be in the process of giving way.
Watch On Balance Volume carefully. A break below support would be a weak bearish signal. A bounce up from here would be a weak bullish signal.
GDX
DAILY CHART
Click chart to enlarge. Chart courtesy of StockCharts.com.
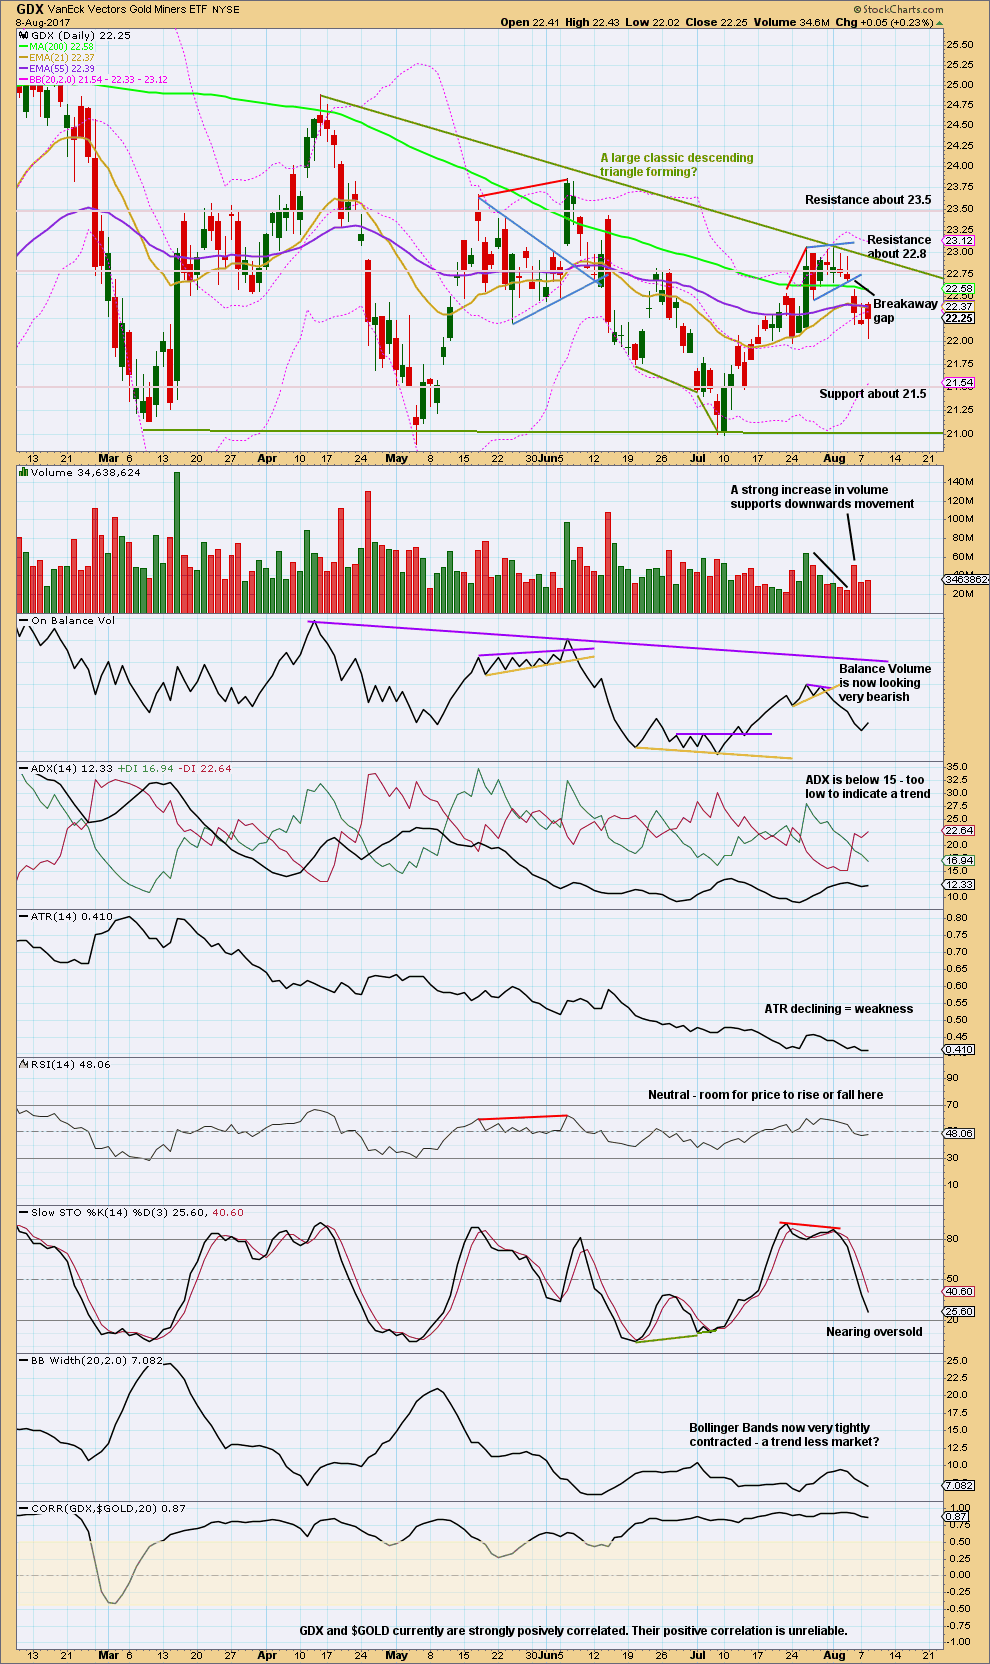
Stepping back for GDX too, to look at the past six months, a large descending triangle looks like it has formed and may be close to a breakout. Breakouts from descending triangles are usually downwards.
During this structure though it is an upwards day for the 15th of March that has strongest volume suggesting an upwards breakout may be more likely than downwards. This signal is also not a strong one for GDX. The next two strongest days are both downwards and both very strong.
Price has found resistance at the upper triangle trend line (which today is adjusted) at the same time as Stochastics was overbought. Now price is reacting down from that line and Stochastics may return now to oversold.
Expect a downwards swing to continue overall until price finds support and Stochastics reaches oversold at the same time. Price does not have to do this in a straight line though; it may be choppy and overlapping.
A long lower wick on today’s candlestick is bullish for the short term. Look for strong resistance at the breakaway gap at 22.68.
Published @ 07:49 p.m. EST.
you might be interested in:
https://www.youtube.com/watch?v=QVfA7TIfOGU
Bottom line between main and alternate wave counts:
This unexpected new high does not mean the main wave count is discarded or less likely. It means my labelling of intermediate (B) as over was wrong, it was premature.
Triangles normally adhere very well to their trend lines, and it’s common for them to test the lines multiple times. This new high today is now very close indeed to the maroon A-C trend line on the daily and weekly chart. That line is the differentiator between the main and alternate wave counts.
While price remains below or at the line the main count will still have the best fit and look entirely normal. But if upwards movement continues above the line then the alternate will increase in probability as the main count decreases.
Occasionally price can overshoot triangle trend lines, when that happens it’s not by much and price quickly reverses. But if the line is breached the main count will be discarded.
The price point that differentiates the two is 1,285.65. A new high above that point would see the triangle invalid and the alternate the only wave count left.
I agree! 🙂
You must mean 1,295.65, not 1,285.65?
Well… that was highly unexpected 🙁
Perhaps intermediate (B) is moving up to test the maroon trend line?
Redraw the blue Elliott channel.
Daily chart updated
Hourly chart updated:
gold stocks remain subdued, but remain poised as well. It would be kinda nice to see them show some enthusiasm one of these days and give gold longs some comfort/confirmation. Right now they have me on edge and my stops close. Not sure what it will take to get them moving or what their reluctance means
Interesting. Imo hard to see Gold price drop below 1269 before another thrust through 1275-78 for 1280+. Lets see. 20dma has crossed above both 50 & 100dma, CCI is in positive territory, DMI+ has crossed above DMI-… Oh well lol
nice to see and also nice to see stupid bitcoin down some (stupid bc i don’t own any :)). Could actually just be a higher end to wave B or part of an expanded flat for wave 2 as noted below, and the dollar is moving higher still. Nothing certain yet but this is a good start and last week could have just been that false move before breakout that Verne has been warning about
No offense, but it’s probably smart that you don’t own any. Bitcoin, is an epic bubble just waiting to pop.
totally agree
Lara’s main triangle count doesn’t get invalidated until 1,295.65 as shown on the weekly chart is passed.
🤥
Gold prices had shot up to as high as 1275.25. So, all wave counts are invalidated.
Perhaps, the Main may be salvaged by considering any new high now as Intermediate B.
I have been using my version of a bull count. The count fits perfectly so far. Let’s see how gold fares later today.
I think we ought to applaud Trump for his “fire and fury”.
Looks like we have to add the “Trump” indicator now. Whenever he starts escalating, it’s time to buy gold.
Perhaps low of yesterday was minor 2 in entirety for alternate or else we have expanded flat. Price is currently just above long term trend lines so if can hold and head higher we got a large rally to 1400 plus coming potentially.
Looks like lately all the counts have been wrong even the alternatives. Well let’s lick our wounds and move on. This buts gold deep in the cycle for a daily cycle high or 1257 was the cycle low and we are in for a skyrocket
Alan: ” If prices can move above 1273.83, the trend would swing in favour of the bulls.”
Gold is above 1273. Can we dust off bullish count.
Silver 4 hour inv HnS is working out. Once silver trades above 17 it will be confirmed.
Gold Ichimoku Daily Analysis
Data as at 4:15 am ET, August 9
===========================
Gold prices initially plunged on Tuesday with the release of a stronger-than-expected JOLTs report. Prices then bounced at 1254.91, very close to the 50-day SMA at 1253.70.
The 4-hour Ichimoku Chart shows gold prices trading in a short-term bearish channel drawn from the August 1 high of 1273.83. The bounce from yesterday’s low was unexpectedly strong; some fundamental analysts had attributed it to Trump’s most bellicose
rhetoric to date regarding the repeated North Korean missile launches. At the moment, prices had broken upwards from the bearish channel. If prices can move above 1273.83, the trend would swing in favour of the bulls.
I would say the short-term trend is neutral to slightly bearish. The tenkan-sen lies just below the kijun-sen, but prices are trading above these two lines. Prices have broken out of the bearish channel, and are sitting on the top cloud boundary. The 4-hour cloud is green, but is fairly thin. At the daily level, the cloud had turned red on Monday. We will need to wait for the price movement to resolve one way or the other. If prices can move above 1273.83 on high volume, then the bull will rule. But if price falls into the cloud, and back into the bearish channel, then the high reached today would be the top of the pullback, and a drop would ensue. That drop will test yesterday’s low in the 1250s where a cluster of support lies.
gold is unrelenting. USD/JPY still havent bottomed yet, so I think gold may still rise till it does.
We had some volatility today in gold and miners producing some swings in price. It looks likely that GDX may have completed Minuette wave 1 down and is correcting up in wave 2. Look for a channel break to the upside tomorrow to confirm.
For this to be correct, we likely need gold to move higher in price. Looking at the gold counts, I think the 2nd hourly (leading expanding diagonal) fits best together with my GDX count.
So look for the gap to be tested. It may or may not fill. If this happens, it may be a good opportunity to join the trend to the downside.
https://www.tradingview.com/x/DUUduhSY/