
Upwards movement was expected last week for Silver. Price has moved sideways, with a slightly higher high.
Summary: Silver may see a pullback here to about 16. Thereafter, the upwards trend may resume.
New updates to this analysis are in bold.
Last monthly chart is here.
ELLIOTT WAVE COUNTS
FIRST WAVE COUNT
WEEKLY CHART
Click chart to enlarge.
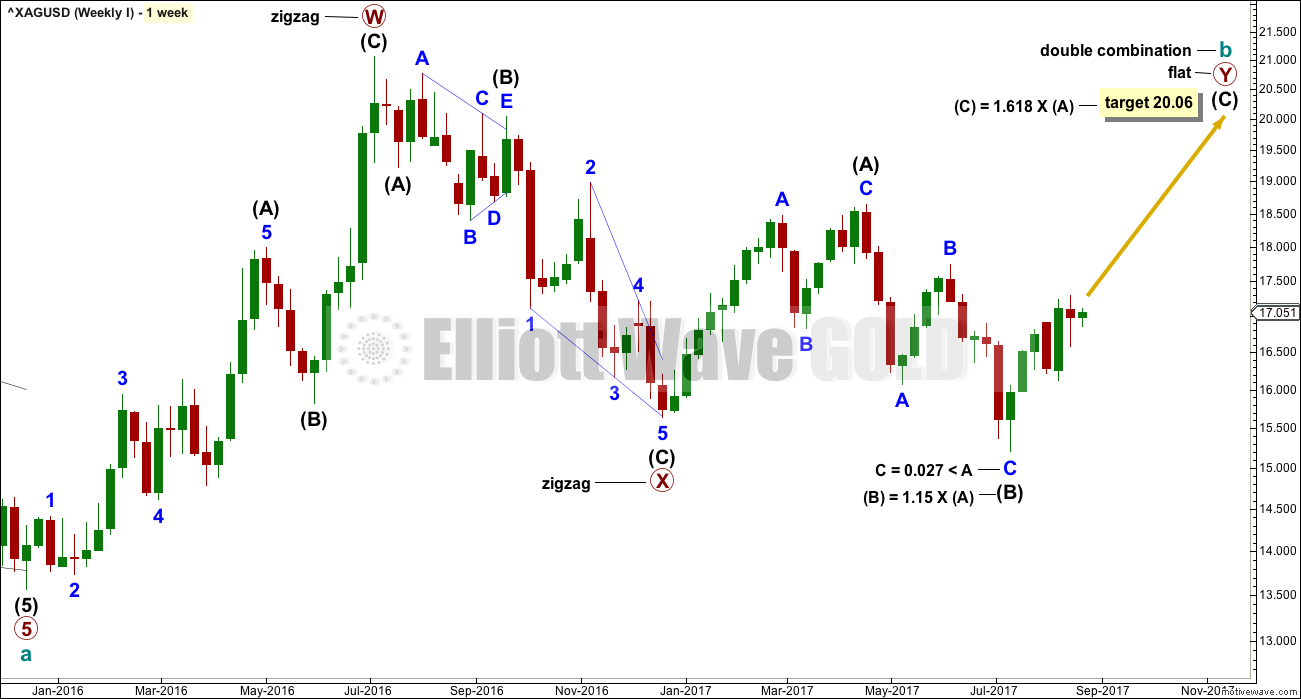
Cycle wave b may be completing as a double combination: zigzag – X – flat. The second structure, a flat correction for primary wave Y, may be underway.
Within a flat correction, intermediate wave (B) must retrace a minimum 0.9 length of intermediate wave (A) at 15.938. Intermediate wave (B) has met this minimum requirement; the rule for a flat correction is met. Intermediate wave (B) is longer than 1.05 times the length of intermediate wave (A) indicating this may be an expanded flat. Expanded flat corrections are the most common type. Normally their C waves are 1.618 or 2.618 the length of their A waves.
The target calculated would see primary wave Y to end close to same level as primary wave W about 21.062. The purpose of combinations is to take up time and move price sideways. To achieve this purpose the second structure in the double normally ends about the same level as the first.
While the combination wave count at the weekly chart level does not currently work for Gold, it does still work for Silver. They do not have to complete the same structures for cycle wave b, and fairly often their structures are different.
DAILY CHART
Click chart to enlarge.
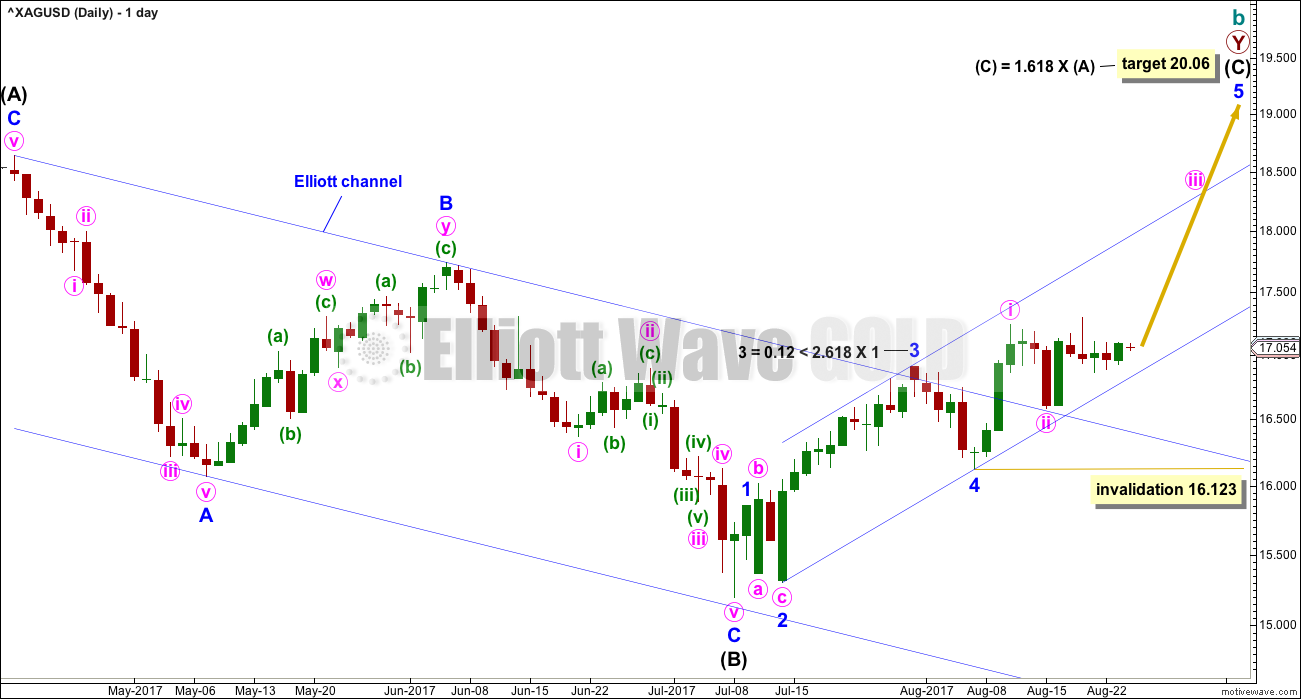
For this first wave count, upwards movement for intermediate wave (C) must subdivide as a five wave structure. It may be unfolding as an impulse.
Within the impulse, minor waves 1 through now to 4 may be complete. Minor wave 5 may be a long extension, which is typical for commodities.
The blue Elliott channel is redrawn using the second technique. Minor wave 5 may end about the upper edge of the channel.
No second wave correction within minor wave 5 may move beyond its start below 16.123. Minute wave ii looks very likely now to be over, remaining within the upwards channel about intermediate wave (C) and finding support at the upper edge of the downwards channel about intermediate wave (B).
The idea of minor wave 4 continuing further as an expanded flat in the same way as intermediate wave (B) for the second wave count below does not really work. That would see minor wave 4 grossly disproportionate to minor wave 2, and both would be expanded flats so not exhibit alternation in structure.
SECOND WAVE COUNT
WEEKLY CHART
Click chart to enlarge.
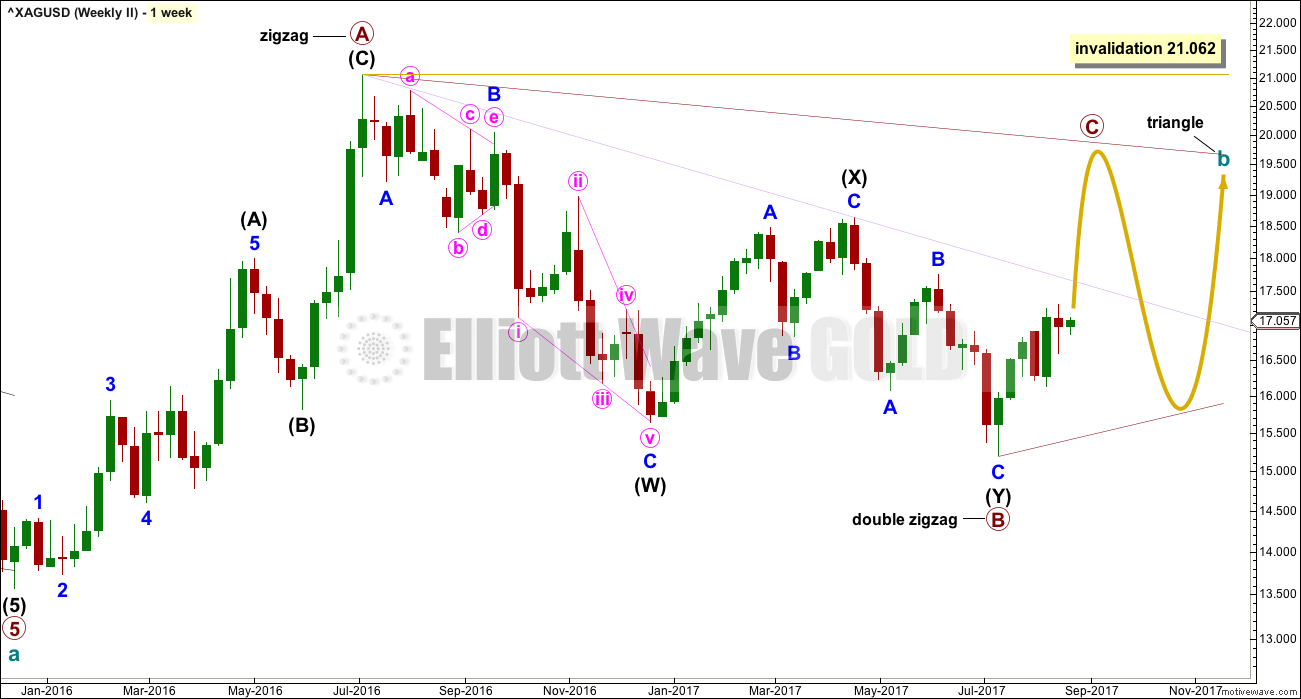
Within a triangle, one of the sub-waves must be a more complicated multiple, usually a multiple zigzag. This may be complete for primary wave B.
Primary wave C upwards should unfold as a single zigzag that may not move beyond the end of primary wave A above 21.062. The A-C trend line is adjusted to see primary wave C reach a more normal length in relation to primary wave B. Along the way up, price may find some resistance at the lilac trend line.
Primary wave C must subdivide as a three wave zigzag.
DAILY CHART
Click chart to enlarge.
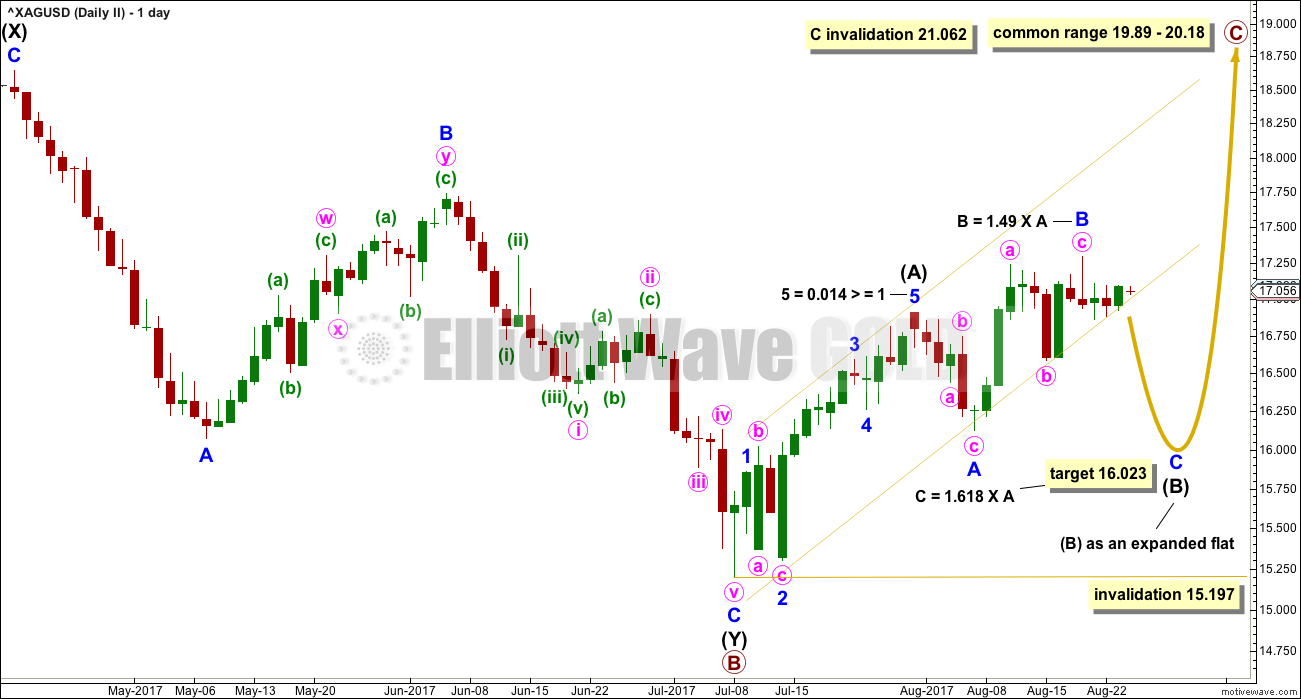
While intermediate wave (B) could still be over at the low labelled minor wave A, recent sideways movement does not look like a third wave up within intermediate wave (C). What looks more likely now given recent price behaviour is that intermediate wave (B) may not be over may be continuing sideways as an expanded flat.
This wave count requires price to break below the best fit channel for confidence. While the lower trend line continues to provide support, then the expectation of a strong downwards movement should not have confidence.
Intermediate wave (B) may not move beyond the start of intermediate wave (A) below 15.197.
TECHNICAL ANALYSIS
WEEKLY CHART
Click chart to enlarge. Chart courtesy of StockCharts.com.
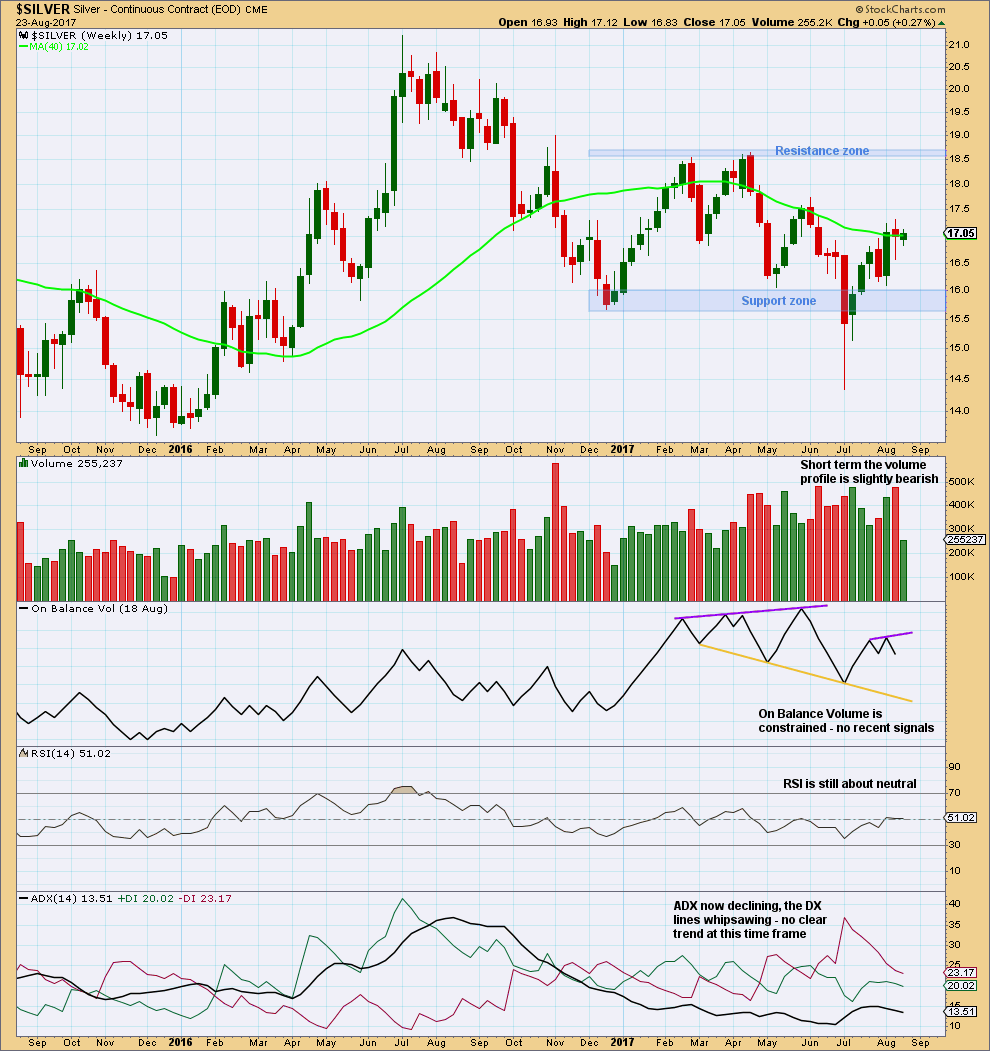
The last completed weekly candlestick is red and has a balance of volume downwards, although it made a higher high and a higher low. Support during the week from volume was for downwards movement, so this is bearish.
The long lower wick on the last completed weekly candlestick is bullish.
Long term declining ADX supports the triangle Elliott wave count.
DAILY CHART
Click chart to enlarge. Chart courtesy of StockCharts.com.
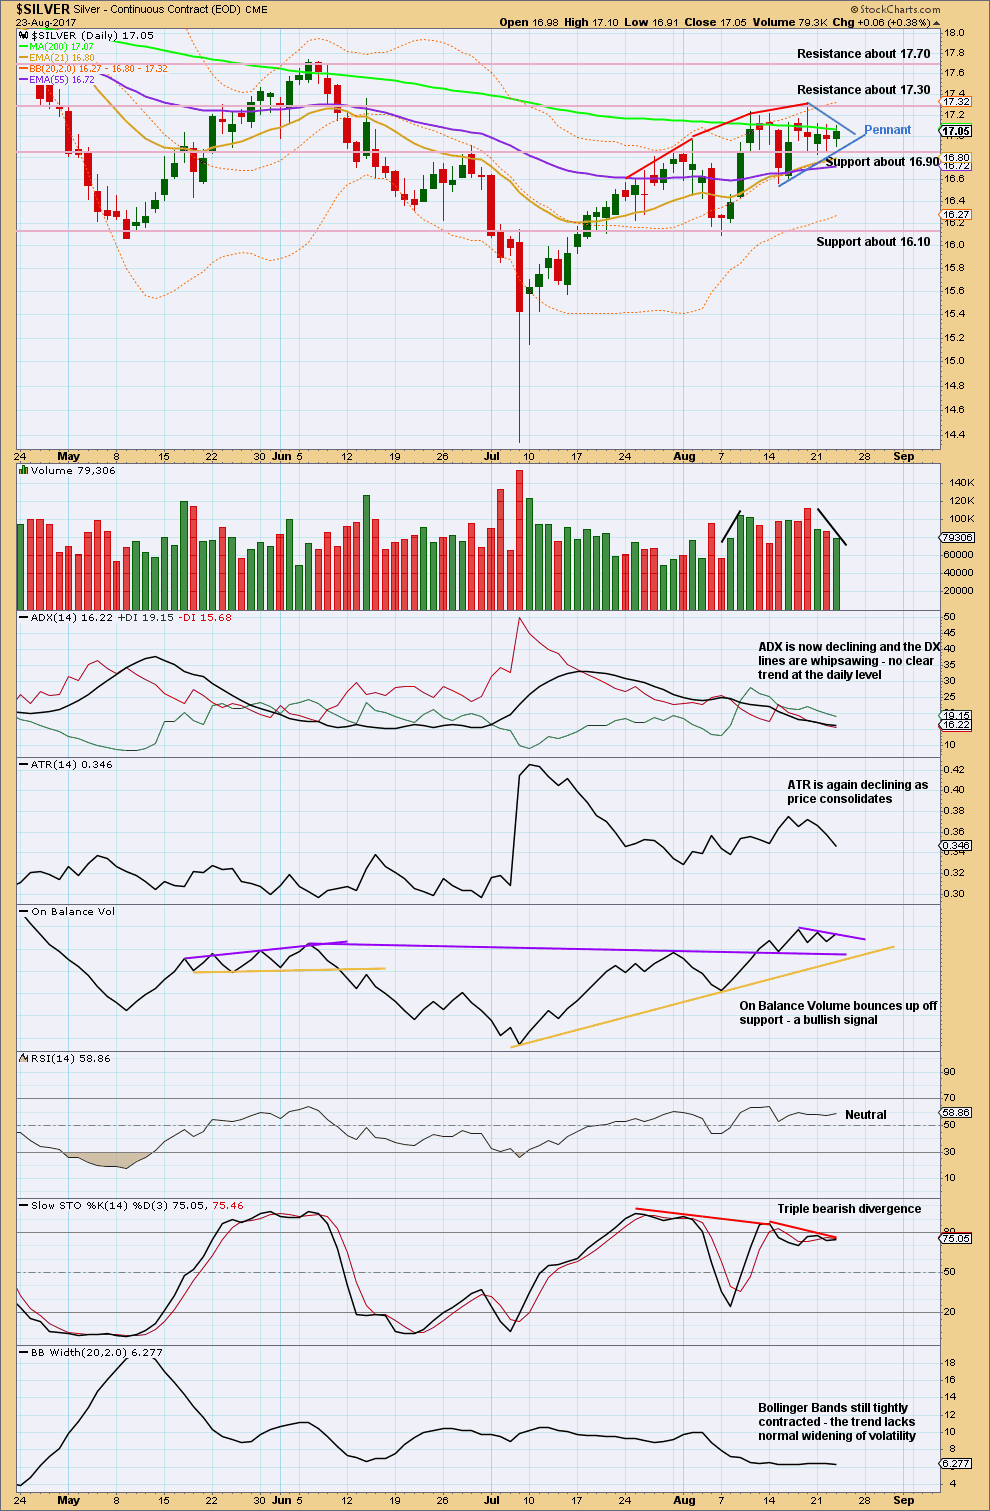
A small pennant pattern may be forming. This is supported by declining volume as price moves sideways. Pennants and flags are continuation patterns. The measured rule would give a target about 19.98.
Current resistance is about 17.30 and support about 16.90.
Stochastics supports the second Elliott wave count. Bollinger Bands also support a triangle; it is normal for bands to contract as a triangle unfolds.
Published @ 01:50 a.m. EST.
Lara, what about a triangle for Primary Y?
And for the daily chart, what about an ending diagonal similar to gold to complete Intermediate wave C?
Yes, that would work.
For the triangle for Silver as I have it in the chart published here, it could also be that primary C may end lower than where I’m showing.
Primary C may end when Gold does a big bounce within primary D. Silver may make a new high, but Gold may not.
That’s entirely possible. And one reason why I’m not going to base the analysis of one market on the other. They usually have different structures that unfold in a different pattern, their highs and lows don’t always happen together. And they’re not always correlated.
Lara, while there are some periods of time with inconsistent correlation, for the most part Silver seems to correlate positively with Gold. Both of these counts show higher prices for Silver in the weeks to come.
This appears to contradict your main Gold triangle count which sees lower prices in the weeks and months from now.
Seems like either the Gold alternate will need to prevail or there’s another count for Silver that will need to come into view…. thoughts?
I know that you’ll disagree with me, but because the correlation is unreliable I wouldn’t want to base the analysis of one on analysis of the other.
I know they often do have a positive correlation, but we cannot expect that will continue. The math shows it does not.