
A pullback continued as expected from last analysis.
Summary: In the short term, look out for a little more upwards movement. After that look out for a downwards swing to about 15.830.
New updates to this analysis are in bold.
Last monthly chart is here.
ELLIOTT WAVE COUNTS
FIRST WAVE COUNT
WEEKLY CHART
Click chart to enlarge.
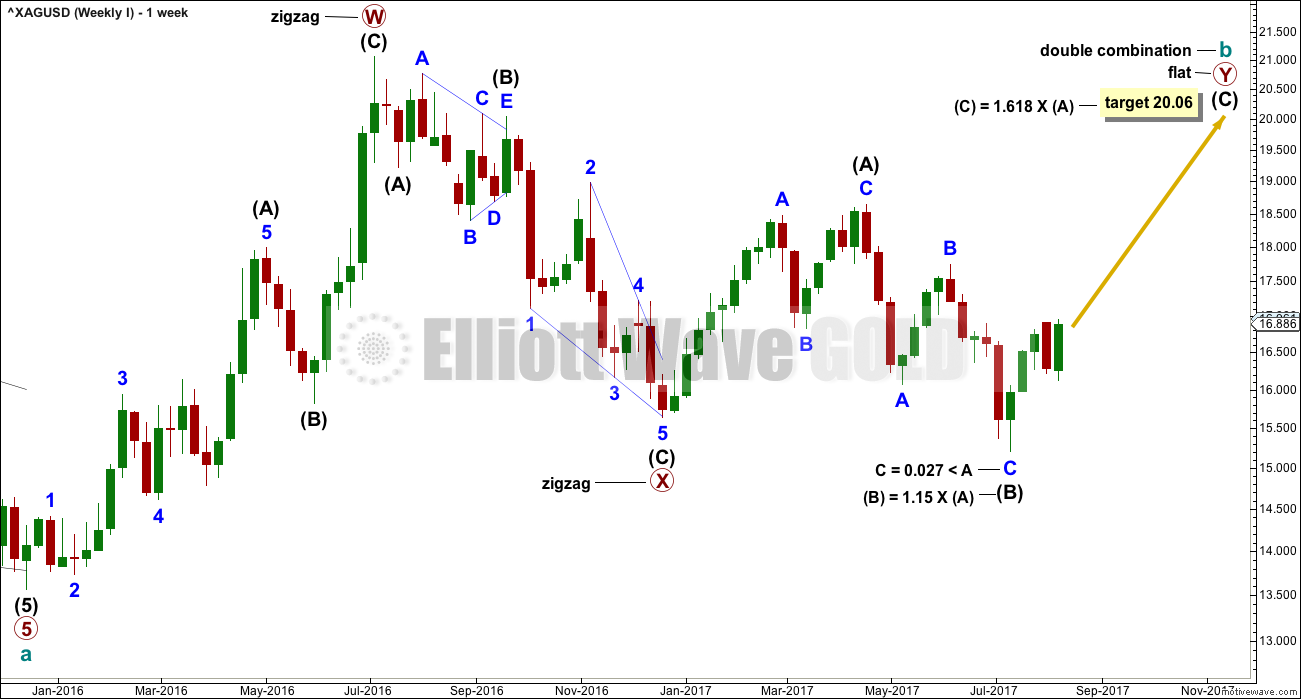
Cycle wave b may be completing as a double combination: zigzag – X – flat. The second structure, a flat correction for primary wave Y, may be underway.
Within a flat correction, intermediate wave (B) must retrace a minimum 0.9 length of intermediate wave (A) at 15.938. Intermediate wave (B) has met this minimum requirement; the rule for a flat correction is met. Intermediate wave (B) is longer than 1.05 times the length of intermediate wave (A) indicating this may be an expanded flat. Expanded flat corrections are the most common type. Normally their C waves are 1.618 or 2.618 the length of their A waves.
The target calculated would see primary wave Y to end close to same level as primary wave W about 21.062. The purpose of combinations is to take up time and move price sideways. To achieve this purpose the second structure in the double normally ends about the same level as the first.
While the combination wave count at the weekly chart level does not currently work for Gold, it does still work for Silver. They do not have to complete the same structures for cycle wave b, and fairly often their structures are different.
DAILY CHART
Click chart to enlarge.
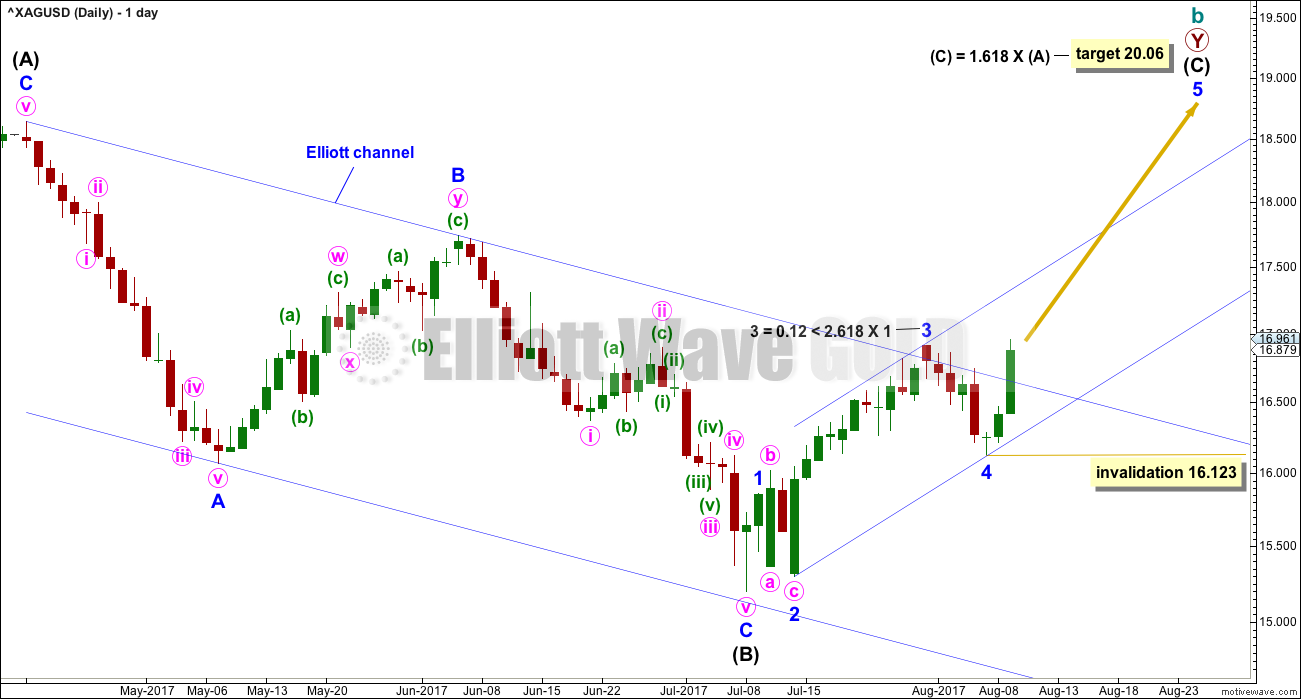
For this first wave count, upwards movement for intermediate wave (C) must subdivide as a five wave structure. It may be unfolding as an impulse.
Within the impulse, minor waves 1 through now to 4 may be complete. Minor wave 5 may be a long extension, which is typical for commodities.
The blue Elliott channel is redrawn using the second technique. Minor wave 5 may end about the upper edge of the channel.
No second wave correction within minor wave 5 may move beyond its start below 16.123.
SECOND WAVE COUNT
WEEKLY CHART
Click chart to enlarge.
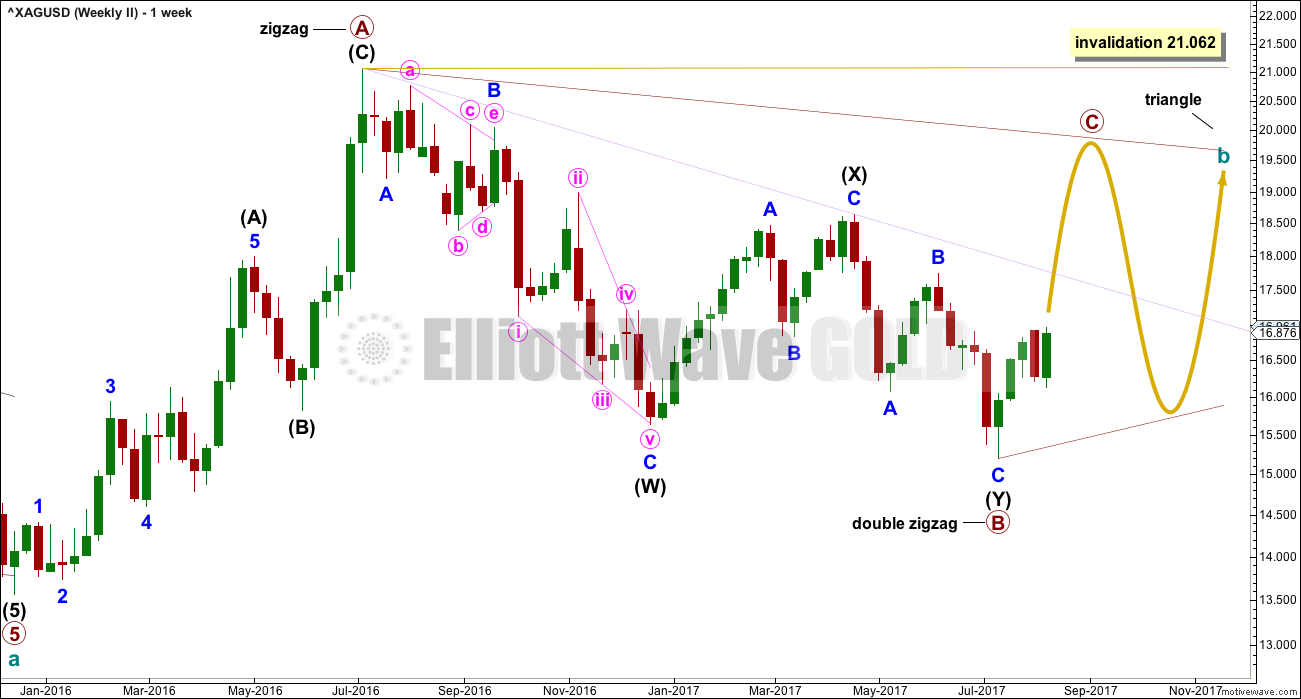
Within a triangle, one of the sub-waves must be a more complicated multiple, usually a multiple zigzag. This may be complete for primary wave B.
Primary wave C upwards should unfold as a single zigzag that may not move beyond the end of primary wave A above 21.062. The A-C trend line is adjusted to see primary wave C reach a more normal length in relation to primary wave B. Along the way up, price may find some resistance at the lilac trend line.
Primary wave C must subdivide as a three wave zigzag, so within it there should be a big pullback for intermediate wave (B).
DAILY CHART
Click chart to enlarge.
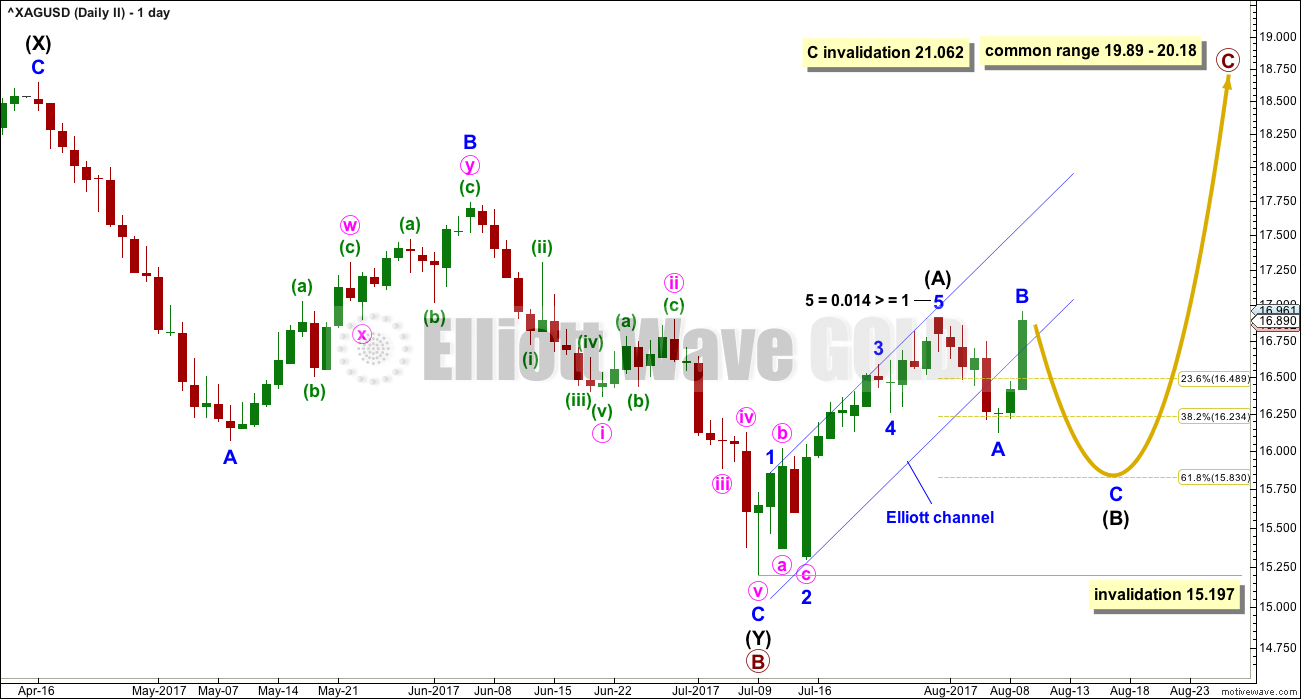
This wave count expects a shorter upwards wave than the first wave count.
Intermediate wave (B) may be over at the last low, or it may continue further as an expanded flat, triangle or combination. If it continues, it may end closer to the 0.618 Fibonacci ratio of intermediate wave (A).
Given that intermediate wave (A) lasted 15 sessions, it looks more likely that intermediate wave (B) should continue further to have better proportion to intermediate wave (A).
Intermediate wave (B) may not move beyond the start of intermediate wave (A) below 15.197.
TECHNICAL ANALYSIS
WEEKLY CHART
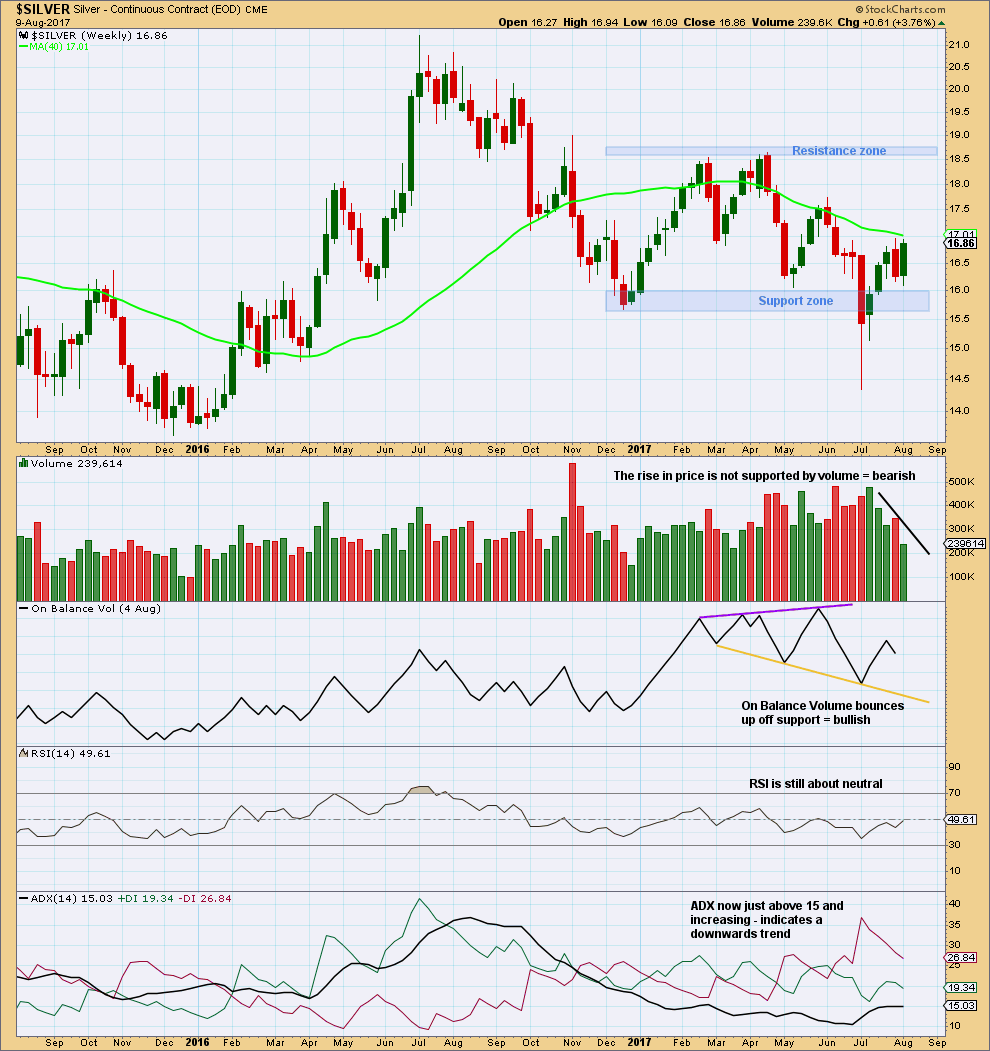
Click chart to enlarge. Chart courtesy of StockCharts.com.
RSI indicates there is plenty of room for price to rise or fall.
During the consolidation, it is a downwards week which has strongest volume suggesting a downwards breakout may be more likely.
In the short term, this upwards movement of the last weeks still looks very weak.
DAILY CHART
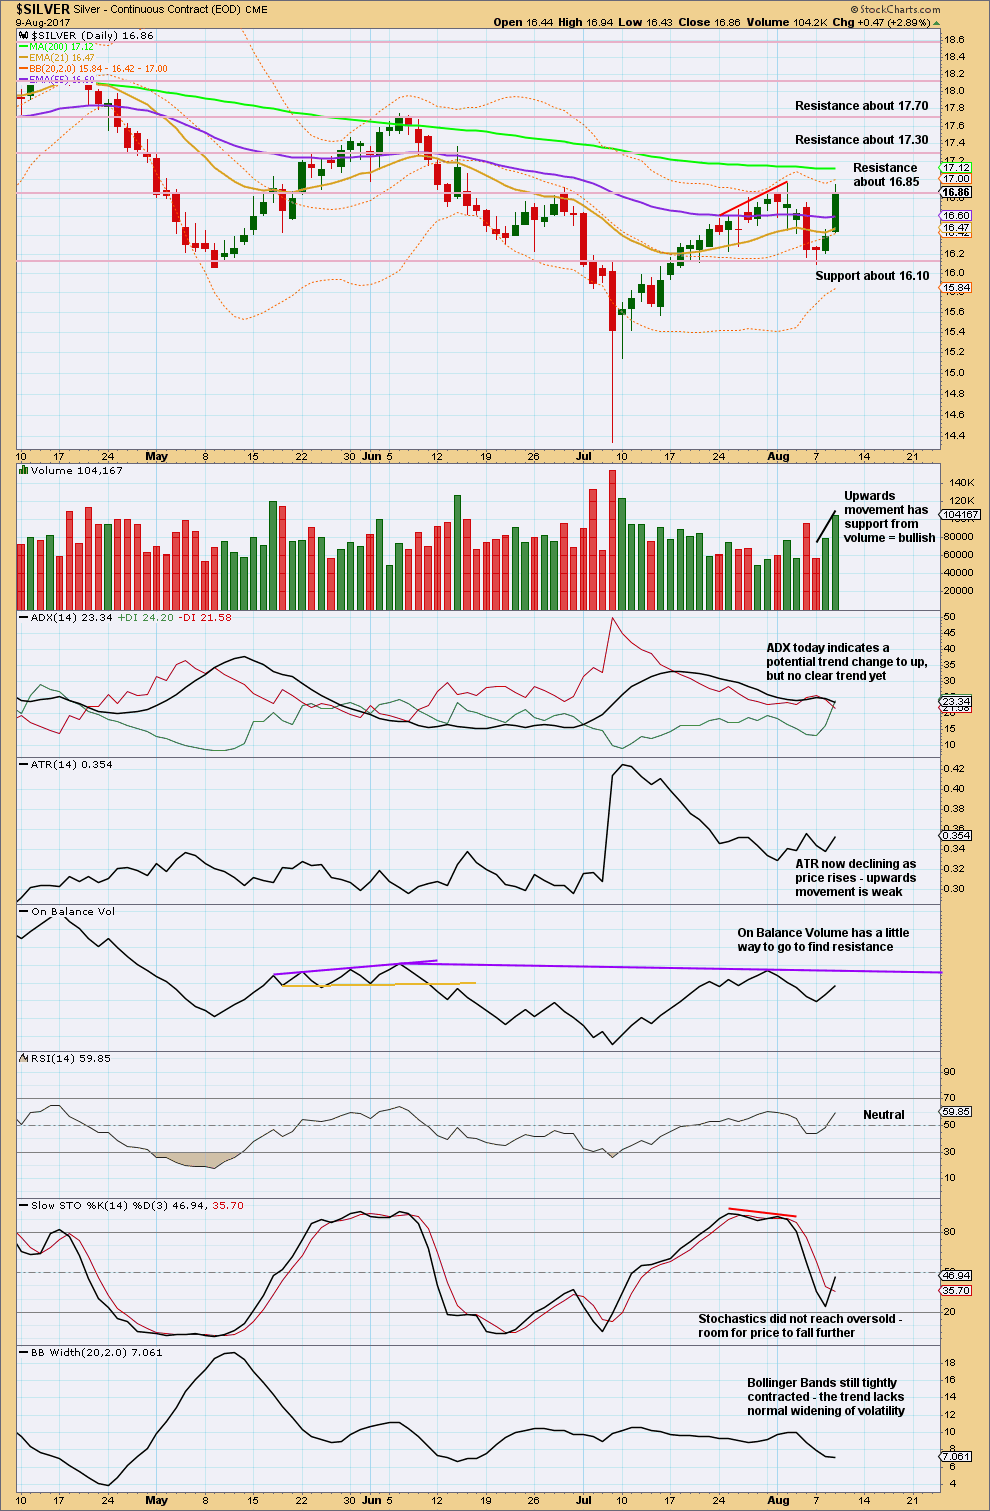
Click chart to enlarge. Chart courtesy of StockCharts.com.
The last session of strong upwards movement has strong support from volume. This bullishness supports the first wave count and not the second.
Upwards movement may be limited though if On Balance Volume finds resistance.
Published @ 09:52 p.m. EST.