
Overall sideways movement was expected for the week. So far price has moved a little lower, now finding support almost exactly at a long term trend line.
Summary: The correction for minor wave 4 may be over today. If it moves a little lower, then a target at 1,309 would be the lowest expectation. The correction should find strong support at the cyan trend line on the daily chart.
Look for the next upwards wave to begin here as fairly likely. The target is now 1,380, with a limit at 1,397.51.
Always use a stop. At this time, stops may be set just a little under the cyan trend line about 1,308. Invest only 1-5% of equity on any one trade.
New updates to this analysis are in bold.
Last monthly charts for the main wave count are here, another monthly alternate is here, and video is here.
Grand SuperCycle analysis is here.
MAIN ELLIOTT WAVE COUNT
WEEKLY CHART
Click chart to enlarge.
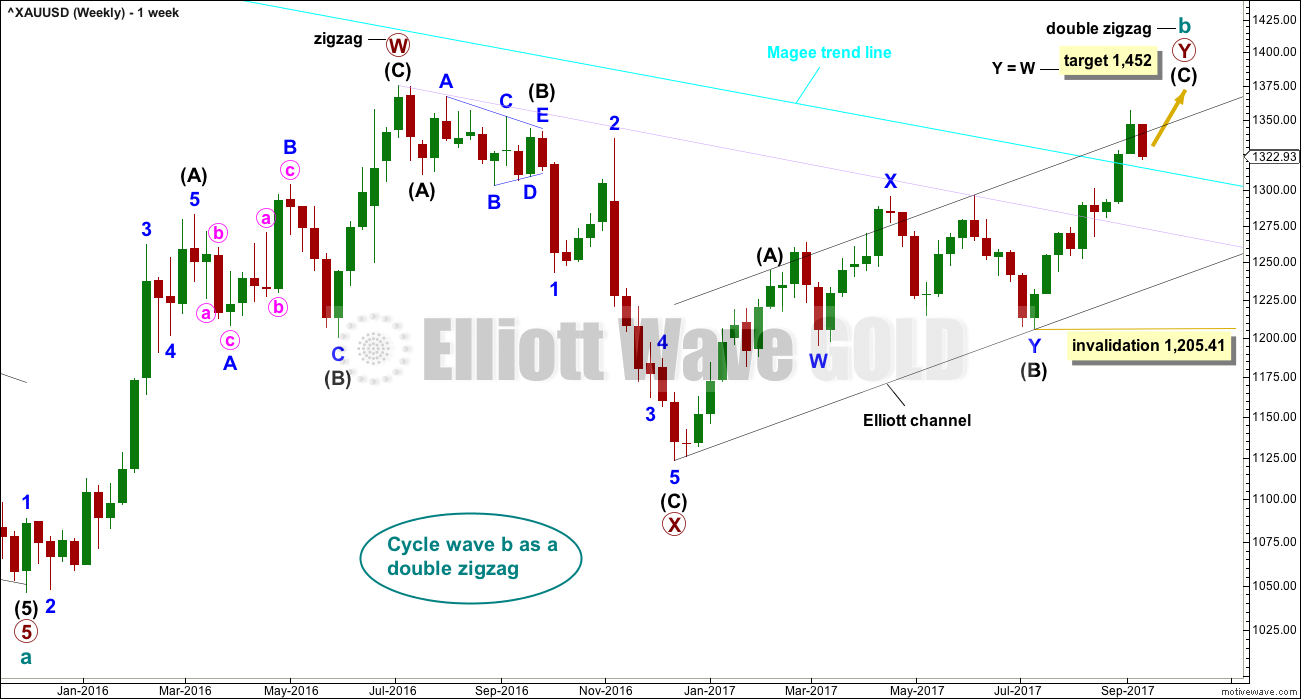
There is strong support from classic technical analysis for this wave count. Now that price has fully broken above the Magee trend line and has broken out above a consolidation zone, with support from volume, this wave count will now be the main wave count.
There are more than 23 possible corrective structures that B waves may take, and although cycle wave b still fits well at this stage as a triangle, it may still be another structure. This wave count looks at the possibility that it may be a double zigzag.
If cycle wave b is a double zigzag, then current upwards movement may be part of the second zigzag in the double, labelled primary wave Y.
The target remains the same.
Within intermediate wave (C), no second wave correction may move beyond the start of its first wave below 1,205.41.
There are two problems with this wave count which reduce its probability in terms of Elliott wave:
1. Cycle wave b is a double zigzag, but primary wave X within the double is deep and time consuming. While this is possible, it is much more common for X waves within double zigzags to be brief and shallow.
2. Intermediate wave (B) within the zigzag of primary wave Y is a double flat correction. These are extremely rare, even rarer than running flats. The rarity of this structure must further reduce the probability of this wave count.
Although this wave count still has these problems, technical analysis now points to it being more likely. The alternate will continue to be considered until price invalidates it.
DAILY CHART
Click chart to enlarge.
The analysis will focus on the structure of intermediate wave (C). To see details of all the bull movement for this year see daily charts here.
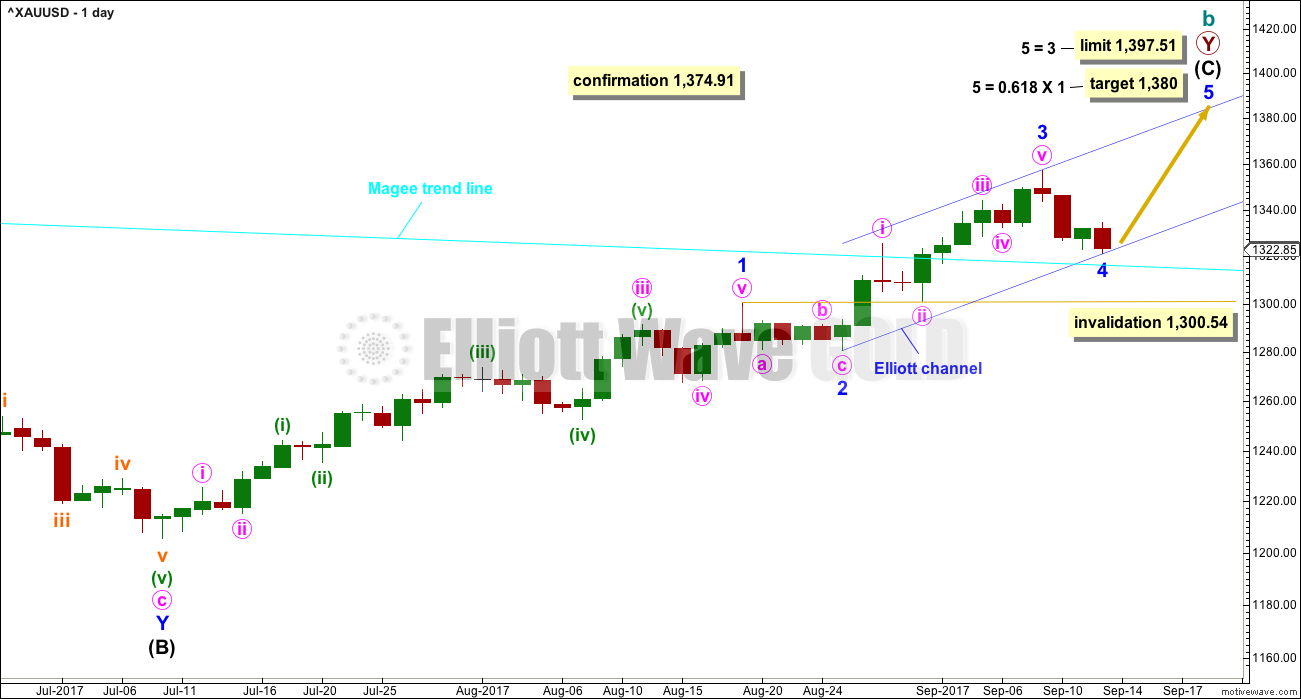
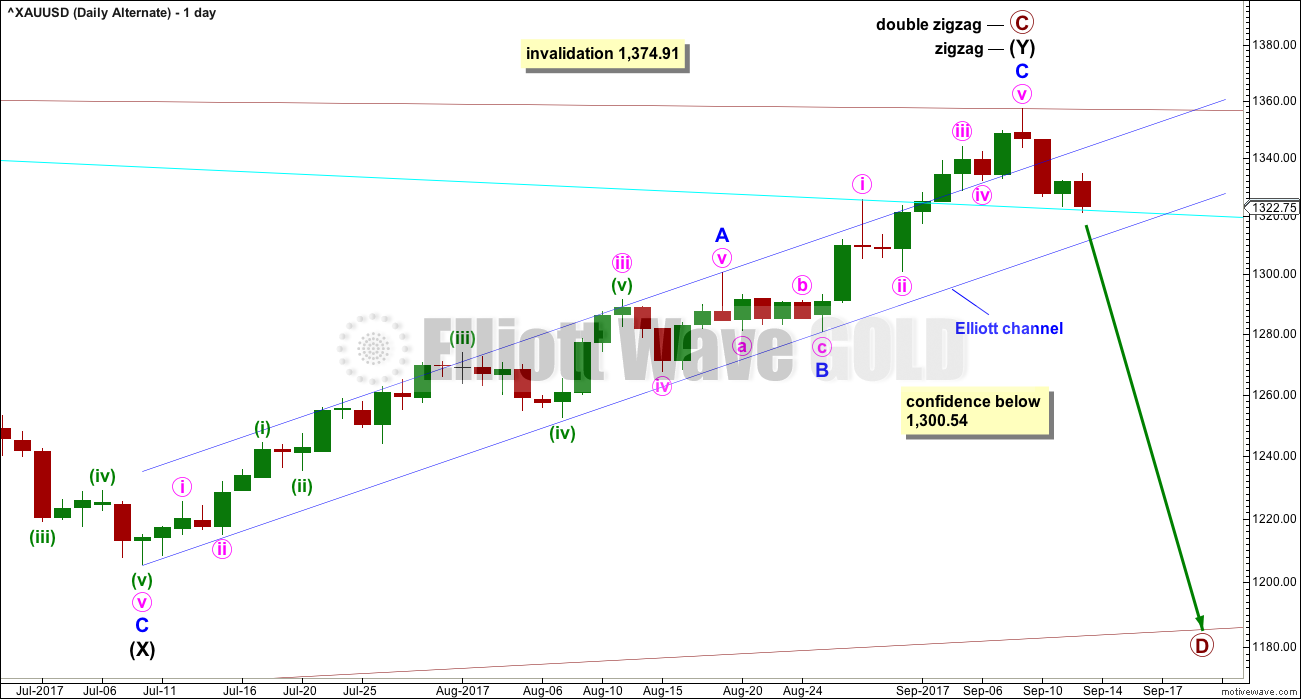
Intermediate wave (C) may be unfolding as an impulse.
Within the impulse, minor waves 1 through to 4 may now be complete.
Minor wave 2 may have ended as a relatively brief shallow second wave. It is unusual for second wave corrections to be this shallow. If my analysis of intermediate wave (C) is wrong, it may be in labelling minor waves 1 and 2 already over. It is possible that only minor wave 1 was over at last week’s high. If price moves below 1,300.54 at this stage, then I would expect a deeper more time consuming correction which would be labeled minor wave 2.
Minor wave 2 was a shallow 0.21 zigzag lasting five days. Minor wave 4 may be complete as a 0.47 zigzag lasting three days. There is some alternation in depth and little alternation in structure. Within the two zigzags, minute wave b within minor wave 2 is time consuming and minute wave b within minor wave 4 is quicker. This gives each correction a different look overall providing a little alternation.
It is also possible to move the degree of labelling within minor wave 4 down one degree; the zigzag may be only minute wave a of a triangle or flat correction for minor wave 4. Minor wave 4 may continue sideways for a few more days.
Minor wave 4 may not move into minor wave 1 price territory below 1,300.54.
Minor wave 4 should find very strong support at the cyan Magee trend line now if price gets down there. This would be a very typical curve down to back test support at prior resistance.
Fourth waves are often but not always contained within a channel drawn about the impulse using Elliott’s first technique. That is why Elliott developed a second technique to redraw the channel when a fourth wave breached it. The channel is redrawn today using the second technique: the first trend line is drawn from the ends of minor waves 2 to 4, then a parallel copy is placed upon the end of minor wave 3. If minor wave 4 continues any further, then the channel must again be redrawn.
HOURLY CHART
Click chart to enlarge.
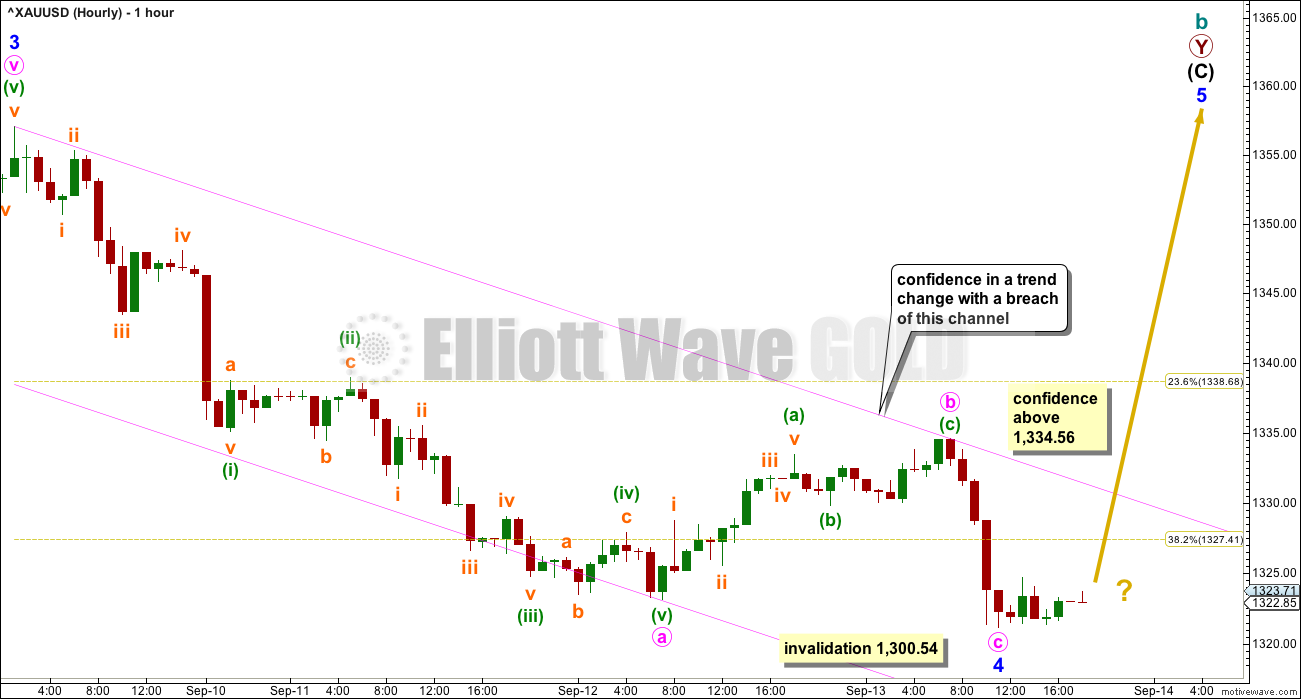
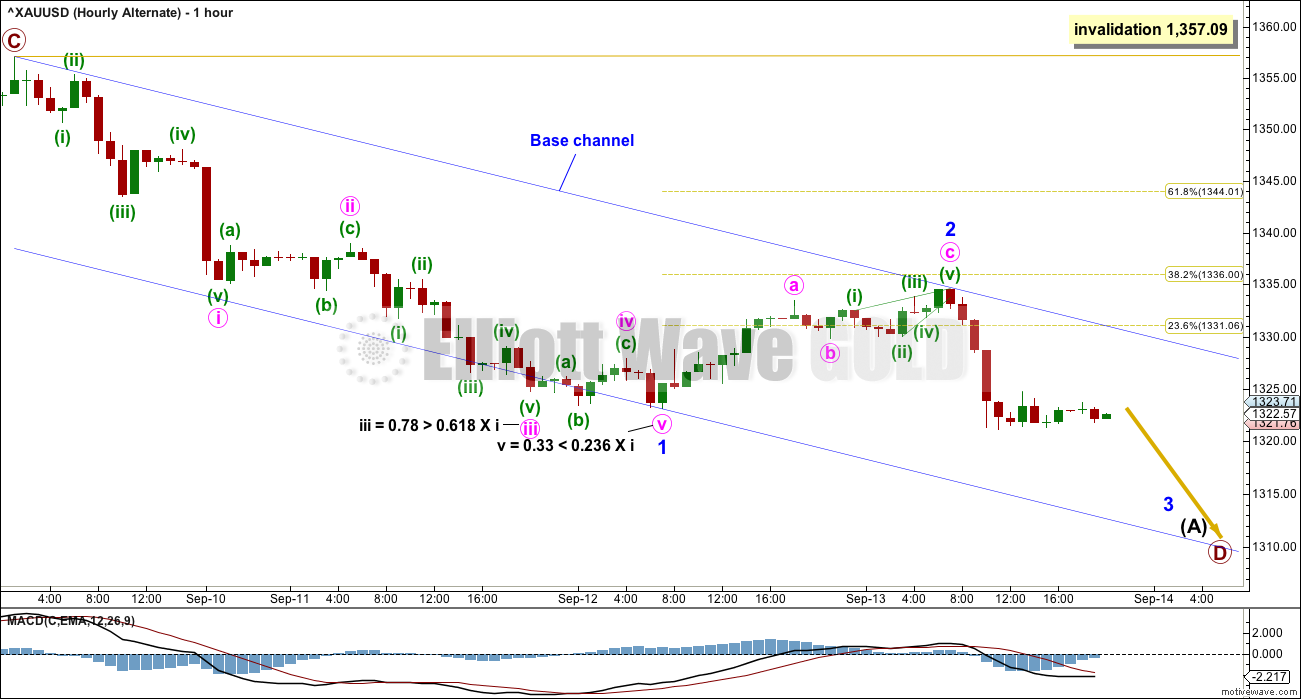
The proportions between minor waves 2 and 4 look reasonable at the daily chart level. It looks like minor wave 4 is a quicker sharper pullback where a sideways choppy consolidation was expected.
Price is now very close to the cyan trend line on the daily chart, so it looks like a typical curve down to back test support (that trend line should offer strong support). This indicates the correction may be over here or very soon indeed.
The small pink channel about minor wave 4 should be used as an indication of when it may be over. A breach of the channel would add some confidence. A new high above the start of minute wave c at 1,334.56 would add further confidence; at that stage, upwards movement could not be a second wave correction within minute wave c and at that stage minute wave c would have to be over.
It is also possible to move the degree of labelling within the zigzag labelled minor wave 4 all down one degree; this may only be minute wave a of a flat correction or a triangle. Both a flat and a triangle would expect mostly sideways movement, and an upwards swing here for the short term. If the next wave up shows any signs of weakness, then it may be a B wave and then an alternate wave count would be considered.
ALTERNATE ELLIOTT WAVE COUNT
WEEKLY CHART
Click chart to enlarge.
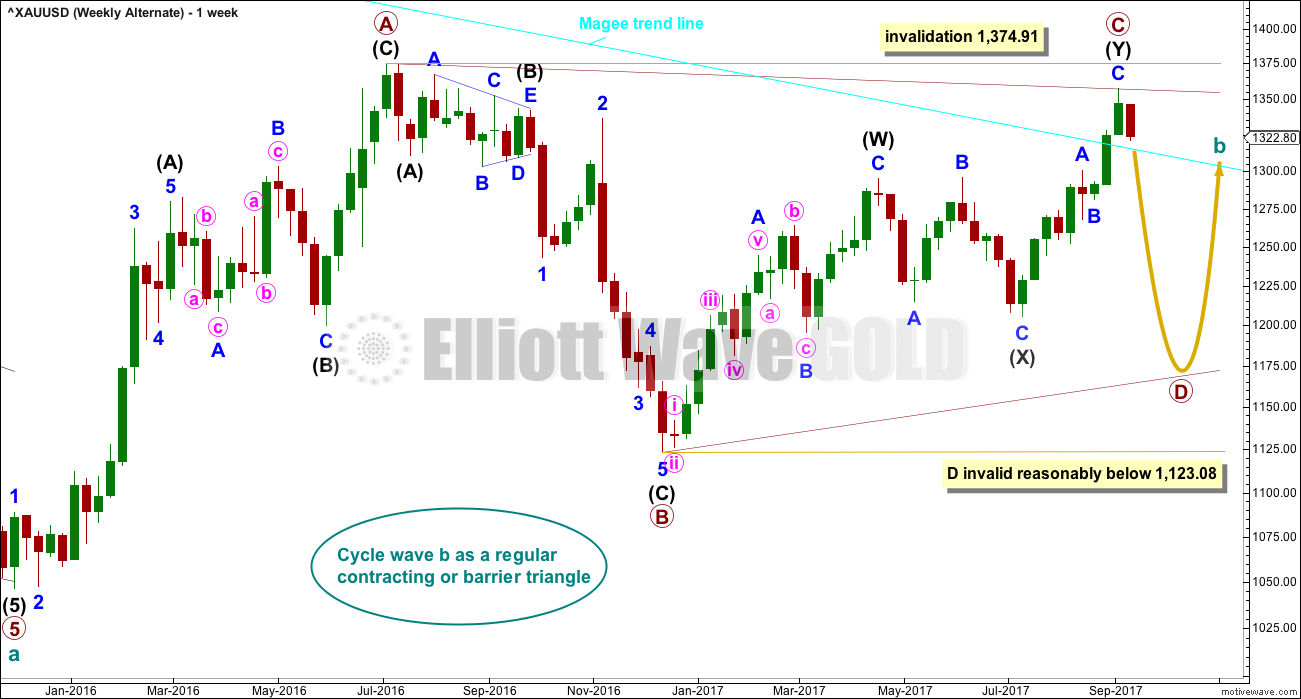
The Magee trend line is now breached by a full weekly candlestick above and not touching the line. This substantially reduces the probability of this wave count.
The Magee bear market trend line is drawn from the all time high for Gold on the 6th of September, 2011, to the first major swing high within the following bear market on the 5th of October, 2012.
To use this trend line in the way Magee describes, we should assume that price will find resistance at the line if it gets back up there. Now that the line is breached, it is signalling a major trend change from bear to bull.
Within a triangle, one sub-wave should be a more complicated multiple, which may be primary wave C. This is the most common sub-wave of the triangle to subdivide into a multiple.
Intermediate wave (Y) now looks like a complete zigzag at the weekly chart level.
Primary wave D of a contracting triangle may not move beyond the end of primary wave B below 1,123.08. Contracting triangles are the most common variety.
Primary wave D of a barrier triangle should end about the same level as primary wave B at 1,123.08, so that the B-D trend line remains essentially flat. This involves some subjectivity; price may move slightly below 1,123.08 and the triangle wave count may remain valid. This is the only Elliott wave rule which is not black and white.
Finally, primary wave E of a contracting or barrier triangle may not move beyond the end of primary wave C above 1,295.65. Primary wave E would most likely fall short of the A-C trend line. But if it does not end there, then it can slightly overshoot that trend line.
Primary wave A lasted 31 weeks, primary wave B lasted 23 weeks, and primary wave C started its 38th week. A double zigzag may be expected to be longer lasting than single zigzags within a triangle, and so this continuation of primary wave C is entirely acceptable and leaves the wave count with the right look at this time frame.
With upwards movement continuing, the A-C trend line now has too weak a slope. At this stage, this wave count now looks less likely.
DAILY CHART
Click chart to enlarge.
The cyan Magee trend line has now been breached. This must reduce the probability of this wave count.
A breach of the blue Elliott channel by downwards movement would indicate a trend change.
The structure of minor wave C may now be complete.
HOURLY CHART
Click chart to enlarge.
1-2-3 of an unfolding impulse subdivides 5-3-5, exactly the same as A-B-C of a zigzag. The subdivisions at the hourly chart level for this alternate are now seen in exactly the same way as the subdivisions for the main hourly chart.
It is slightly unusual for the first second wave correction within a new trend to be shallow; most often they are very deep. It is entirely possible that minor wave 2 may not be over and may continue higher as a flat correction or a double zigzag.
Minor wave 2 may not move beyond the start of minor wave 1 above 1,357.09.
TECHNICAL ANALYSIS
WEEKLY CHART
Click chart to enlarge. Chart courtesy of StockCharts.com.
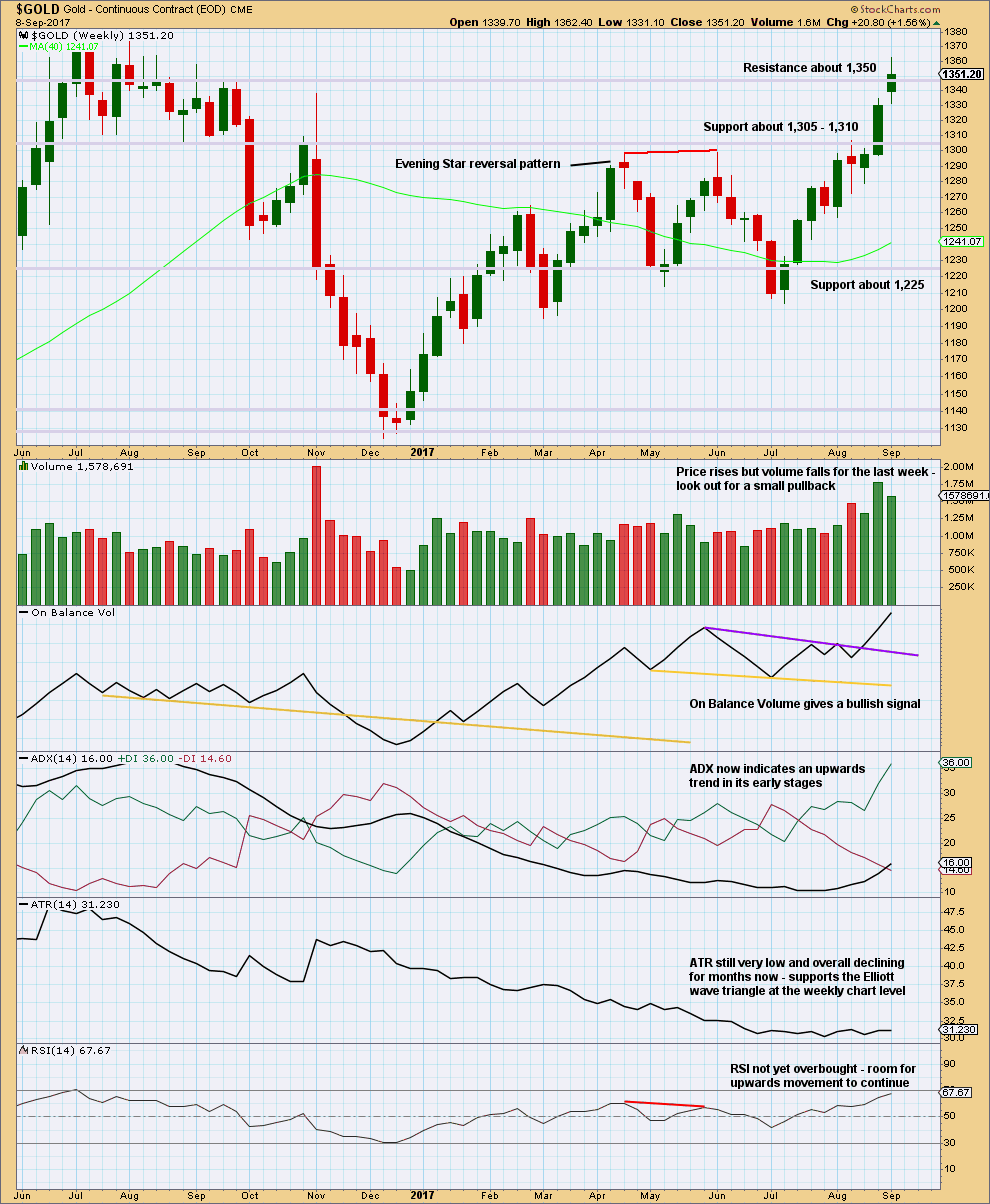
Overall, this chart is bullish. This trend may be expected to continue at least until weekly RSI reaches overbought.
A small pullback here within the upwards trend may pull RSI a little lower allowing more room for upwards movement to continue.
DAILY CHART
Click chart to enlarge. Chart courtesy of StockCharts.com.
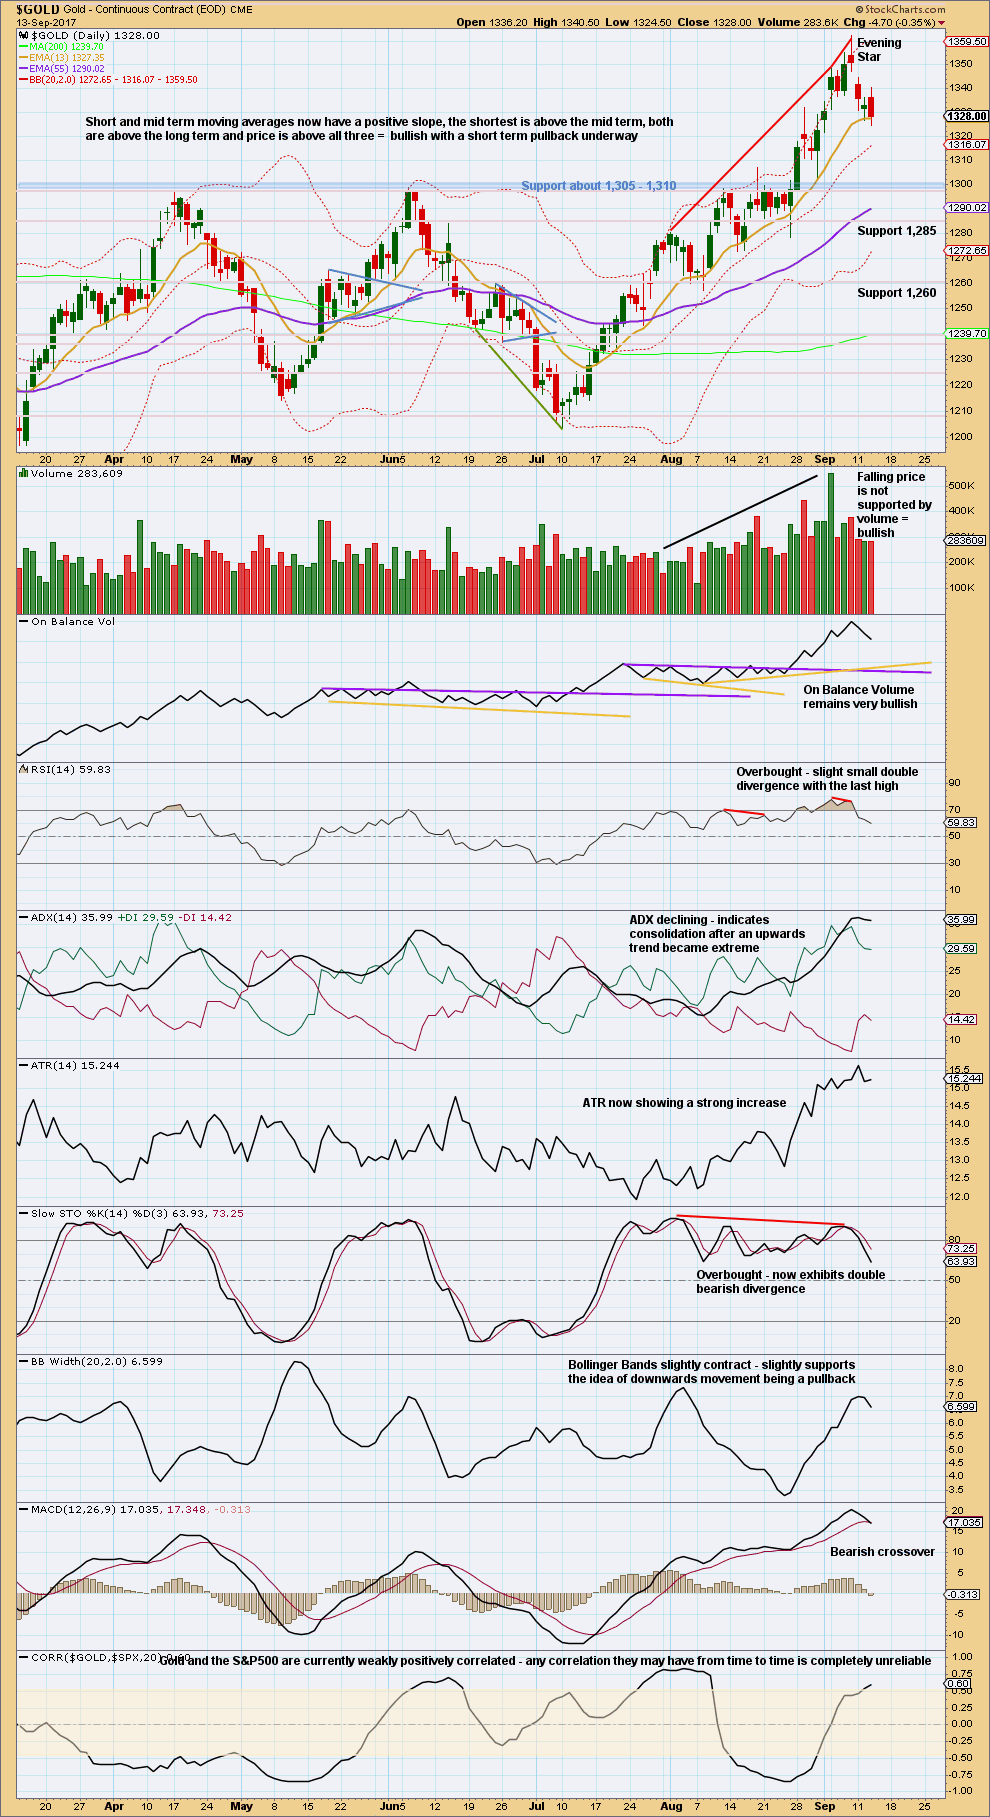
An Evening Star candlestick pattern indicates a trend change from up to either down or sideways. Candlestick reversal patterns do not necessarily mean a switch from up to down or down to up, they may also indicate a switch to sideways. This offers some support to the Elliott wave count.
Volume continues declining as price falls. Pullbacks and consolidations most typically come with lighter volume. Only should this view change if downwards movement continues and has support from volume. At this point, the data available indicates a consolidation.
The pullback may find support here at the short term Fibonacci 13 day moving average.
GDX
DAILY CHART
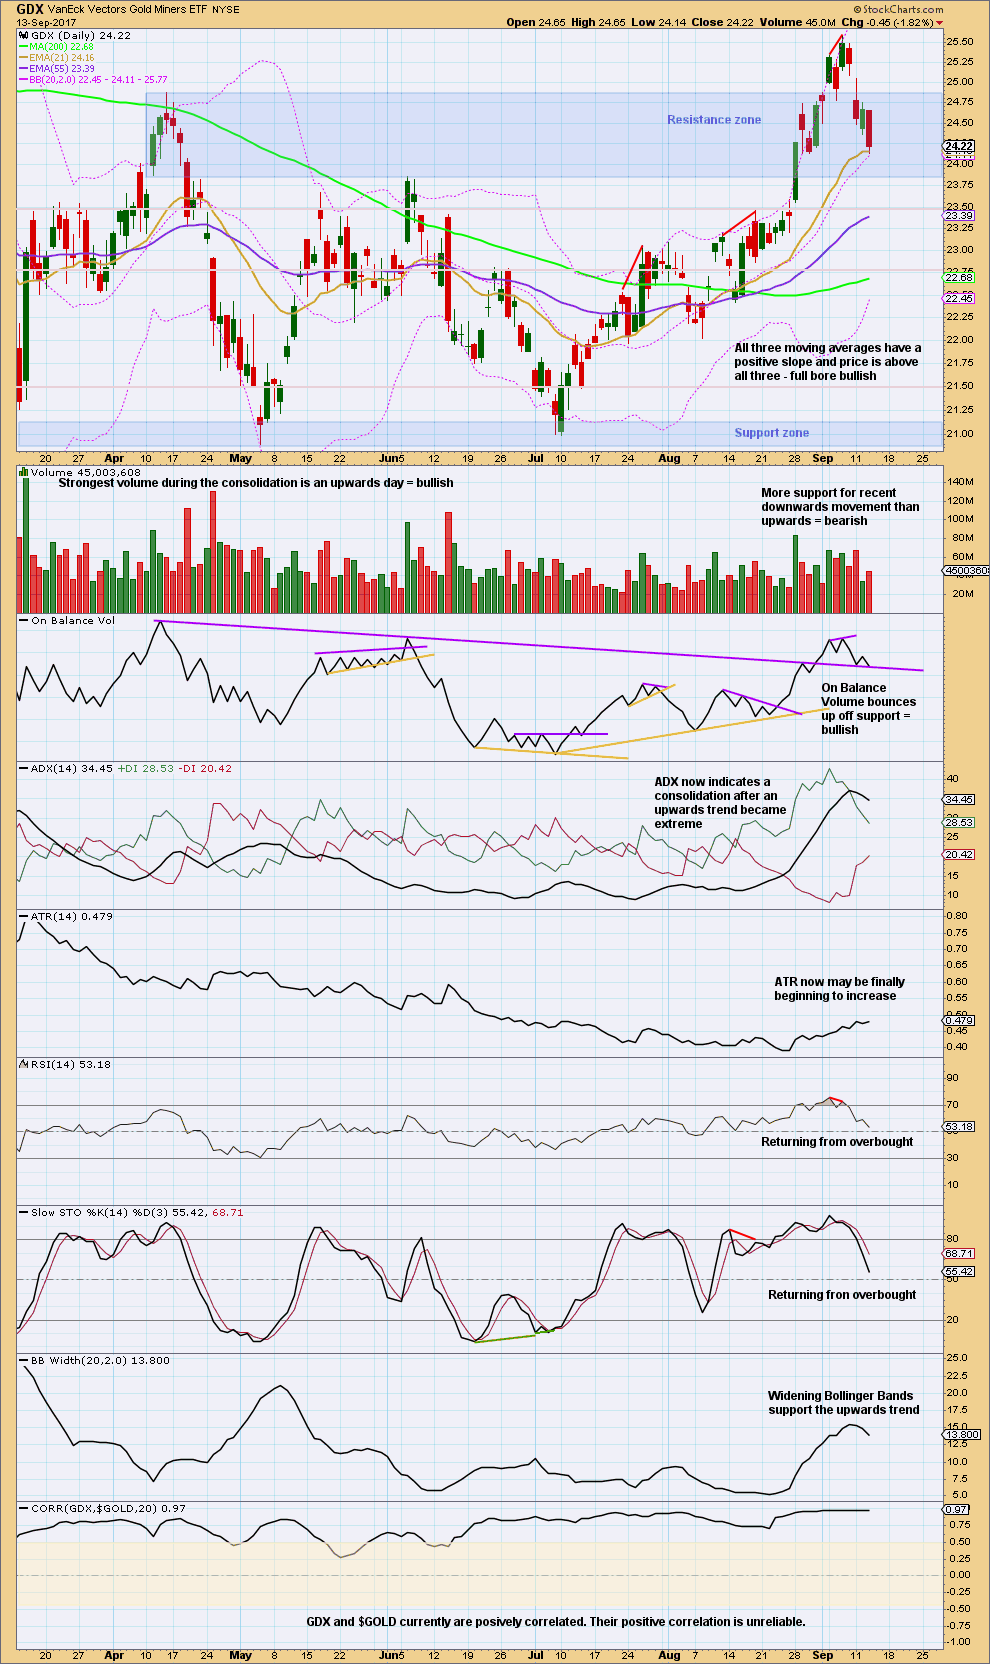
Click chart to enlarge. Chart courtesy of StockCharts.com.
On Balance Volume is again right at support.
Price is very close to the Fibonacci 13 day moving average, which is about where it normally finds support for short term pullbacks.
The correction may end soon.
Some increase in volume for a downwards day and no long lower wick on a strong red daily candlestick does suggest a little more downwards movement to come for the short term.
GOLD THIRD WAVE EXAMPLE – DAILY CHART
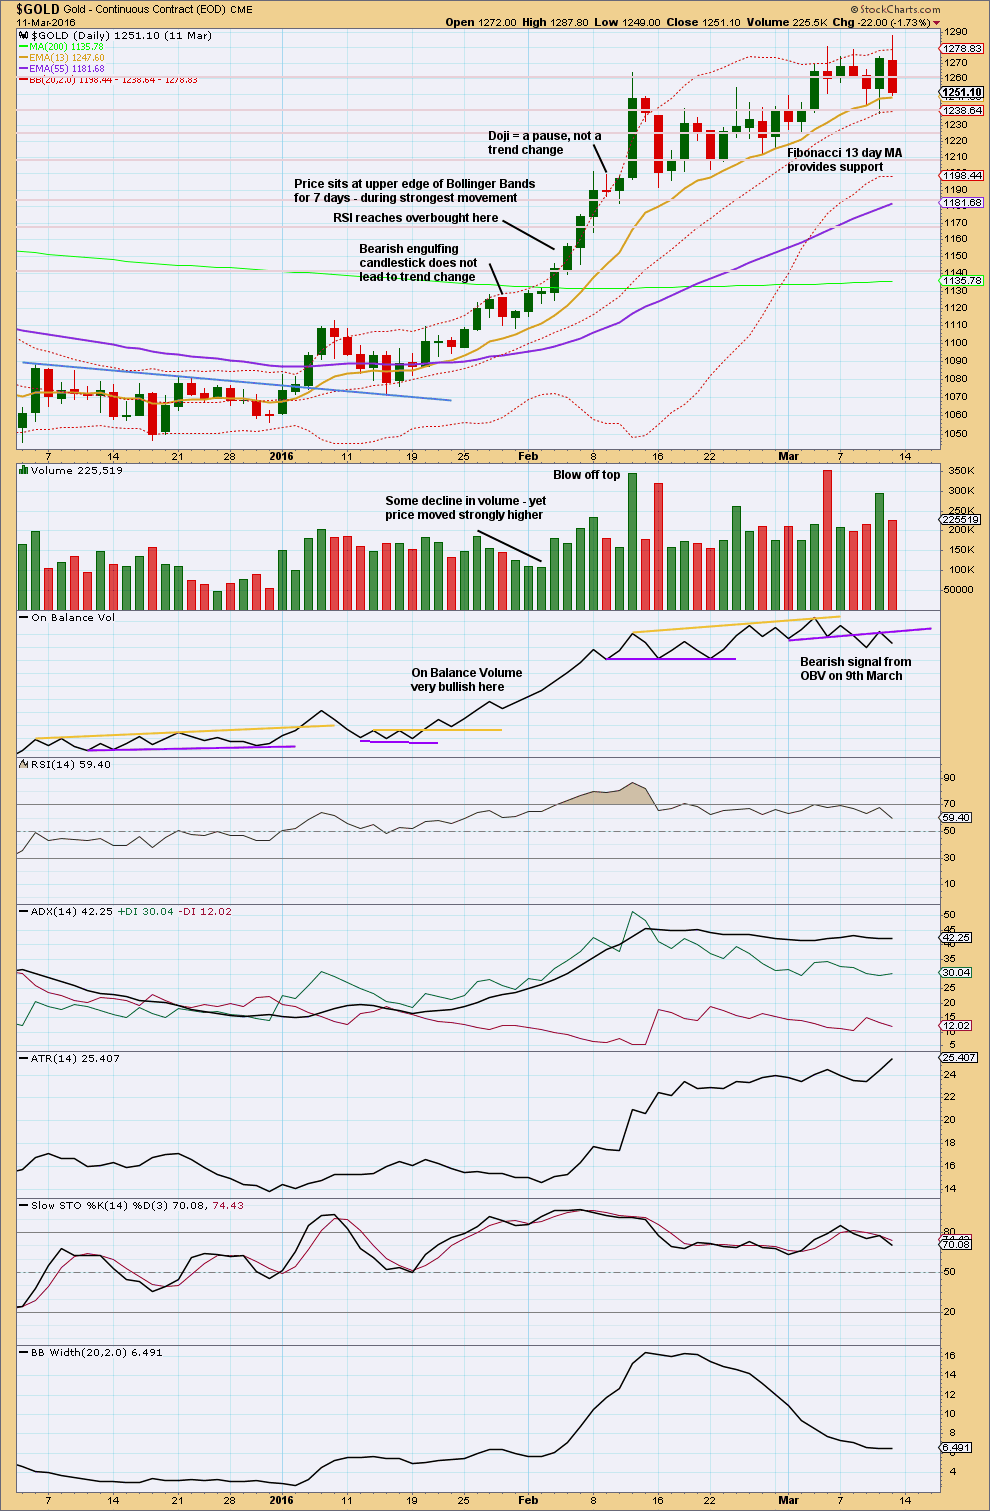
Click chart to enlarge. Chart courtesy of StockCharts.com.
This section will be left at the end of analysis until either the current wave count is proven wrong, or the third wave we are expecting has completed.
This chart has been published before. It shows the most recent example of a strong third wave in Gold from December 2015 to March 2016.
Note that during this strong upwards trend:
– RSI first reached overbought on the 4th of February and price then continued strongly higher for five more days culminating in a blowoff top on the 11th of February.
– RSI and Stochastics remained extreme for most of the second half of the trend. At the final high, they both exhibited strong divergence with price.
– Price found support at the short term Fibonacci 13 day moving average during the entire trend.
– All signals from On Balance Volume were bullish right up to the end of the trend. The 9th of March shows the first bearish signal, which was an important warning of a trend change.
– The trend begins with choppy overlapping and some hesitancy.
– The 6th of January was an important upwards breakout from resistance, with support from volume. Thereafter, price moved more strongly.
– While overall volume supported the upwards movement in price, this was not linear. Some weaker days occurred yet price continued higher. It is the overall trend of volume which is more important than any one or two days. On Balance Volume remaining bullish was an important guide.
No two waves are the same. So if the current wave count is correct, it may be different from this example. However, there are some important lessons to be learned here:
1. On Balance Volume is an important guide. Bullish signals should be taken seriously, particularly early on in the trend. Later in the trend, with RSI and Stochastics overbought, any bearish signal from On Balance Volume should see long positions closed.
2. RSI and Stochastics can reach extreme overbought. Only when they have been extreme for some time and then exhibit strong divergence should it be taken as a warning of a trend change.
Published @ 08:10 p.m. EST.
Imo Gold price is still toppy between 1337-1343. Expecting another pullback later today possibly down to 1320-1318. Lets see how this pans out.
North Korea launched the much-awaited missile, “encouaging” gold price to rise after hours.
Kim sure likes attention. This isn’t going to end well…
Gold making a strong move up after hours. Bottom’s in.
Lara, if/when you are looking for another Education / Reference topic, I think one on drawing channels would be very useful.
Elliott’s 1st and 2nd techniques, as well as Best Fit and Base channels come to mind (any other?). Including the when, why, and how to use them with examples would be great.
Thanks as always.
I agree with Dreamer about his suggestion
Brilliant! I should be doing two education posts weekly, and so I’m always looking for ideas.
So thank you very much!
Updated hourly chart:
It only fits now as a double zigzag for minor 4. That provides better alternation with the single zigzag of minor 2.
The best fit channel is breached. On the daily chart minor 4 has now come down to perfectly touch the cyan trend line. I am expecting a bounce up from here.
This fifth wave may be weaker than the third wave, so that the third wave isn’t the weakest. It was shorter and weaker than minor 1.
Overlapping, crisscross choppy price movement by Gold. Crazy stuff lol. Got the pullback to 1316 that I was looking for over the last few days: (KITCO low 1315.40, Others 1315.49) and Gold price appears to have found support here. Imo it would probably take more than a break and hold above 1332.35 mentioned by Alan or 1334.56 as mentioned by Lara to propel momentum back up. Upside still seen as limiting 1340s. Lets see how this closes today – above or below pivot. Tomorrow is another day. GL all, happy trading.
Cheers for that Syed.
There is a lot of resistance and support in this area. So there’s some work here to be done before price can move up and away.
Thank u so much lara mam u r advise super
Super super in gold advisory lara madam please i want to talk once with u how madam
I can see that English is probably your second language, and so I understand you may find the analysis more challenging to follow.
Watch the videos on the Education page.
Read the analysis daily. Ask questions in the comments. Over time my analysis is designed to teach you all about Elliott wave, and some classic technical analysis too.
Know that here at Elliott Wave Gold we have some long standing members who have been members for many years now, some of them are professional traders with decades of experience.
Some of them will share their charts and analysis here, you can also learn from them.
Some people sometimes share their trades here. You may also learn from that.
I encourage sharing and conversation here, as long as it meets the comments policy which is very strict.
syed sir gold comes down present from high to low
buying is very risk i think
But Viky madam why you think buying is very risk? Already Gold price makes the $7 profit from low of the day. Thank you madam.
:- ) Looks like he is new joinee.
Viky…. You need to call Lara as Lara Madam/Mam or just Lara.
Cheers. Just “Lara” works fine with me 🙂
larA sir please once chek gold this is the right time gold sell heavy down please once chek four wave means heavy down
It’s hardly moved at all.
My analysis remains the same.
Please do not call me sir. I am not a man.
Hey, that reminds me of an awesome scene in Lord of The Rings:
https://youtu.be/aNL9oljAFqM
Didn’t know you had such a violent side. lol…
Crikey, no. I’m not violent at all. Just a big LOTR fan.
When my son was a small child I had to help him fight Orcs in our back yard every day. So I have to say that I do have some experience 🙂
Gold Ichimoku Daily Analysis
Data as at market close, September 14
================================
Gold prices saw a deep pullback since the beginning of the week. The primary driver could be the crowd sentiment arising from the fundamentals which I had just discussed. I am toying with the idea that the drop from the high of 1357.09 to today’s current low at 1319.40 is still incomplete. On the Daily Ichimoku Chart, yesterday’s candle was bearish engulfing, signifying more pain to follow. Although the bigger picture is one of bullishness, as evidenced by tenkan-sen > kijun-sen and the kumo being green, as well as price > 50-day MA > 200-day MA, the intraday picture is more gloomy (not shown as I can only post one diagram at any one time). In the hourly chart, prices have broken down below the kumo, meaning that more downside should be expected. Prices could drop to as low as the orange trendline, or the daily kijun-sen at 1309.70. At the same time, we should also keep an eye on the daily tenkan-sen resistance at 1332.35. Breaking it will confirm that the downtrend is over.
and it worked out exactly as you expected.
nicely done Alan! thank you for sharing
Fundamental Perspective of Gold’s Recent Drop
——————————————————————————
September 9 was the 69th anniversary of North Korea’s founding. The rumoured missile launch earmarked for that day failed to materialize. This Monday, the UN security council approved the expansion of a package of economic sanctions against Pyongyang. After some negotiations, with the US agreeing to drop some key measures such as a total ban on oil shipments into North Korea, it came as no surprise that Beijing and Moscow jumped on board. Personally, I feel that economic sanctions will not work against Pyongyang, never had. Putin had it right when he remarked that the North Koreans would “rather eat grass than give up nukes”. But, the world bought into the sanctions story. Immediately the US dollar’s abrupt drop was halted, and reversed. Similarly, stocks took a breather from their current slide. At the same time, the consequences of the hurricane Irma were not as terrible as originally thought. Now, gold’s recent rally from 1205.41 on July 10 was due to the escalation of the geopolitical conflict in the Korean peninsula, the fears of the impact of hurricanes on the US economy, and the weakness of the US dollar. These factors have, in the twinkling of an eye, gone into the shadows, leaving gold embroiled in the worst daily dynamics in the last two months.
But, that’s not the end of the story. An increase in economic pressure is unlikely to put North Korea on its knees. Here is a country which had been fighting for its survival since Day 1, being the reluctant unwanted child of the Russians, and a little austerity hardly creates a dent. On the contrary, this move had infuriated Kim Jong-Un who vowed to have another nuclear test pretty soon, possibly over this weekend. This means that geopolitics will certainly make itself felt. And if so, gold price will see another spike.
GDX hourly chart shown. Looks like the correction is very close to complete. Should be a great buying opportunity.
It’s possible that subminuette 4 is already complete and therefore the overall correction is complete, but a more pronounced 4th wave as shown would look better. Good trading.
https://www.tradingview.com/x/ecGhwimb/
I completely agree with the sentiment that down at the hourly chart level 3’s look like 5’s and vice versa.
Nice work Dreamer. Thank you as always for sharing. This membership is much richer for having you and Alan especially in it 🙂
Thank you Lara
Gold can not be go up its go only sell side fourth wave running gold come heavy down dbt buy i think lara sir
Imo toppy under 1330, lucky if this gets to and past 1325; further pullback expecting for anticipated target 1316-1312; at this rate Gold price could be sub 1300 by the end of the week for 1298-96 lol… Anyhow, upside move to look out for today; who is to say what’s in store.
With new after hours low in gold the C wave to end minor 4 on main hourly chart no longer conveniently works. This actually better fits alternate hourly. This is concerning for bullish case.
Other possibility is maybe labelling of down movement could change such as a double zig-zag?
Nailed it! DZZ
Thanks. 👍