
Upwards movement was expected after last analysis. Friday completed a higher high and a higher low, but a deep pullback at the end of the session closed the candlestick red. Price remains above the invalidation point on the hourly chart.
Summary: The target is now 1,376. The limit is now 1,393.92. Stops may be set just below the cyan Magee trend line.
If price breaks below the cyan trend line, then long positions should be exited and shorts considered.
Always use a stop. Invest only 1-5% of equity on any one trade.
New updates to this analysis are in bold.
Last monthly charts for the main wave count are here, another monthly alternate is here, and video is here.
Grand SuperCycle analysis is here.
MAIN ELLIOTT WAVE COUNT
WEEKLY CHART
Click chart to enlarge.
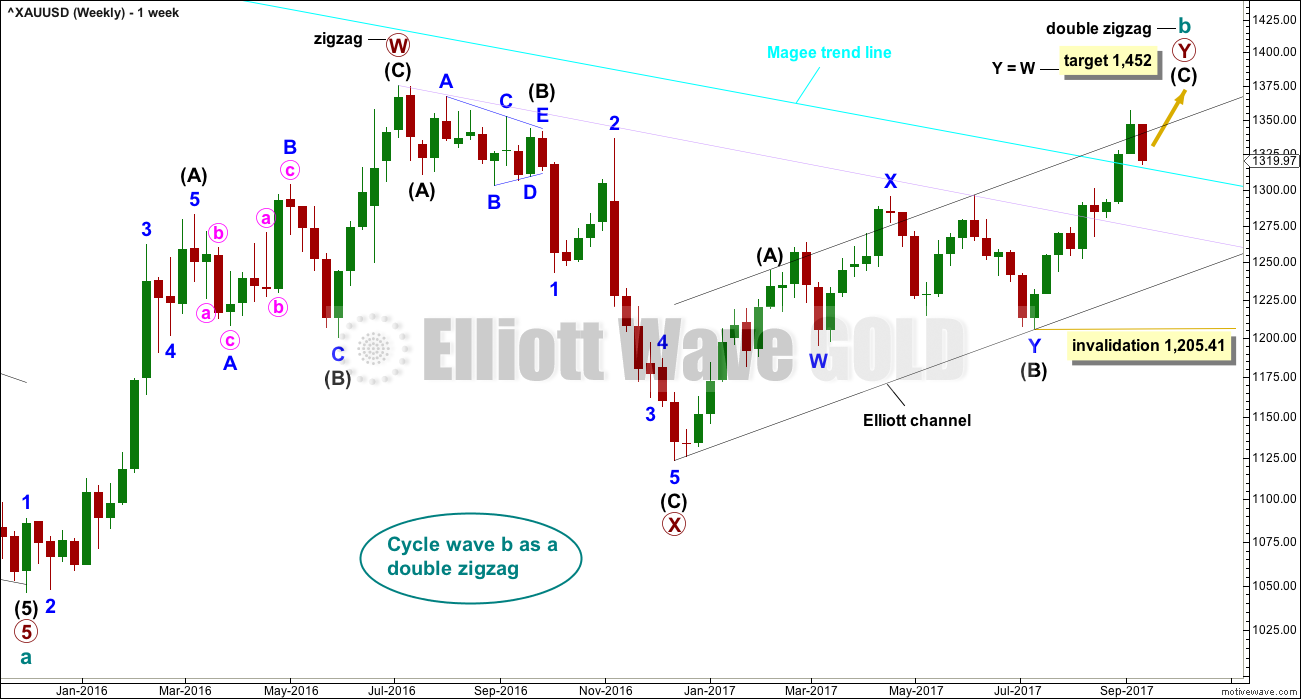
There is strong support from classic technical analysis for this wave count. Now that price has fully broken above the Magee trend line and has broken out above a consolidation zone, with support from volume, this wave count will now be the main wave count.
There are more than 23 possible corrective structures that B waves may take, and although cycle wave b still fits well at this stage as a triangle, it may still be another structure. This wave count looks at the possibility that it may be a double zigzag.
If cycle wave b is a double zigzag, then current upwards movement may be part of the second zigzag in the double, labelled primary wave Y.
The target remains the same.
Within intermediate wave (C), no second wave correction may move beyond the start of its first wave below 1,205.41.
There are two problems with this wave count which reduce its probability in terms of Elliott wave:
1. Cycle wave b is a double zigzag, but primary wave X within the double is deep and time consuming. While this is possible, it is much more common for X waves within double zigzags to be brief and shallow.
2. Intermediate wave (B) within the zigzag of primary wave Y is a double flat correction. These are extremely rare, even rarer than running flats. The rarity of this structure must further reduce the probability of this wave count.
Although this wave count still has these problems, technical analysis now points to it being more likely. The alternate will continue to be considered until price invalidates it.
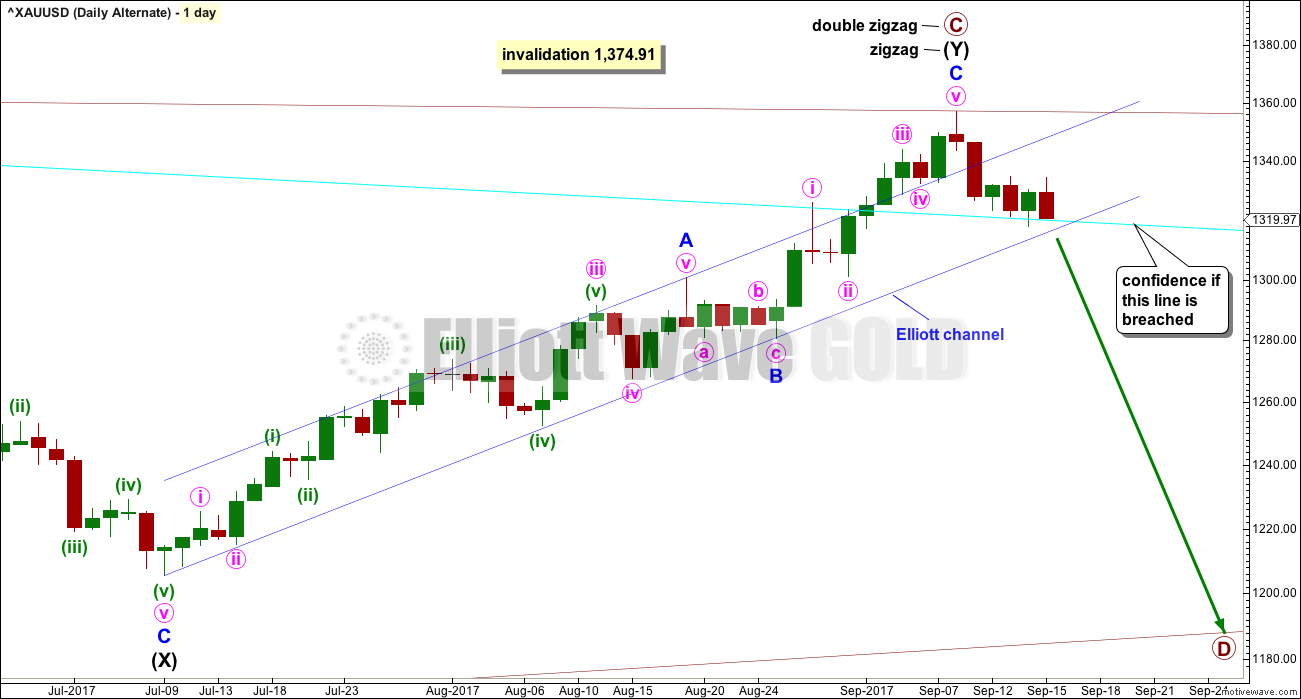
DAILY CHART
Click chart to enlarge.
The analysis will focus on the structure of intermediate wave (C). To see details of all the bull movement for this year see daily charts here.
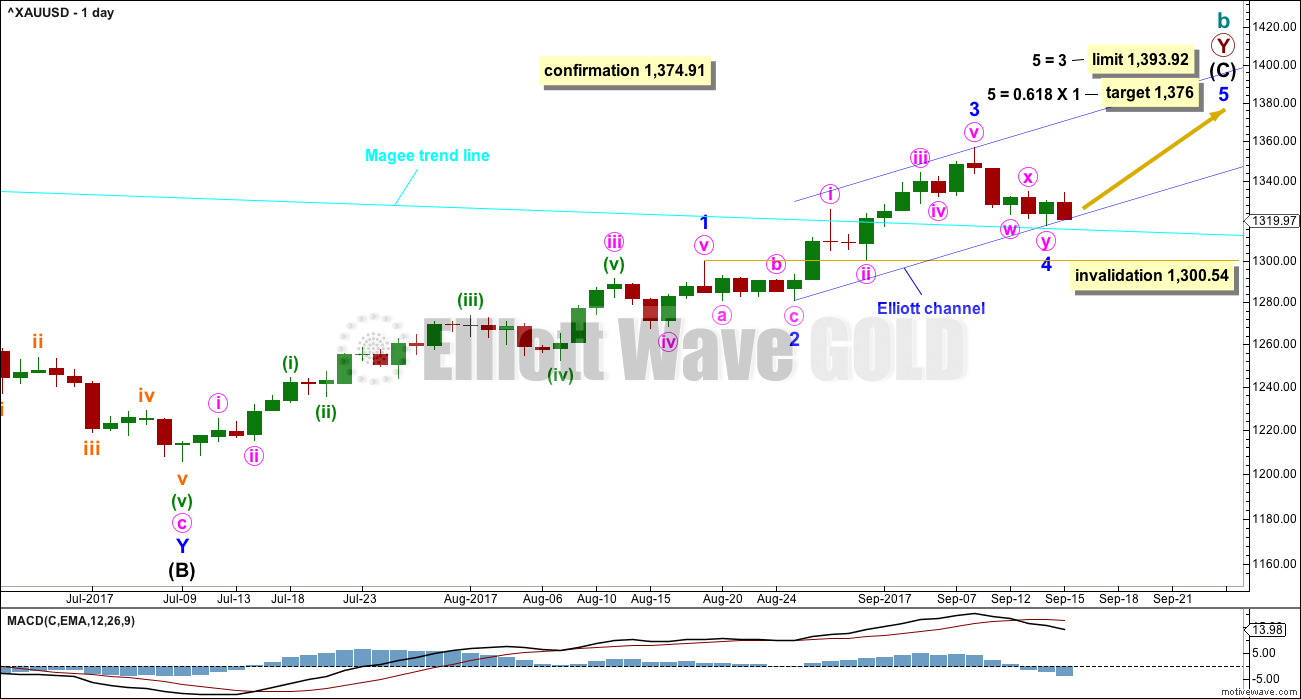
Intermediate wave (C) must be a five wave structure, either an impulse or an ending diagonal. It is unfolding as the more common impulse.
Within intermediate wave (C), minor waves 1 through to 4 now look complete. If my labelling of intermediate wave (C) is wrong, it may be in labelling minor wave 1 complete lower down; it is also possible that minor wave 1 only was complete at the last high.
For now this labelling fits with MACD. Minor wave 3 exhibits stronger momentum then minor wave 1. Minor wave 3 is 18.80 shorter than minor wave 1. This will limit minor wave 5 to no longer than equality in length with minor wave 3, so that minor wave 3 is not the shortest wave and the core Elliott wave rule is met.
There is alternation between the very shallow 0.21 single zigzag of minor wave 2 and the deeper 0.52 double zigzag of minor wave 4. Minor wave 2 lasted five days and minor wave 4 has lasted four days. There is excellent proportion giving the wave count the right look.
It is possible that minor wave 4 may move very slightly lower, still finding support at the cyan trend line. The second zigzag of minute wave y may not be quite complete; it may move to a slight new low on Monday before price turns up strongly.
This pullback look like an absolutely typical back test of support after a trend line is breached. Expect support to hold there as most likely. A more bearish view should only be considered if that line does not hold.
Minor wave 4 may not move into minor wave 1 price territory below 1,300.54.
HOURLY CHART
Click chart to enlarge.
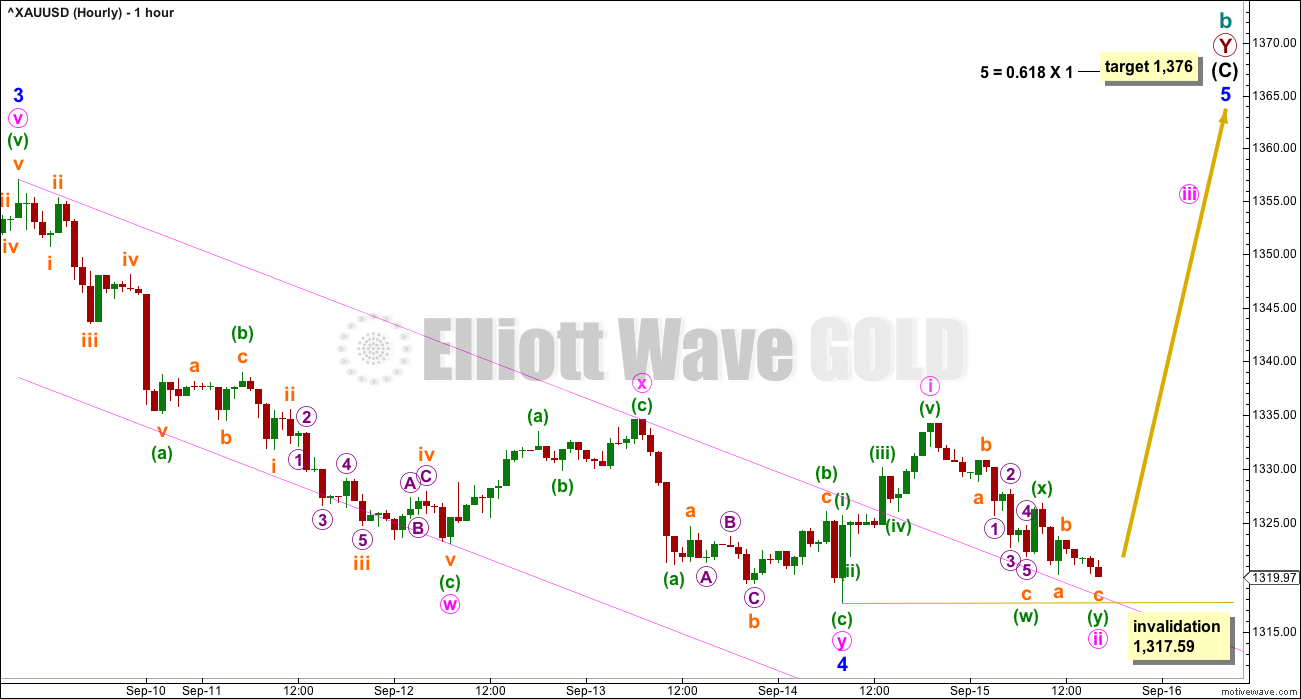
Minor wave 4 fits as a double zigzag.
Minor wave 5 must subdivide as a five wave structure, either an ending diagonal or more commonly an impulse.
Within an impulse, the first second wave correction is usually very deep. Here, minute wave ii fits now as a double zigzag and is very deep. This follows typical behaviour for Gold.
After a breach of the pink trend channel containing minor wave 4, it looks like price is now finding support at that line.
Minute wave ii may not move beyond the start of minute wave i below 1,317.59.
If this invalidation point is breached, then minor wave 4 may be moving very slightly lower. Stops should be set just below the cyan line, not just below the invalidation point at this time.
ALTERNATE ELLIOTT WAVE COUNT
WEEKLY CHART
Click chart to enlarge.
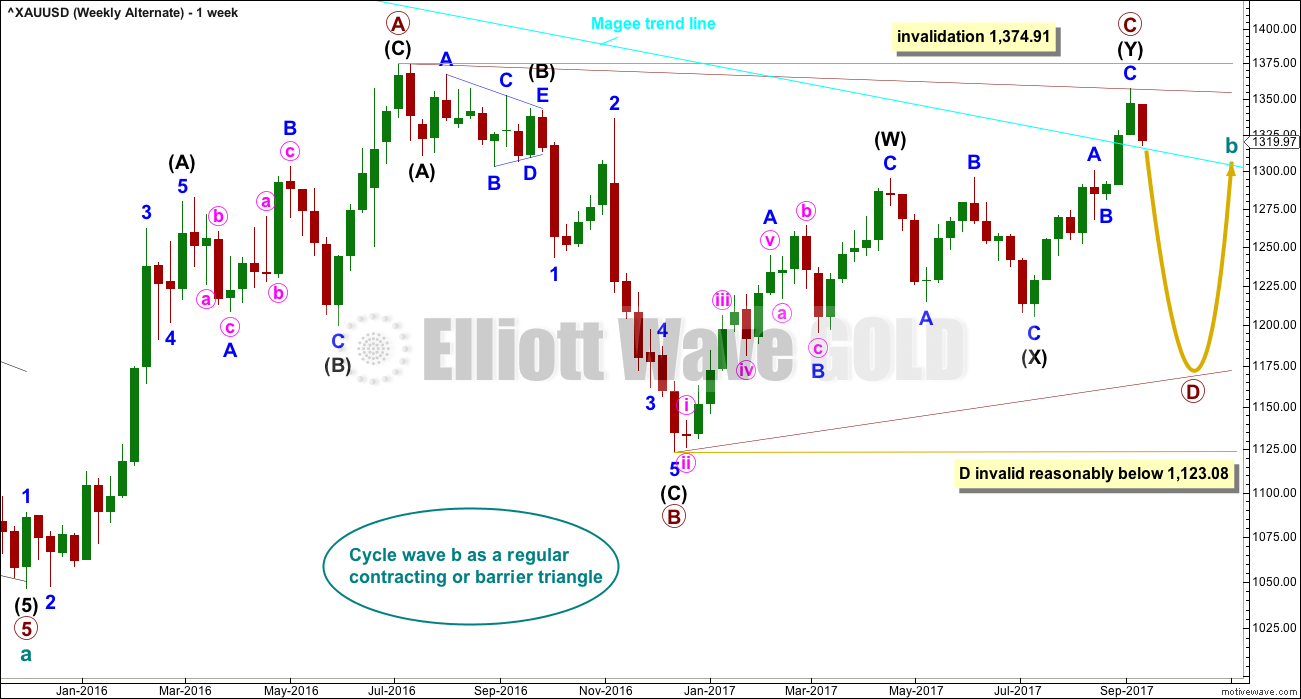
The Magee trend line is now breached by a full weekly candlestick above and not touching the line. This substantially reduces the probability of this wave count.
The Magee bear market trend line is drawn from the all time high for Gold on the 6th of September, 2011, to the first major swing high within the following bear market on the 5th of October, 2012.
To use this trend line in the way Magee describes, we should assume that price will find resistance at the line if it gets back up there. Now that the line is breached, it is signalling a major trend change from bear to bull.
Within a triangle, one sub-wave should be a more complicated multiple, which may be primary wave C. This is the most common sub-wave of the triangle to subdivide into a multiple.
Intermediate wave (Y) now looks like a complete zigzag at the weekly chart level.
Primary wave D of a contracting triangle may not move beyond the end of primary wave B below 1,123.08. Contracting triangles are the most common variety.
Primary wave D of a barrier triangle should end about the same level as primary wave B at 1,123.08, so that the B-D trend line remains essentially flat. This involves some subjectivity; price may move slightly below 1,123.08 and the triangle wave count may remain valid. This is the only Elliott wave rule which is not black and white.
Finally, primary wave E of a contracting or barrier triangle may not move beyond the end of primary wave C above 1,295.65. Primary wave E would most likely fall short of the A-C trend line. But if it does not end there, then it can slightly overshoot that trend line.
Primary wave A lasted 31 weeks, primary wave B lasted 23 weeks, and primary wave C started its 38th week. A double zigzag may be expected to be longer lasting than single zigzags within a triangle, and so this continuation of primary wave C is entirely acceptable and leaves the wave count with the right look at this time frame.
With upwards movement continuing, the A-C trend line now has too weak a slope. At this stage, this wave count now looks less likely.
DAILY CHART
Click chart to enlarge.
The cyan Magee trend line has now been breached. This must reduce the probability of this wave count.
A breach of the blue Elliott channel by downwards movement would indicate a trend change.
The structure of minor wave C may now be complete.
If price makes a new low below 1,317.59 next week, then this wave count may again be seriously considered. That would involve a failure of the Magee bear market trend line, which would be unusual but is not without precedent.
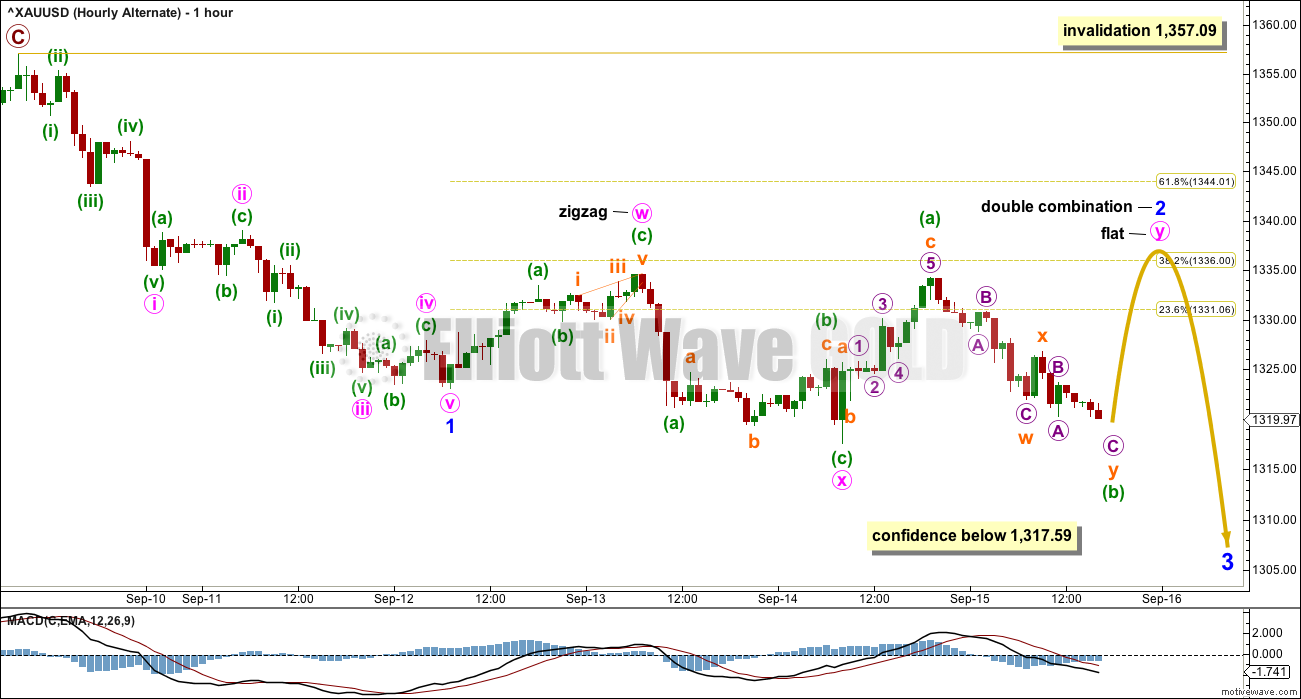
HOURLY CHART
Click chart to enlarge.
Minor wave 2 may be continuing sideways as a double combination. The most common two structures in a double combination are one zigzag and one flat correction.
Within the flat correction of minute wave y, minuette wave (b) must move slightly lower to retrace a minimum 0.9 length of minuette wave (a) at 1,319.26. Minuette wave (b) may make a new low below minuette wave (a) as in an expanded flat.
The purpose of double combinations is to take up time and move price sideways. To achieve this purpose the second structure in the double normally ends close to the same level as the first structure. Minute wave y may end about 1,335.
Minor wave 2 may not move beyond the start of minor wave 1 above 1,357.09.
TECHNICAL ANALYSIS
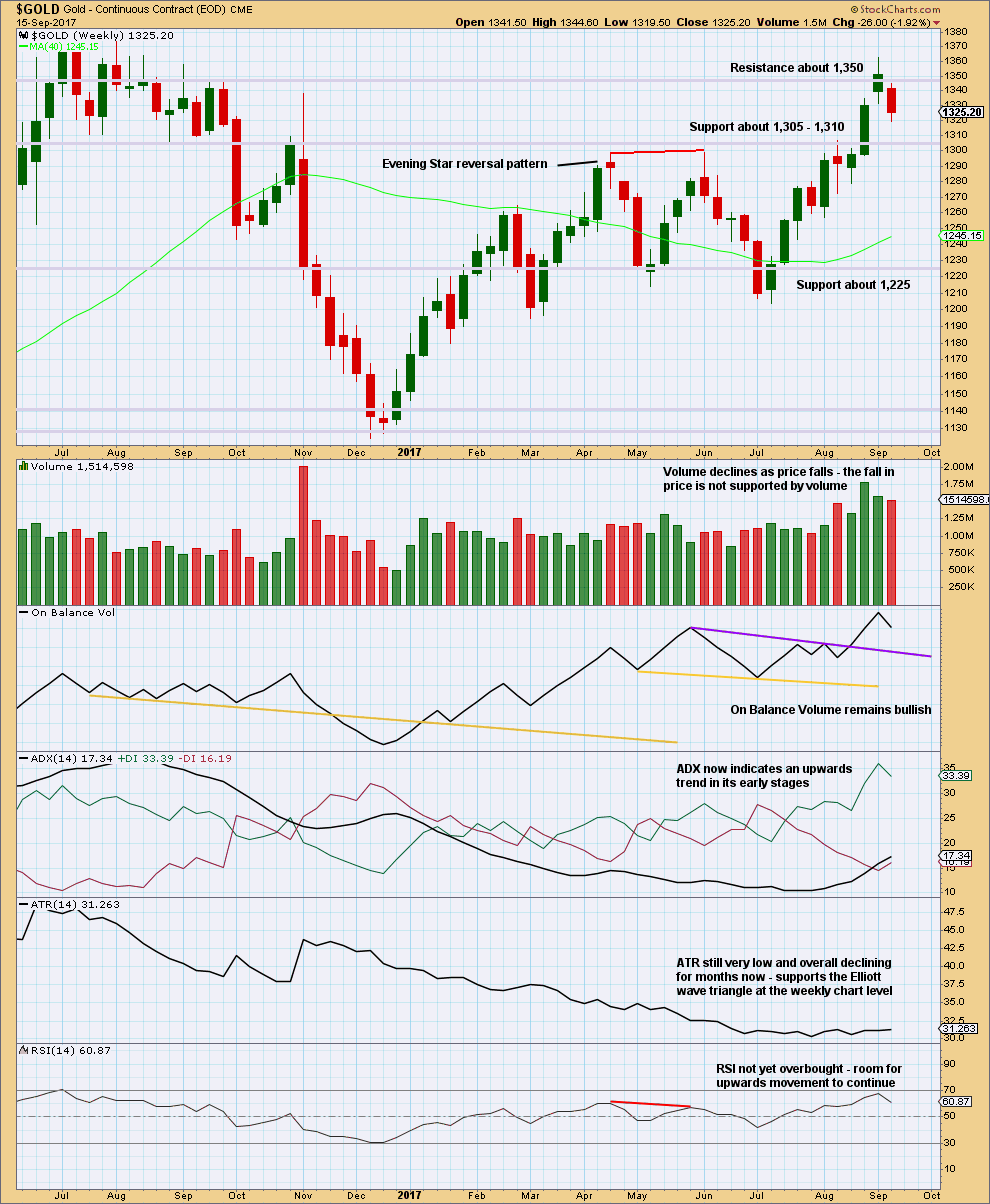
WEEKLY CHART
Click chart to enlarge. Chart courtesy of StockCharts.com.
This weekly candlestick completes as very bearish. It is not engulfing the prior weekly candlestick, but it is even more bearish than that. The week gaps open lower and then closes well below the prior weekly candlestick. Bears dominated this week. They managed to pull price down to new lows substantially below the prior week, closing below the lower wick of the week before.
This candlestick supports the alternate Elliott wave count.
ADX and On Balance Volume however remain very bullish.
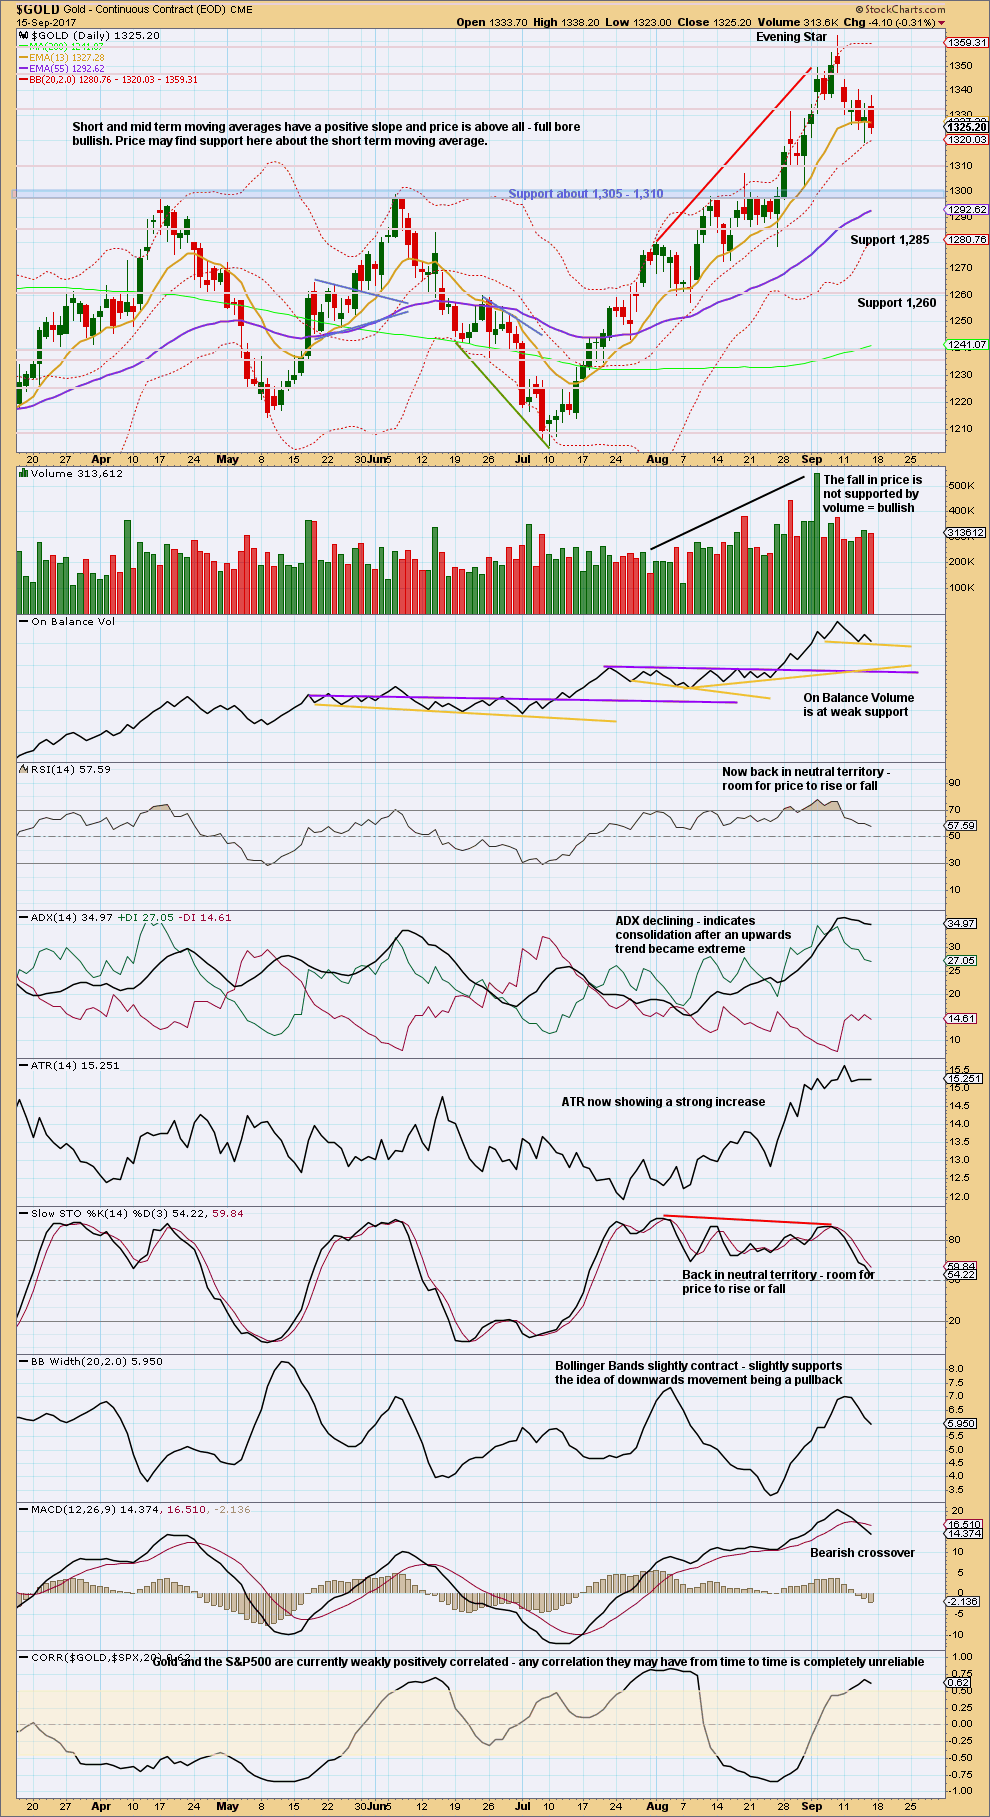
DAILY CHART
Click chart to enlarge. Chart courtesy of StockCharts.com.
This chart is mixed.
Bearish: the Evening Star reversal pattern, extreme ADX now declining, and MACD.
Bullish: short term volume profile, On Balance Volume, and Bollinger Bands.
Neutral: RSI and Stochastics.
A bearish signal from On Balance Volume would be required for a more bearish outlook. If On Balance Volume moves lower on Monday, that would provide such a signal.
GDX
DAILY CHART
Click chart to enlarge. Chart courtesy of StockCharts.com.
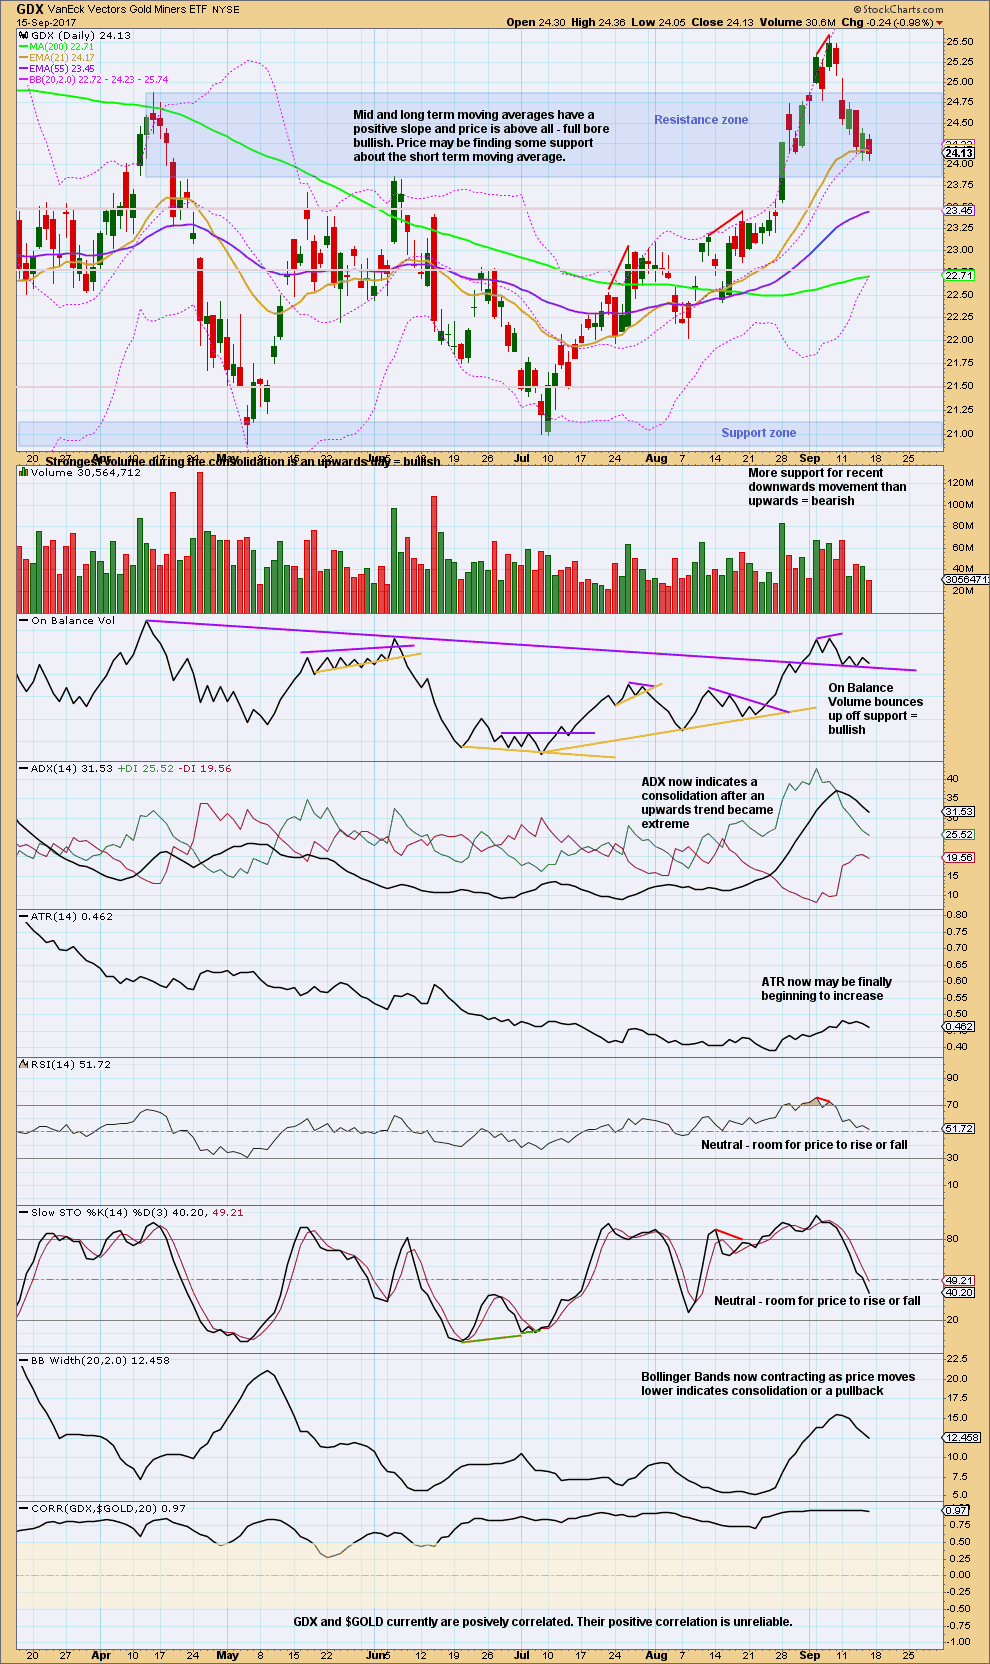
On Friday GDX fell of its own weight. Volume does not support the fall in price. Short term volume remains bullish. This looks more likely a pullback within an ongoing upwards trend than it does a new downwards trend.
Only ADX turning downwards from extreme looks more bearish.
GOLD THIRD WAVE EXAMPLE – DAILY CHART
Click chart to enlarge. Chart courtesy of StockCharts.com.
This section will be left at the end of analysis until either the current wave count is proven wrong, or the third wave we are expecting has completed.
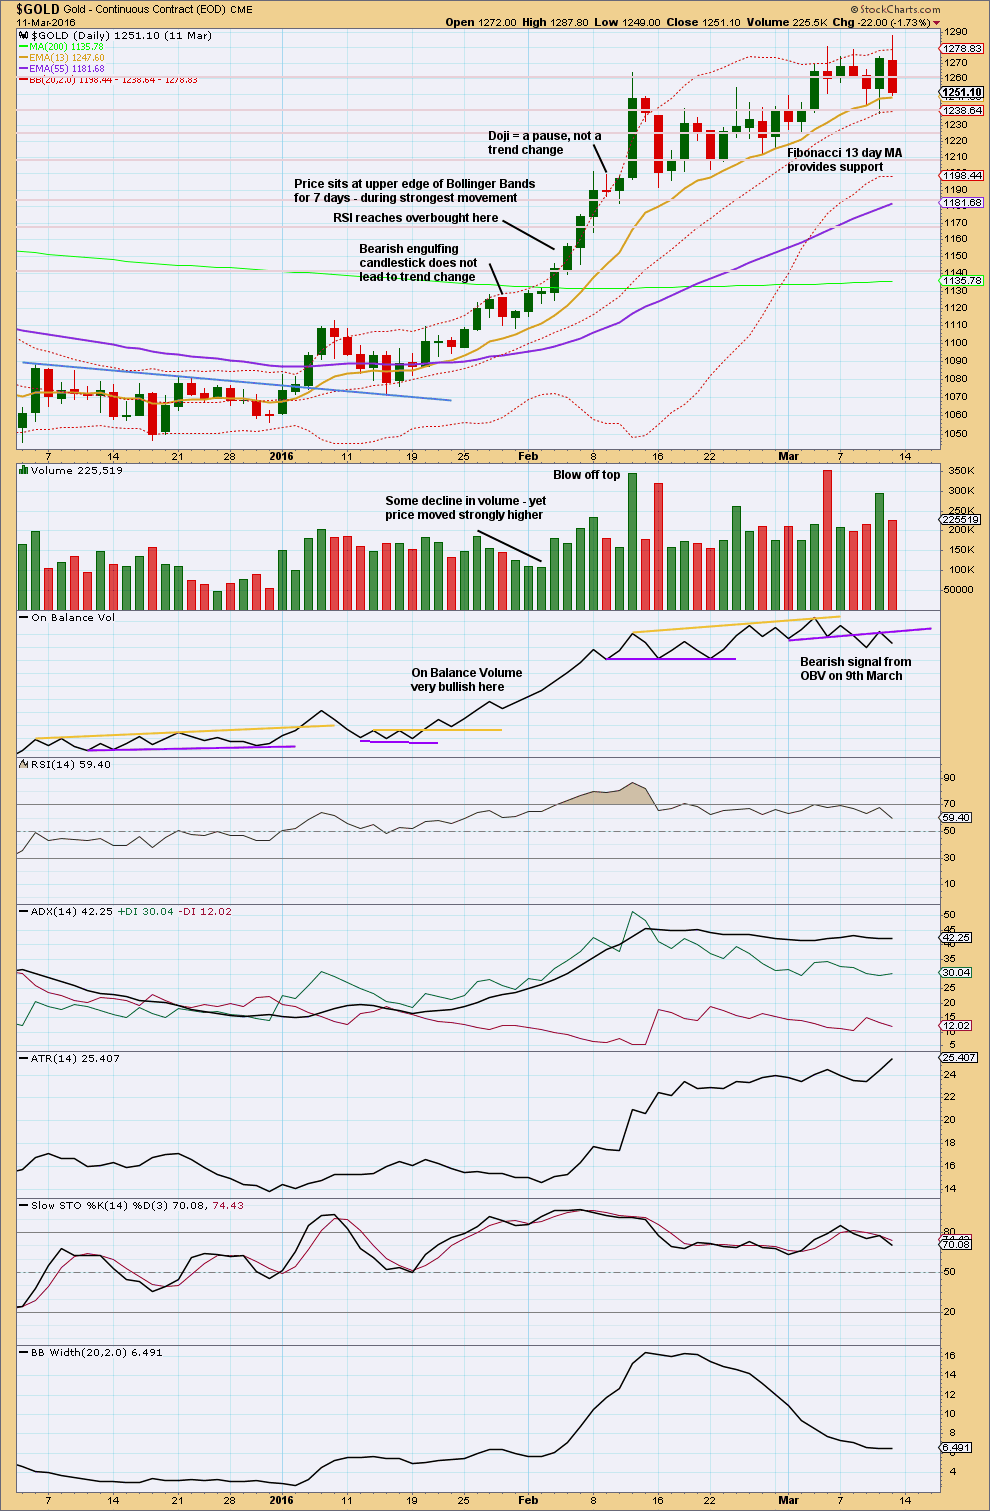
This chart has been published before. It shows the most recent example of a strong third wave in Gold from December 2015 to March 2016.
Note that during this strong upwards trend:
– RSI first reached overbought on the 4th of February and price then continued strongly higher for five more days culminating in a blowoff top on the 11th of February.
– RSI and Stochastics remained extreme for most of the second half of the trend. At the final high, they both exhibited strong divergence with price.
– Price found support at the short term Fibonacci 13 day moving average during the entire trend.
– All signals from On Balance Volume were bullish right up to the end of the trend. The 9th of March shows the first bearish signal, which was an important warning of a trend change.
– The trend begins with choppy overlapping and some hesitancy.
– The 6th of January was an important upwards breakout from resistance, with support from volume. Thereafter, price moved more strongly.
– While overall volume supported the upwards movement in price, this was not linear. Some weaker days occurred yet price continued higher. It is the overall trend of volume which is more important than any one or two days. On Balance Volume remaining bullish was an important guide.
No two waves are the same. So if the current wave count is correct, it may be different from this example. However, there are some important lessons to be learned here:
1. On Balance Volume is an important guide. Bullish signals should be taken seriously, particularly early on in the trend. Later in the trend, with RSI and Stochastics overbought, any bearish signal from On Balance Volume should see long positions closed.
2. RSI and Stochastics can reach extreme overbought. Only when they have been extreme for some time and then exhibit strong divergence should it be taken as a warning of a trend change.
Published @ 07:41 p.m. EST on 16th September, 2017.
Updated main daily count:
Price is now comfortably back below the Magee bear market trend line.
Playing with channels about prior upwards movement, this current pullback is now well below it, no matter how a channel may be drawn. That indicates that upwards movement was one wave, and this downwards movement is a separate wave.
A big question though over whether or not I can resolve the structure of minor wave 1 as a five wave impulse.
It will fit nicely as a zigzag, for the alternate.
Minute 4 of minor 1 as labelled has a better look than as minor 2 on former wave count.
True, and it has a better fit. But now this current pullback would be minor 4, the counter part correction to minor 2, and now it’s longer lasting and out of proportion.
Updated alternate wave count.
The bear market trend line, drawn as Magee describes, was held for 6 years. It was breached last week, and would then most likely have provided support.
Today support has given way. The trend line has failed. Now that it has failed, as of tomorrow I’ll remove it from charts.
These lines most often work, but that is not the same as always. That is the unfortunate nature of technical analysis; there is nothing that will work all the time.
And so I now have to consider swapping the wave counts over again. But before I do that I’m going to try and see if the last high could have subdivided as a five wave impulse. Could that be the end of minor wave 1? Could this pullback be minor wave 2? That would resolve the problem that the current main count has with that very shallow (and quick) second wave.
I’ve started to have another go at seeing if it will fit, and it’s ridiculously difficult. So I may try again a wee bit later and video the effort to illustrate how I develop a wave count. Some members seem to like that.
Back to normal after dealing with Irma. Power is back.
After breakdown from a 4 hour top HnS GSR is back testing the NL.
Lets see what happens here.
GSR at 75 appears to find a huge resistance before it was a support. GSR needs to back away from this area soon for gold to continue higher.
Good to have you back. This does look bullish for gold.
Good to know you’re safe, buddy.
At the moment, I am bullish longer term, but bearish in the immediate future.
Welcome back Papudi 🙂 And very glad to hear you’re okay.
Ichimoku Gold Intraday Update
Data as at 5:45 am ET, September 18
==============================
The daily chart presents a bleak picture of gold prices for today. Although the cloud is thinly green, the tenkan-sen is quite far below the kijun-sen and prices are hovering at or just below the kijun-sen. Moreover, at 7 pm ET, after market close, the cloud turns red.
I suspect that prices would be slowly declining possibly until the Fed meeting is over on Wednesday, as Dreamer suggested. Although there is the possibility of a technical rebound I still feel the downward slide is all the more probable. As such, I’ll be doing swing trades on the short side, as I have done since gold prices made the high of 1357.09 recently, inspired by the probable rising wedge. But note that these trades may not be highly profitable as the miners are not keeping pace with gold prices; their change is much smaller than what they ought to be, for a given change in price in gold.
Will gold hold support?
—————————————
Gold prices have risen mainly on the back of geopolitical tensions, notably North Korea, and the drop in the value of the US dollar. Now that North Korea seems to be under control at the moment, or rather that the UN Security Council has run out of options on containing North Korea’s nuclear programme, this issue appears to be undergoing a hiatus. The recovery in the USD also mitigates.
The important issues for the upcoming week include:
(1) the UN general assembly meetings in New York. Trump is planning to attend in order to garner support for increased pressure on North Korea. However, there were reports that Russia and China will be conspicuously absent.
(2) the FOMC meeting. The Fed is expected to release some of the details of its plan to trim its balance sheet. The plan is likely to call for the start of the reduction process in October. Reducing the balance sheet is a form of monetary policy tightening. This news may be enough to stabilize the U.S. Dollar over the short-term which should put pressure on gold prices.
(3) President Trump could be delivering his long-awaited tax reform package, which would of course be favourable to high-risk assets. Strong demand for these should also keep pressure on gold prices.
In terms of technical analysis, I have appended a chart taken off an analyst website. The analyst sees gold being in a H&S pattern with prices now dangerously slightly below the neckline around 1320. This calls for a drop towards the 1310-1300 region and eventually towards the 1280 region. Incidentally, 1280 is the lowest target for the rising wedge scenario I described just now. Its first port of call is at 1318, followed by 1310.
Oops. Posted the message without the graph.
I don’t favour the bearish case yet until evidence shows up to prove it such as a severe breach of the Magee trend line downwards. But, so as to include all possibilities, if the alternate count is correct, then Minor 2 becomes an expanded flat, with invalidation point at 1311.68 where minuette b exceeds 2.0 of minuette a.
Two possibilities come to mind:
(1) Minor 4 is not over yet. Its invalidation point is 1300.54.
(2) Minute 2 of Minor 3 is not over yet. This is the view which Dreamer and I subscribe to. The invalidation point is 1280.76.
If scenario (1) is correct, then we shall be a price rise in Minor 5, anytime between now and Wednesday at the end of FOMC.
If scenario (2) is correct, then a strong third of a third will begin. This is the more bullish scenario.
I agree Alan. I don’t favour the bearish case, until price shows us that it’s not respecting that bear market trend line.
So far it’s sitting right on it.
But if price continues down from here, then it will be below the line.
Good night, and good luck all. We shall know by the end of this session which count is correct.
Alan, I do so appreciate your posts.
Your outline of the possibilities and price points makes decision making easier. Its an added help to know to what you ascribe. Thanks again for your contributions (and Dreamer’s too). I’ve been on the sidelines awaiting this pullback. Good trading days ahead. 😉
Thank you so much, dsprospering. I feel invigorated from your positive comments.
Pondering: Nothing in it as yet for the longs to win it. Gold price is weak below 20dma with 1319-1323 presently limiting. Let’s get FOMC out of the way on Wednesday; upside risk 1340s with game on for 50% retrace 1205/1357 to 1280s….? Time will tell i guess.
Imo Gold price remaining trapped under 1315 would likely open up 1305….
A beak below 1305 would likely seek 1299-1296. CCI on the daily is below zero signaling a bearish trade; CCI on weekly seems to be heading for a break below 100 which would be bearish, Stochastic %K has enough in it for further downside; upside remains toppy under 1319-1323; imo Gold price should be in a bottoming process though….
i already told gold buying is cery risk dnt buy last two weeks to im saying gold sell side is gud
You have not shared any reasoning for your calls. No technical analysis. No charts.
This is a technical analysis website. Not a random prediction website.
If you wish to make gloating comments when you are right, this will not end well.
If you are not contributing to this membership in your comments then your membership will be removed.
This is the one and only warning I will give you.
Viky, you seem to have some strong opinions. Please share your reasoning with us so that we can all learn together. Thanks!
Viky. You have made a good call. Perhaps you could share with us your reasons for such. I can tell that English is not your strong point, but it is appreciated if you could give us some ideas. Thank you.
Looking for mostly sideways movement until Wednesday’s Fed meeting. Statement @ 2pm EST
Hi Lara,
I was reviewing your monthly charts-
1st fr. June 7- based on current Main count
2nd fr. Aug 28- based on Alt count
In both instances can you share time expectancy for:
Cycle wave ‘b’ to complete and
for Super Cycle wave (a) to complete?
Much appreciated….thank you…
If cycle b is a triangle, then it may continue for another 6 months, maybe more.
Cycle c after that should last at least one year, and may well last a few years.
So at least 1.5 years to compete super cycle (a), and maybe up to 3 or more years.
If cycle b is a double zigzag then it may end more quickly, maybe another 2 months. Then cycle c still needs to be at least one year, and it may last a few years.
So at least 1.25 years to complete super cycle (a), and maybe up to 3 or more years.
Thank you Lara,
I do know that you do not have a crystal ball. With this in mind, I did forget to ask your thoughts about targets for Super Cycle (a). I am seeing so much variance from other analysts. Some that we should hold the Dec 2015 low, others that project our going as low as previous Primary degree (?) 4th wave, approx 763ish from 2008.
The cycle analysts explain this expected drop in gold as a final drop before a much more extensive bull can begin.
Your thoughts….thank you…
Melanie, if I may present my thoughts.
At the moment, I would say it is almost impossible to pinpoint with any degree of accuracy what the target for Super-Cycle A will be. Any analyst who offers a number does so based on his/her perceived wave count. But then, who can say for sure their wave counts are correct? I have come across many analysts who begin blaring his/her horns when the trend is strong. Once the trend turns, amazingly they go into hiding. They will come out of hibernation only when the coast is clear. Not so, Lara. She keeps on doggedly with her wave counts day after day, and is not afraid to change course once the trend changes.
Coming back to your question. I cannot even say for sure how Intermediate C will end. There are so many possible scenarios at this point. Once Intermediate C is dealt with, the next question is Primary Y. Is it a 5-wave structure or a 3-wave? If 5-wave, then Intermediate C is actually Intermediate 3, and there will be Intermediate 4 and Intermediate 5 to come. Once this is settled, it yields the end of Cycle B. Then the last question will be the relationship of Cycle C to Cycle A. Only when these questions are answered correctly, then we can arrive at the target for Super-Cycle A.
With the few probable scenarios I am looking at, my ballpark figures are in the range of 712 to 840, based on current known information, and these are worked out assuming good Fibonacci proportion but they need not be. These values are highly susceptible to change once more data surfaces. Lara may be able to throw some light, but whatever it is, I’m pretty sure it tantamounts to nothing more than mere conjecture at this point. Why do I say this? It is what we would mathematically call “cumulative error”. And this grossly reduces the probability of an event.
Your final query: “The cycle analysts explain this expected drop in gold as a final drop before a much more extensive bull can begin”. Sure, but with a caveat. That would be Super-Cycle B. But then, Super-Cycle C would be a much bigger drop than Super-Cycle A. To me, the real big bull run is only at Grand Super-Cycle 5.
Melanie, Long time no post. Good to see you’re still out there…😀
Hi Dreamer,
Thank you. Like Papudi…dealing w/aftermath of Irma. Everyone safe….dock up in the air, etc., but we will work on all of this slowly to repair.
Because of other responsibilities, I have little time to post. The efforts you and Alan make to share your works by posting is invaluable and highly appreciated. I also appreciate Papudi’s GSR charts.
Free Pro Services week @ EWI. As you are considering, Denham’s current main count of gold now retracing minute iic of Minor 3 [my degrees could need some work.], I am also keeping an open mind to this count, noting that his current main weekly count is the triangle and that he sees 1380ish as the target, similar to Lara. Regardless, looks like we need a bit more work to downside first.
Have a good week…
Yes, I saw the EWI count. I don’t think his weekly matches his more bullish daily. Need to see a new weekly.
Weather has certainly been crazy. Best wishes
I agree with you….Dreamer. His bullish dly/intraday count is a mismatch to his current main wkly triangle count. His secondary wkly count, an A-B-C [similar to Lara’s current main count W-X-Y] targets the
1460 range and looks to be a better match to his immediate count.
Thank you for your thoughts….I fear that I need to move off the coastline. The ocean and inlets are Not the only thing rising. Flood insurance is rising swiftly! But I am a bit lost as to where… besides Colorado or very northern AZ….we’ll see.
Thanks Melanie. It is good to know that you and Papudi are safe. Irma had been considered to be very severe, a Category 5, but fortunately it fizzled out before it made landfall. Even then, the damage wrought was substantial.
The “minute iic of Minor 3” scenario is the second possibility I considered in my much earlier post at 3:33 am. At the moment, several possibilities occur. I’m afraid we can only safely say for sure which one is correct once Wednesday comes, the latest. That’s why I say I’m doing swing trading on the short side. It is rather dangerous to attempt any serious trade at the moment. I don’t have the clairvoyant ability of Viky, who is deadly accurate despite no technical basis to his posts. Added to this is that my luck happens to be the same as Murphy’s: what can go wrong, almost always will.
Hi Alan,
Thank you for your kind words and taking time to post your 11:59am response.
Yes…I well realize this is all probability and no certainty long term and short term. We’ll have to take it one day at a time to get to Grand Super Cycle V…definitely promising the most bullish scenario.
I am sure Murphy’s law is familiar to many on this site. I seem to hit the ‘unlucky’ side of that law, more often than not…myself.
I am asking Lara to respond to these questions to simply get a perspective on her long term outlook for time and targets because I respect her work compared to others. Lara’s is always willing to take the time to show us in detail many aspects of her thinking. Lara also has the ability to change her thinking relatively quickly, and has the courage and discipline to get back to ‘the desk’ to build on an alternative or new course to present.
Your target for Super Cycle (a) is somewhere about the higher degree 4th wave low from 2008. We will ‘Not hold our breath’, but it is good to know others with ability, like yourself have come to a similar conjecture.
Let’s face it. Trading has its treacherous aspects. Most business do.
Best regards….
Time for alt?
Not quite yet.
If this session keeps on going lower then yes, we shall have to consider the alternate. If that happens then the Magee trend line would have simply failed.
But right now, price is sitting right on that line. It hasn’t breached it yet.
For a line which is this long held (goes back to 2011) we really should wait for a full daily candlestick below it before we may have confidence that the line has failed and price may be in the next wave down. Because when lines are that long there is a bit of leeway in exactly how they sit, so we need the breach to be clearer.
Thank uou
Lara,
When I look at the 3 puzzle pieces, Gold, Silver, & GDX, Gold seems to be the one out of alignment.
In other words, for Silver to hit your target and for a DZZ in GDX to at minimum allow wave Y to end above wave W, Gold needs to move much higher than your 1,376 target. I think your Y = W target of 1,452 for Gold on your weekly chart is much more likely.
I heard you state on your video that you are open to updating your count as more structure develops.
I also know that you treat each market separately and don’t like to base one count on another, but I would like to share a simple ratio comparison with Silver.
This chart compares the move up since the July low for both Gold and Silver, computes a ratio, then calculates a new target for Gold based on your Silver target (which I like your updated Silver count).
As you can see, my calculated target for Gold is very close to your Y = W Gold target @ 1,452.
In summary, I think your Gold count will likely need to be updated in the coming weeks to reflect that Minor wave 4 has not yet started. I’m still looking at the idea the current Gold correction is Minute wave 2 of Minor 3.
I guess time will tell
https://www.tradingview.com/x/NxpJfVBs/
I like this idea of recent high being minute 1 of minor 3. A 61.8% retracement will see us testing Cyan Magee trendline. Thinking there is only about 10$ to the downside with a lot to the upside. Would get concerned with daily close somewhat below 1309 level.
I agree Dreamer. I’m not so happy with the minor 1-4 over count on Gold. But at this time I’m struggling to see another way to count it, if support at the Magee trend line holds.
And so I wished to wait a few more days for a bit more structure to make things a bit clearer.
The 1,452 target is entirely possible.
And of course, the easiest and best alternate is to move everything down one degree. If we do get a bounce up to new highs from here then we shall have a five wave impulse upwards complete. That may be only minor wave 1. Minor wave 2 could be a pullback to again test support at the Magee trend line.
Lara. I love this possibility. Let’s wait and see if prices do go lower and breach the Magee trend line unequivocally. If so, a more bearish stance is possible. It could be another instance of the end of Primary W at 1374.91 when almost everyone was gungho about the rise in price in gold. Then again, this may well be just a deep correction. It is possible to look at the price rise from 1280.76 to 1357.09 as a rising wedge: 1280.76 – 1325.67 – 1301.09 – 1343.98 – 1332.22 – 1357.09. And the drop following a rising wedge formation is often very deep. In some instances, the entire price rise is retraced.
Fair enough. More structure and the pieces will fit better. 🙂